I mentioned in a recent post that I tried to use the FlowJo plugin for tSNE analysis, but wasn’t satisfied with the results. I will highlight some of the strengths and weaknesses of this tool using the data from Kimball et al 2018.
The biggest issue I have with this tool is that there is no expedient way to run an analysis on all of the samples at once. For instance, in viSNE or Cytosplore you can upload each FCS file (e.g. 9 FCS files total), select all of the files for clustering (e.g. B6 #1-5; IL10KO #1-4), determine an input methods (equal events, all events, etc.) and then select markers for clustering. After clustering is finished you can visualize all of the input events on the tSNE plot, or select each individual sample. This is essential for comparison between samples as the geography of each tSNE plot will be identical (e.g. the CD4 T cells are are the 2 o clock position), but the abundance of events in each island, and the expression of various markers, will differ between samples.
However, the tSNE plugin in FlowJo doesn’t allow you to select all of the samples for clustering, you either have to: 1) analyze each sample separately, 2) concatenate all of your replicates together in each condition and then analyze, or 3) concatenate your replicates together regardless of condition, include sample ID when clustering, and then identify each sample via gating after clustering.
First I tried to analyze each sample separately. First, I had to use the plugin “downsample” to downsample the events (for example, one sample had 247,945 events). This plugin randomly selected a user defined number of events and creates a new version of the FCS file. Downsampling is essential to this process for two reasons: 1) the more events you analyze, the longer the analysis takes, and if you try to analyze too many events FlowJo will freeze/crash, 2) I want to be able to compare my replicates, so I want to equally sample the available events for each.

An example of downsampling, the original FCS file had 247,945 events, I used the downsampling tool to randomly select 9,141 events for analysis. 9,141 was chosen as that is the # of events in the sample with the lowest number of events.
After downsampling all of the samples, I ran a tSNE analysis on each individually using identical settings. As you can see, even though the overall expression and shape of the tSNE plot look similar between replicates, it’s very hard to interrogate visually.

All of these plots are colored according to CD45 expression, note that the maximum value for CD45 expression varies between plots due to the different events used for each.
The next approach I took for analysis was to concatenate all of the replicates together (so that I had 2 concatenated files for each experimental condition) and analyze them using identical algorithm settings. Here are the two tSNE plots that were generated colored by a variety of lineage markers. The biggest issue with this approach is that you don’t know what events came from what sample. Furthermore, you still cannot visually detect major differences in cellular populations due to their differing geography.

You could determine gates for major cellular populations for each tSNE plot and then easily compare cellular abundance and expression (e.g % of CD4 T cells, MFI of Tbet expression in B6 vs IL10KO).
The last method I tried was concatenating the files and clustering on all relevant markers and sample ID. I tried this using the concatenated IL10KO replicates (n=4), but you could concatenate all 9 files together across conditions (I limited it to IL10KO replicates as this was the option with the lowest # of events which resulted in a fast tSNE run). After the tSNE analysis I visualized the events by the variable “Sample ID” and gated the 4 distinct populations for each sample (please note that it is unclear what replicate is which population, so I have just labelled them as “sample” rather than a specific replicate ID). Thus, with a lot of work, you can then visualize events from specific replicates on the tSNE plot much like in viSNE or Cytosplore.

In addition to the major issues with the plugin discussed above, FlowJo also only offers one color palette you can use, unlike viSNE (~6 options) and Cytosplore (~12 options).

In addition to coloring the data by heatmap statistics, you can choose from a variety of dot and density plots (contour, density, zebra, and pseudocolor) just like you would for traditional flow cytometry data.

However, there are some advantages to the tSNE plugin in FlowJo. For instance, if you’re familiar with the various tSNE algorithm settings (this is a great resource for understanding) you can easily customize settings for your analysis, such as: iterations, perplexity, and the learning rate. A major advantage is that you can control the boundaries of the tSNE axis, this means you can standardize the axes values across different samples, something you can’t do in any other analysis program and has presented a significant issue for us in the past (see below as an example).

It’s also convenient that you can gate populations directly on the tSNE plot much like traditional flow data. You can then color these user-defined populations in the layout editor to make a plot like this:

You can also easily examine specific populations of interest. For instance, a histogram overlay comparing the expression of Tbet in CD4 T cells in Sample 1 vs Sample 2.

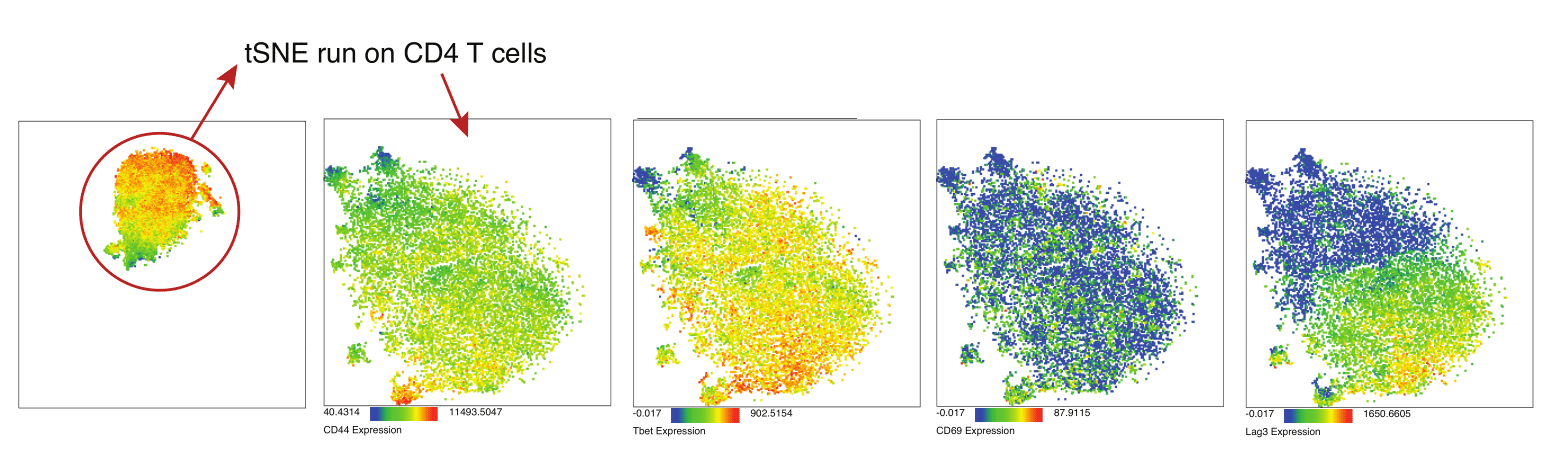
You can even quickly run an additional tSNE analysis on the CD4 T cell island:
Overall, much like Cytosplore, I think the tSNE plugin for FlowJo is a great free and accessible tool for users who have recently started analyzing mass cytometry data. This is especially true if they are long term users of FlowJo as the learning curve will be very low. Depending on what type of questions you’re asking, the issues I’ve discussed may not impact your analysis. Personally, I think the inability to readily identify particular samples is a major bug in the program that the developers should fix before I will adopt it into my analysis workflow. I also wanted to mention that It’s also important to keep in mind that this tool can be used for any type of dataset, not just mass cytometry, I have personally used it for flow cytometry and IHC datasets and found it to be very useful.
Useful resources: live demo using the tSNE plugin, a guide to using the downsampling plugin in FlowJo, a guide to tSNE settings,
-Abby