Today I’m trying out the software Cytosplore! I tried getting this program to work about a year ago, but at that time they only had a version of the software for PC and our ancient Dell couldn’t handle it. But now that they have a version for Mac, I thought I’d try it out on the dataset from our JI paper (you can find the fcs files here).
I think Cytosplore could be a great free alternative to Cytobank for using the SPADE and tSNE algorithm. There is an R script for SPADE, but I haven’t tried it as we don’t have much use for SPADE. As far as tSNE, FlowJo recently released a plugin for tSNE analysis, but I’m not a huge fan of it (I’ll explain why in detail in another post). In addition to SPADE and tSNE, Cytosplore also allows you analyze your data using the Hierarchical Stochastic Neighbor Embedding (HSNE) algorithm. I’ve wanted to play with HSNE for a while as it allows the analysis of very large high-dimensional data sets. A major issue with tSNE and PhenoGraph is that they limit the amount of events you can analyze due to computational power and/or crowding visualization (I discussed this issue here). However, with the HSNE and UMAP algorithms you can analyze much more data… so let’s test it out!
This is a great video explaining how to use Cytosplore. Seriously, it usually takes me weeks to figure out new software/code because the developers don’t have accessible how to guides, but this one has a fantastic video demo. I had no issues with the downloading or opening of the software and overall it was very intuitive to use.
Using the tSNE Algorithm in Cytosplore
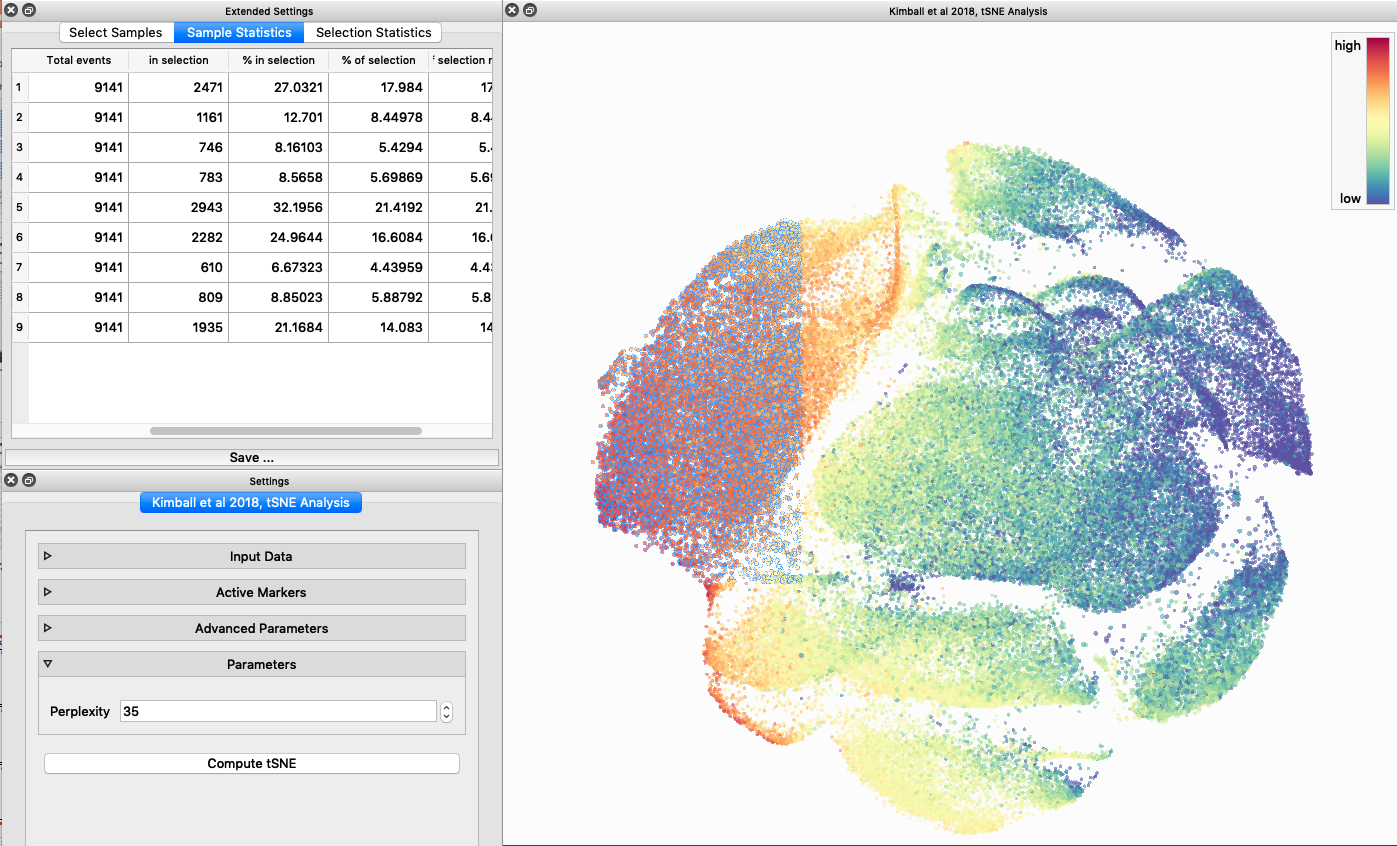
As I mentioned above, I used the preprocessed data from our JI paper (normalized and gated from live singlet events). I selected the relevant markers (35 total), used the default settings for perplexity, and I tried to analyze all events (~1.2 million events) using the tSNE algorithm. This froze my computer (which I expected to happen), I had to force quit and try again. After reopening the program I used identical settings, but this time I downsampled the data, so all samples were equally represented (9,141 events from each, 82,269 events total). It took about ~20 minutes to finish analyzing my data (and it was super cool to watch as it did!).
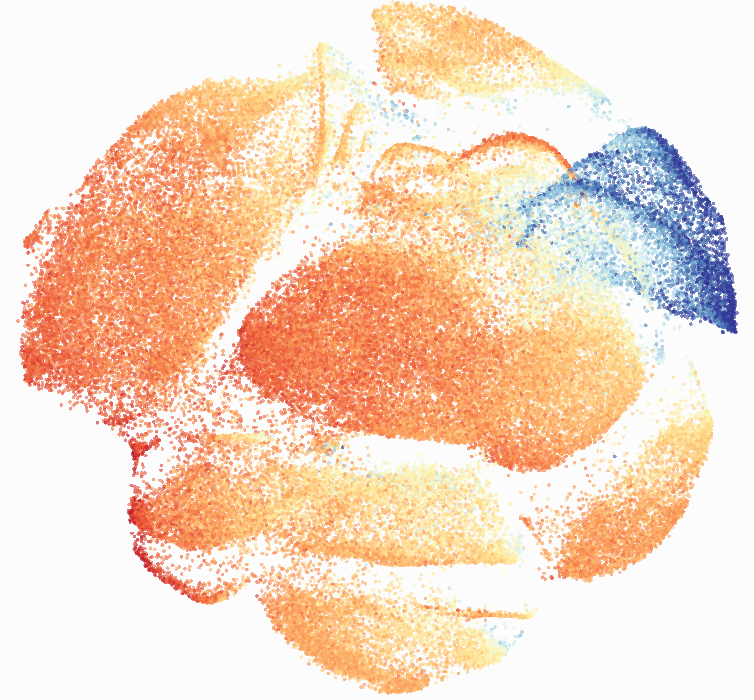
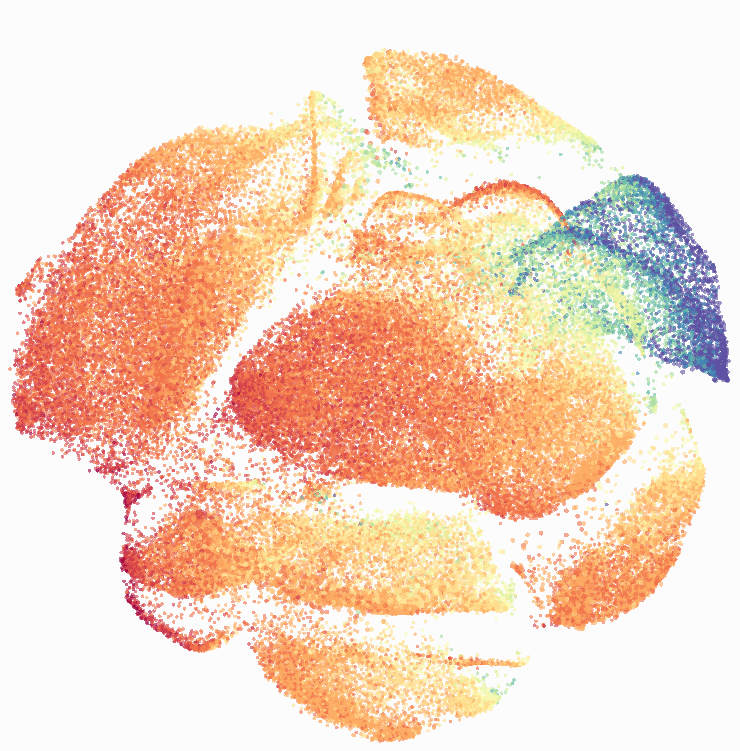
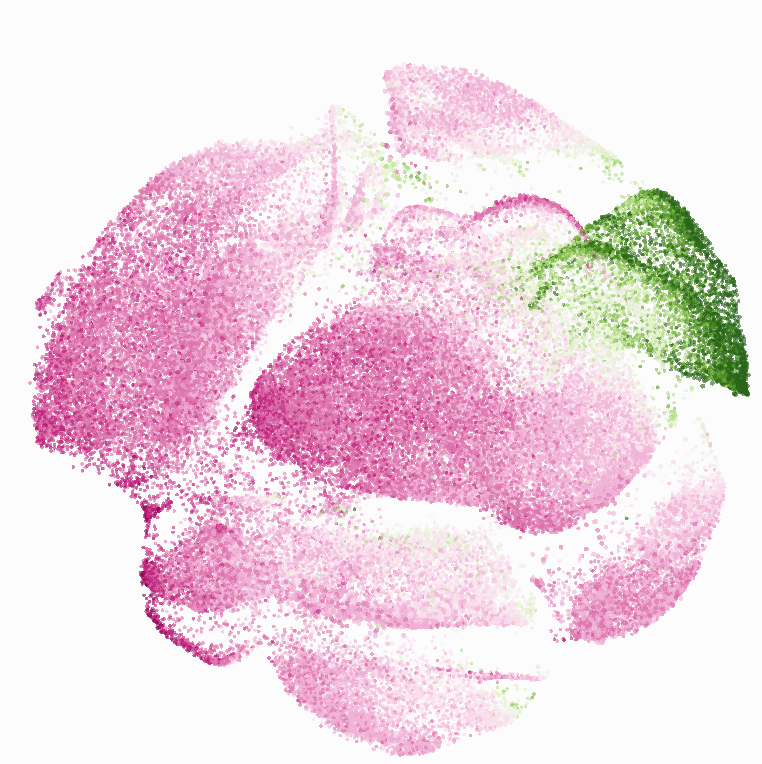
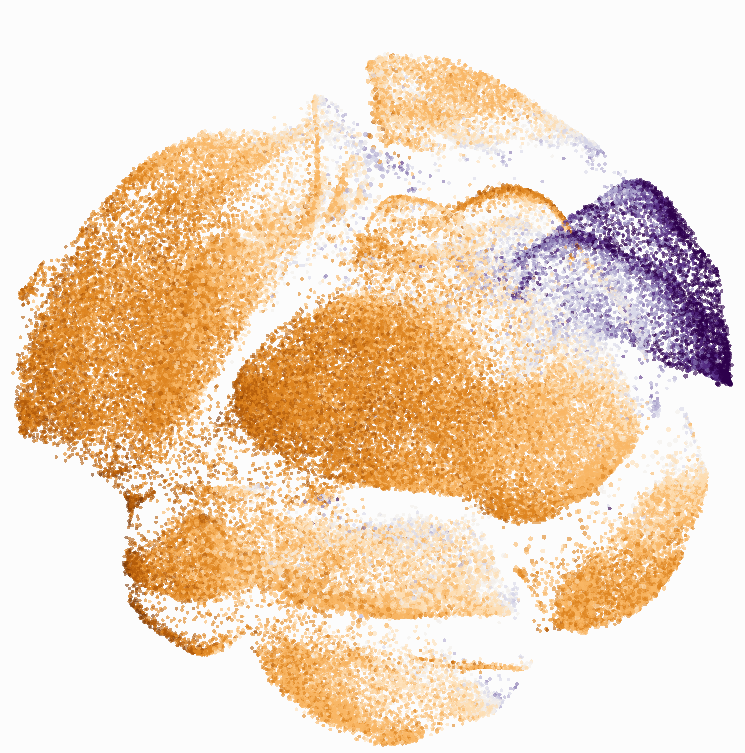
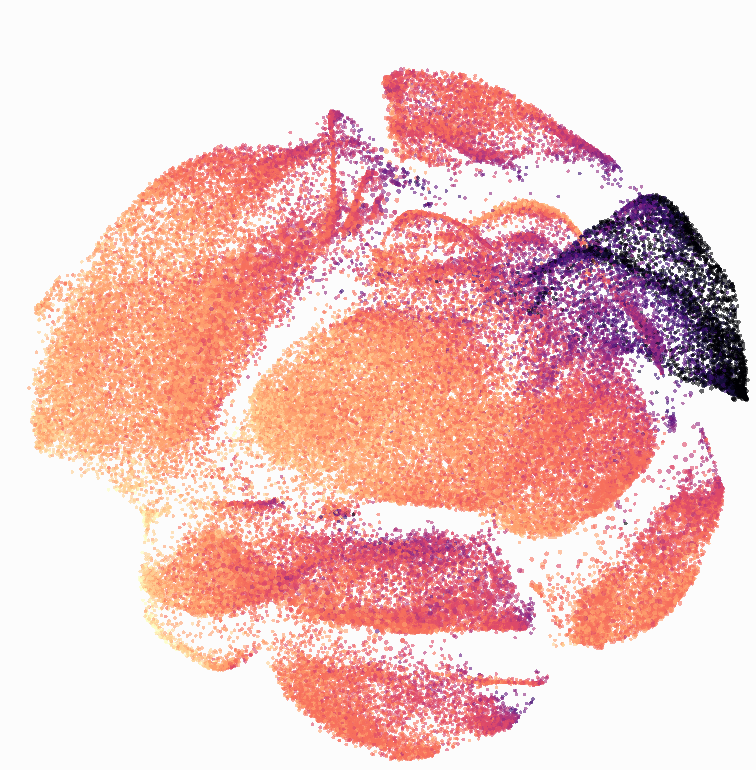
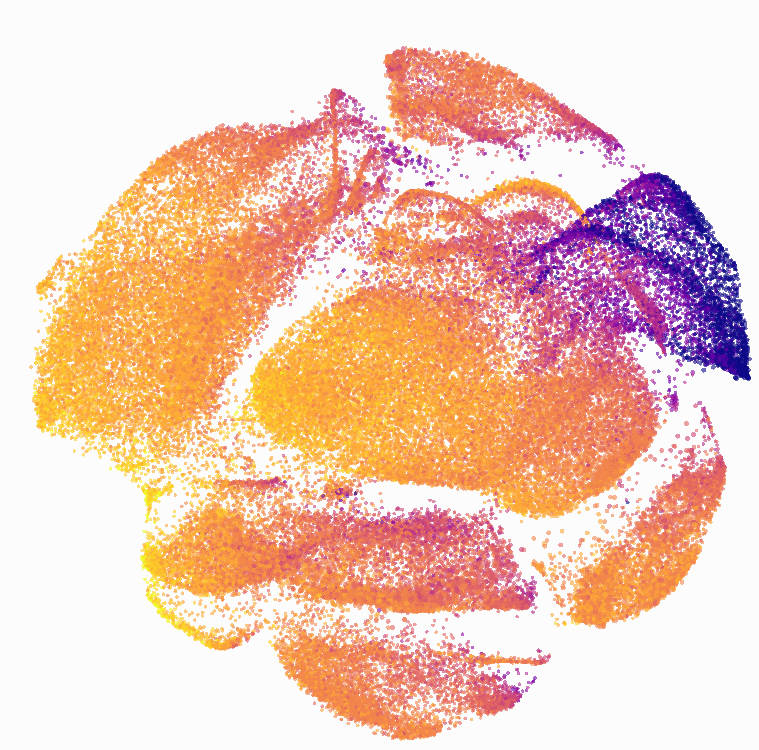
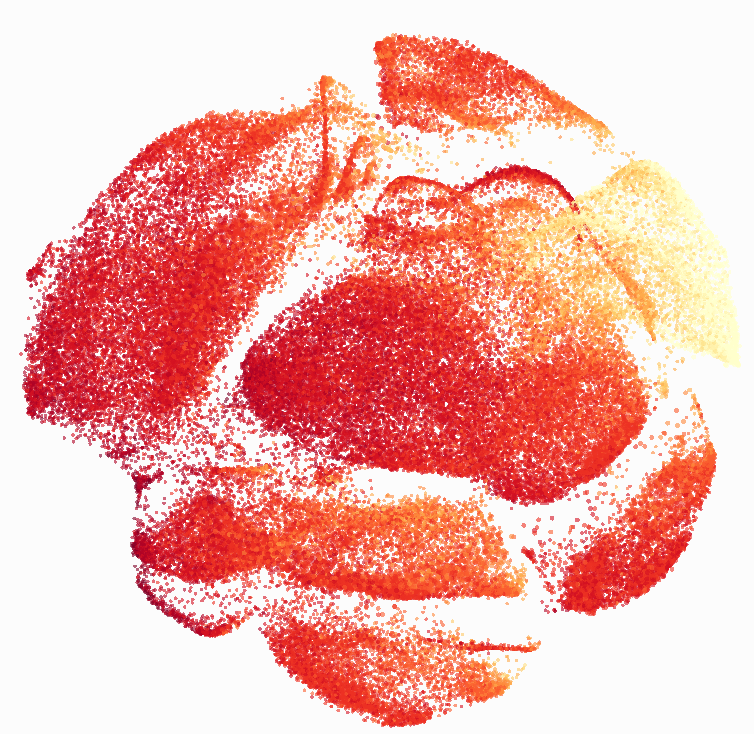
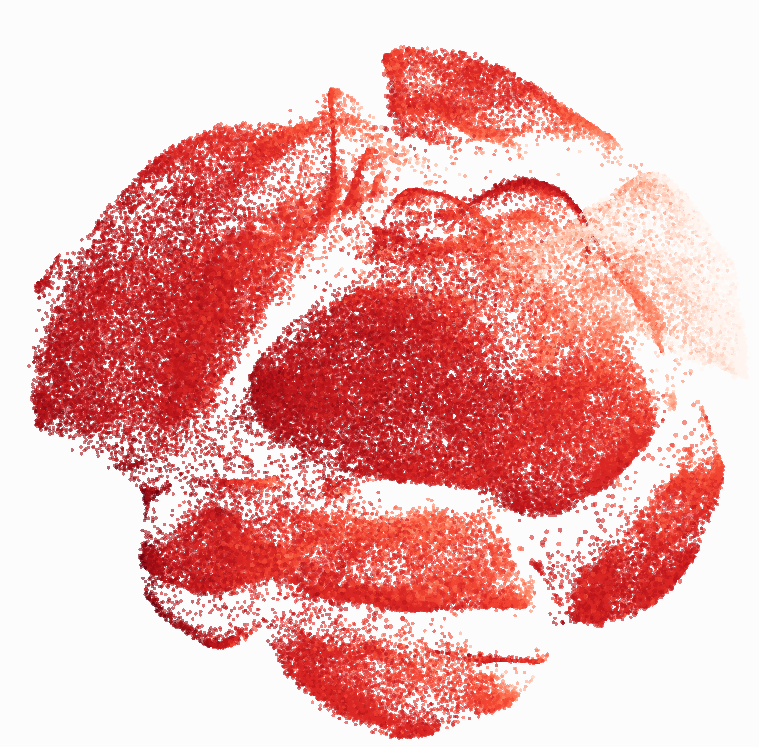
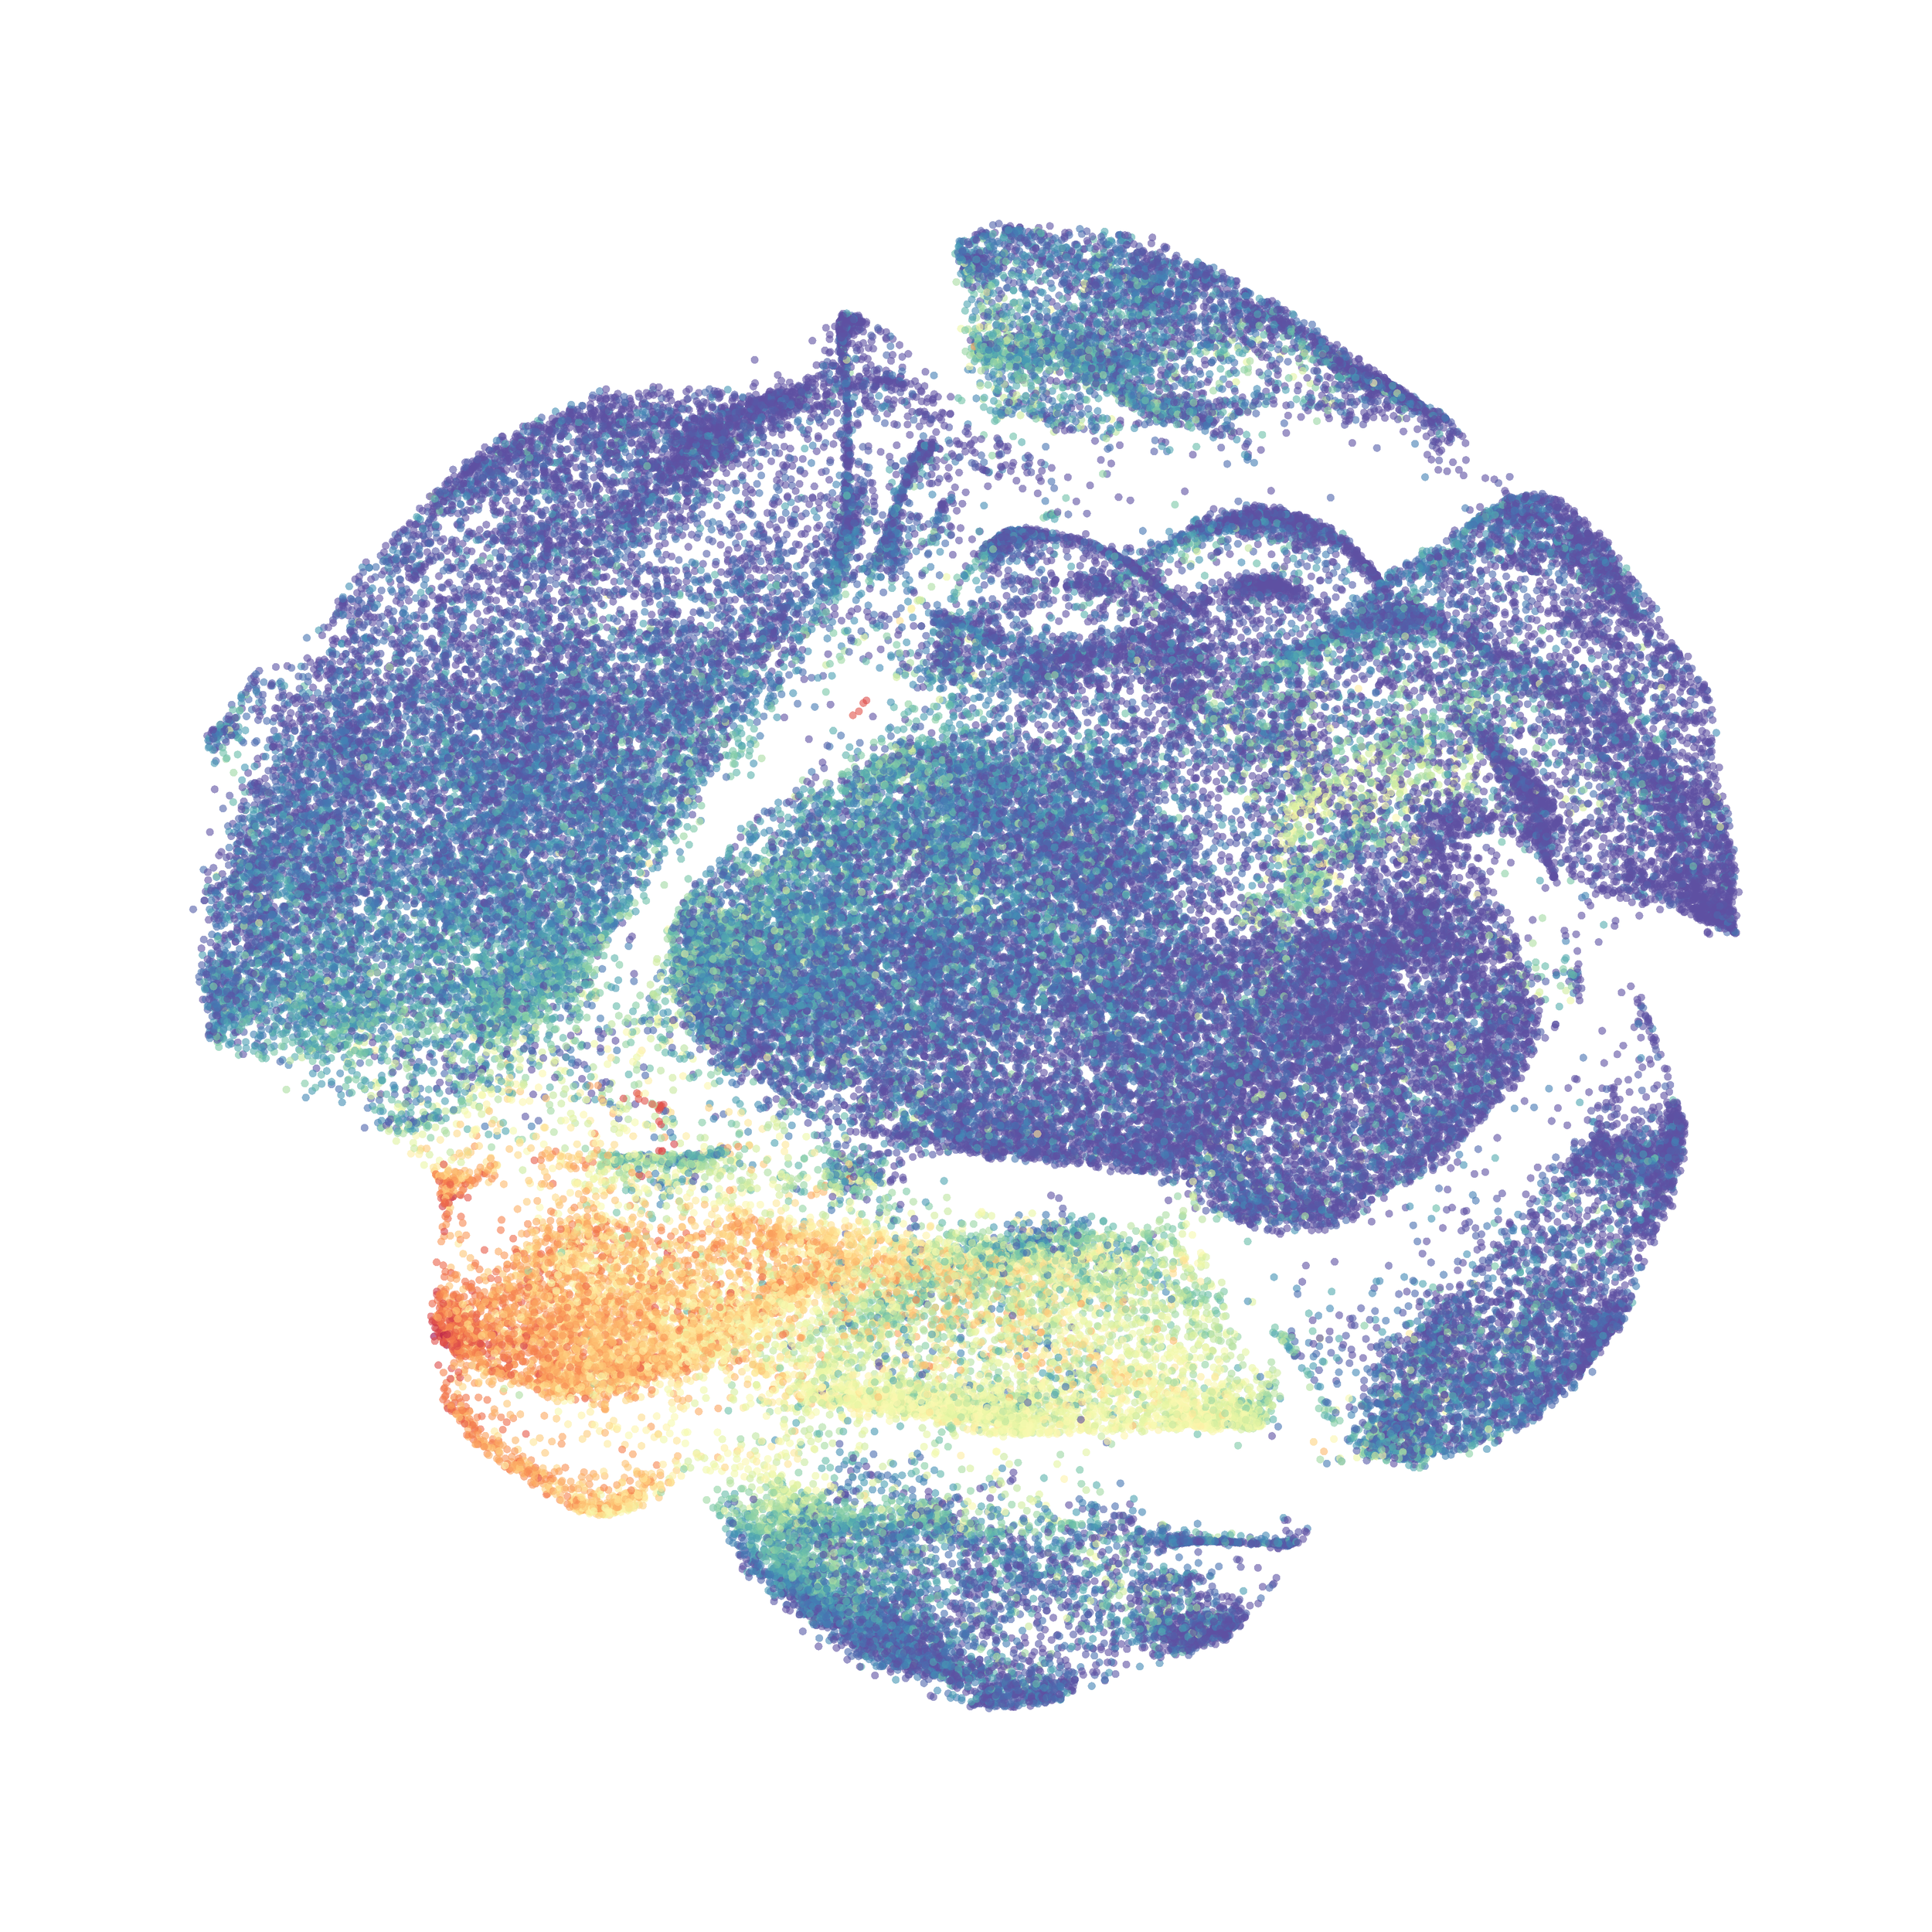
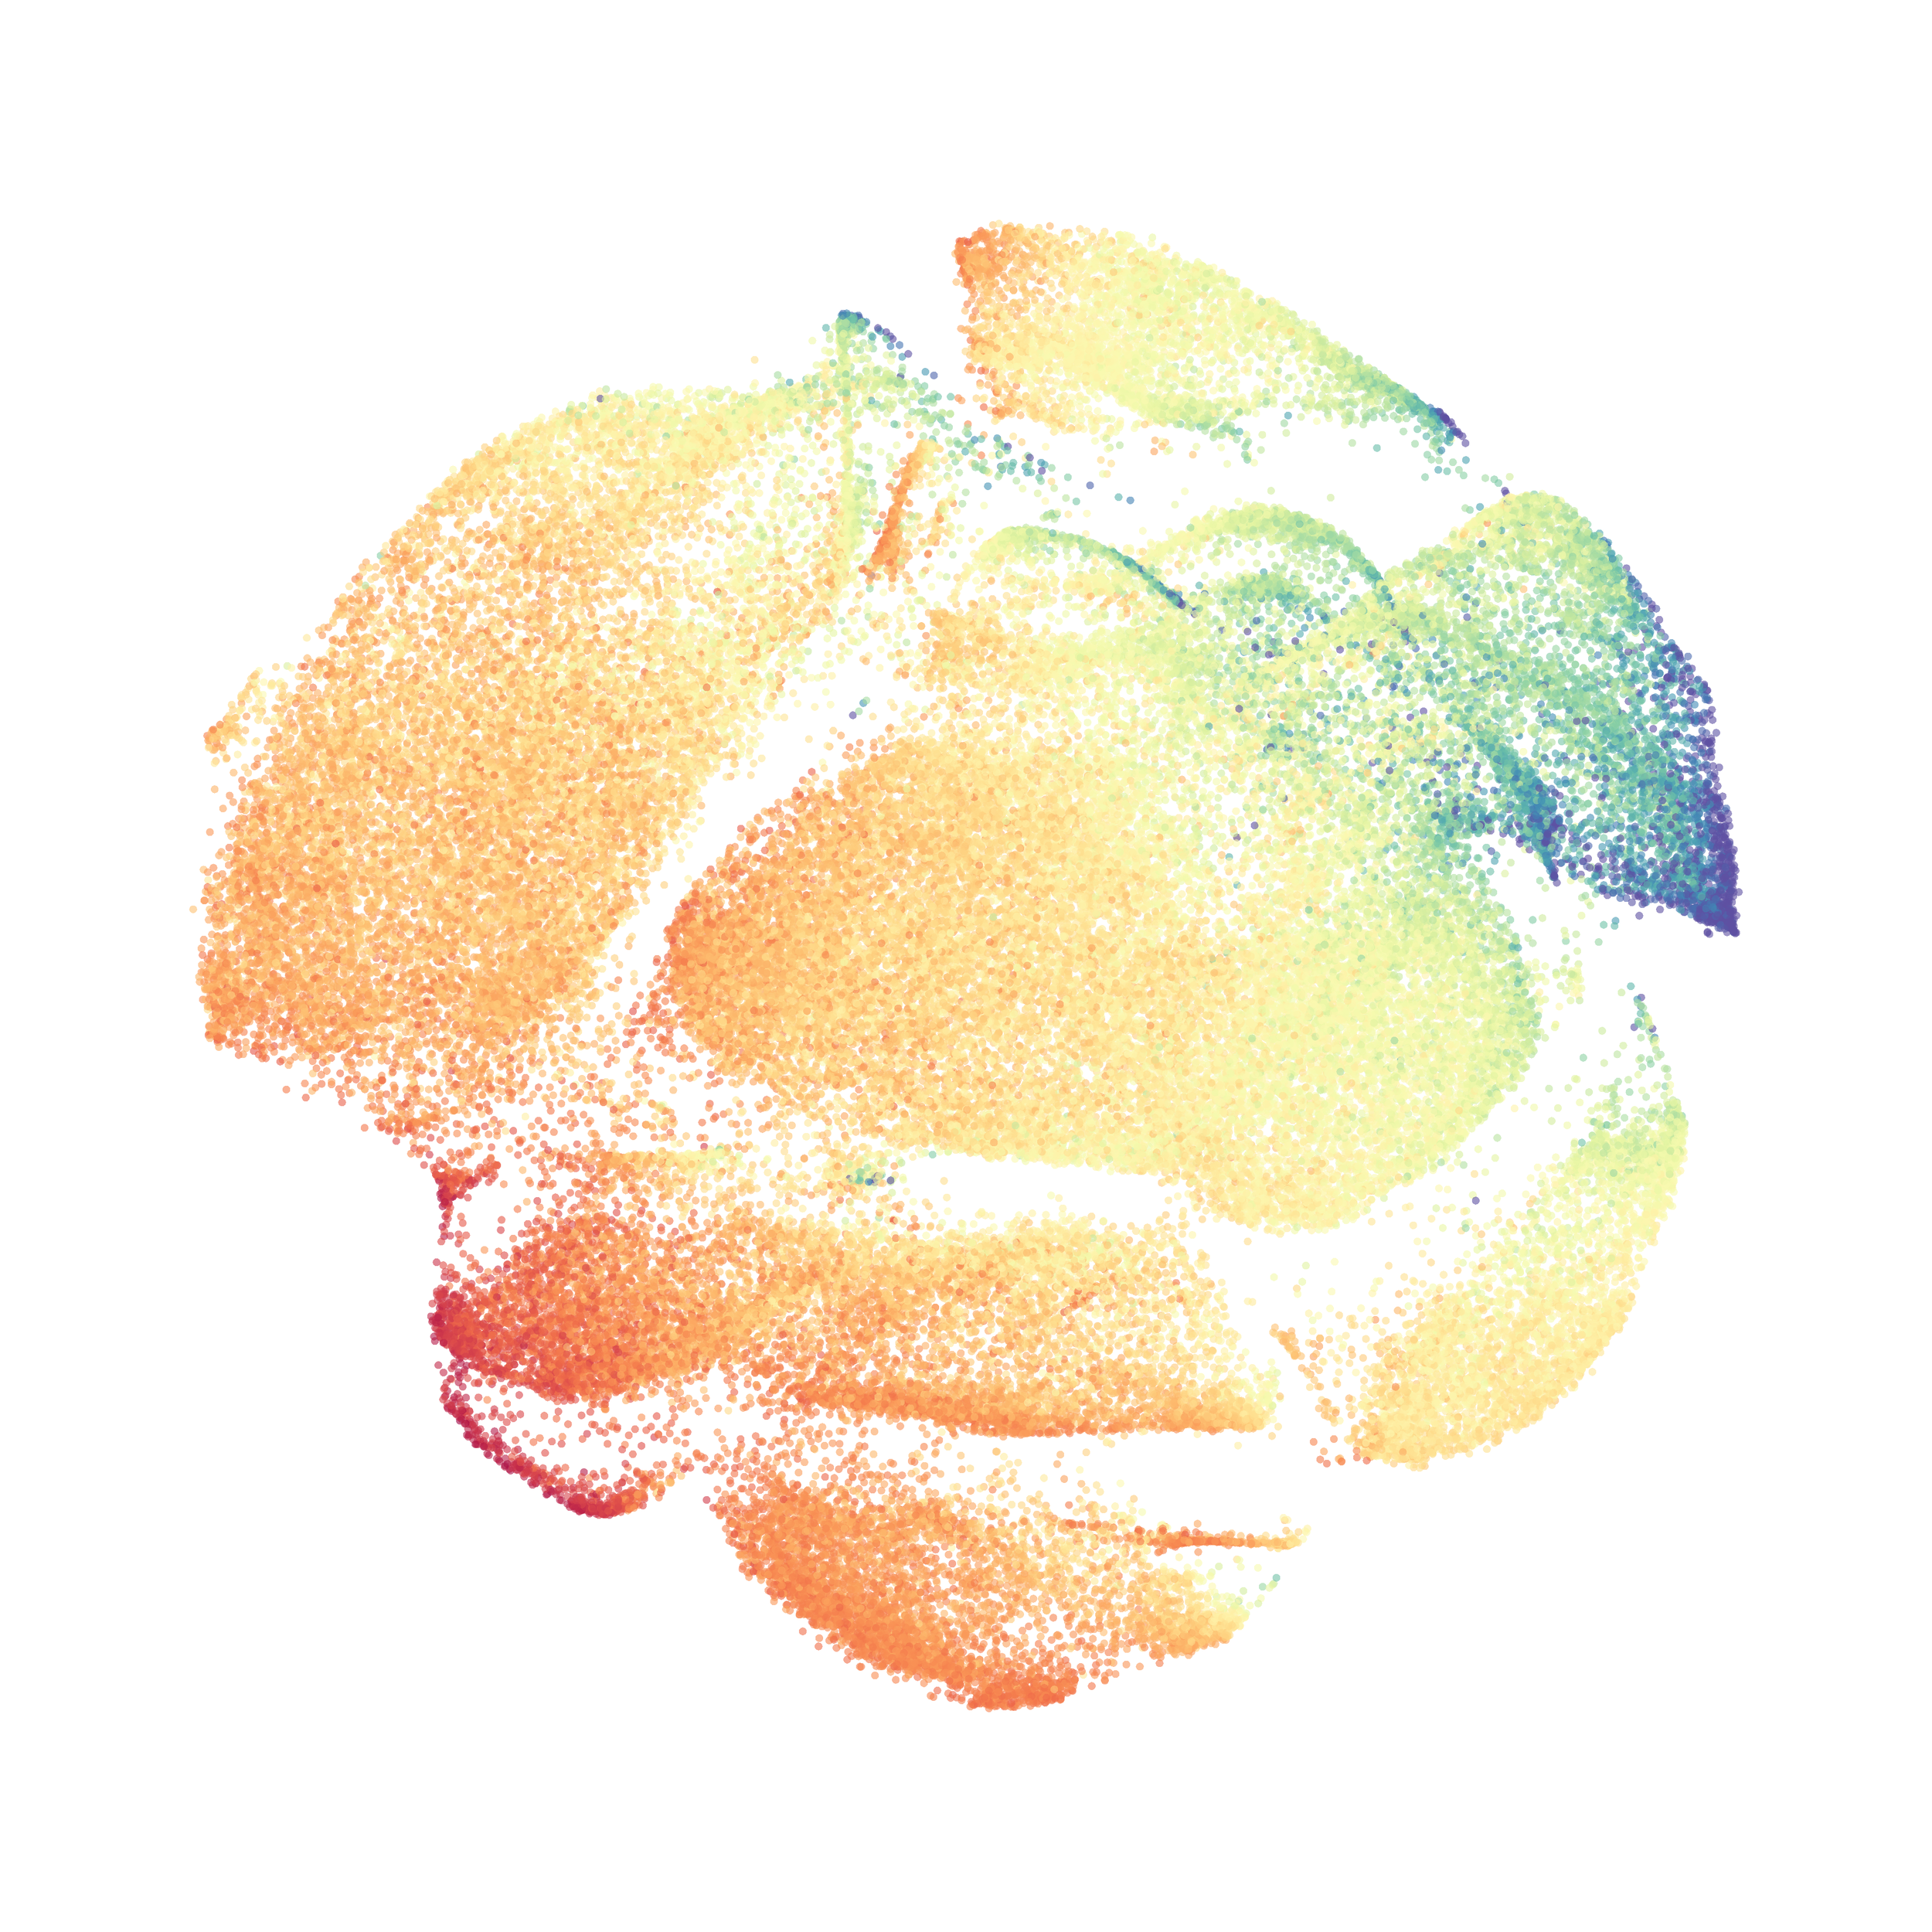
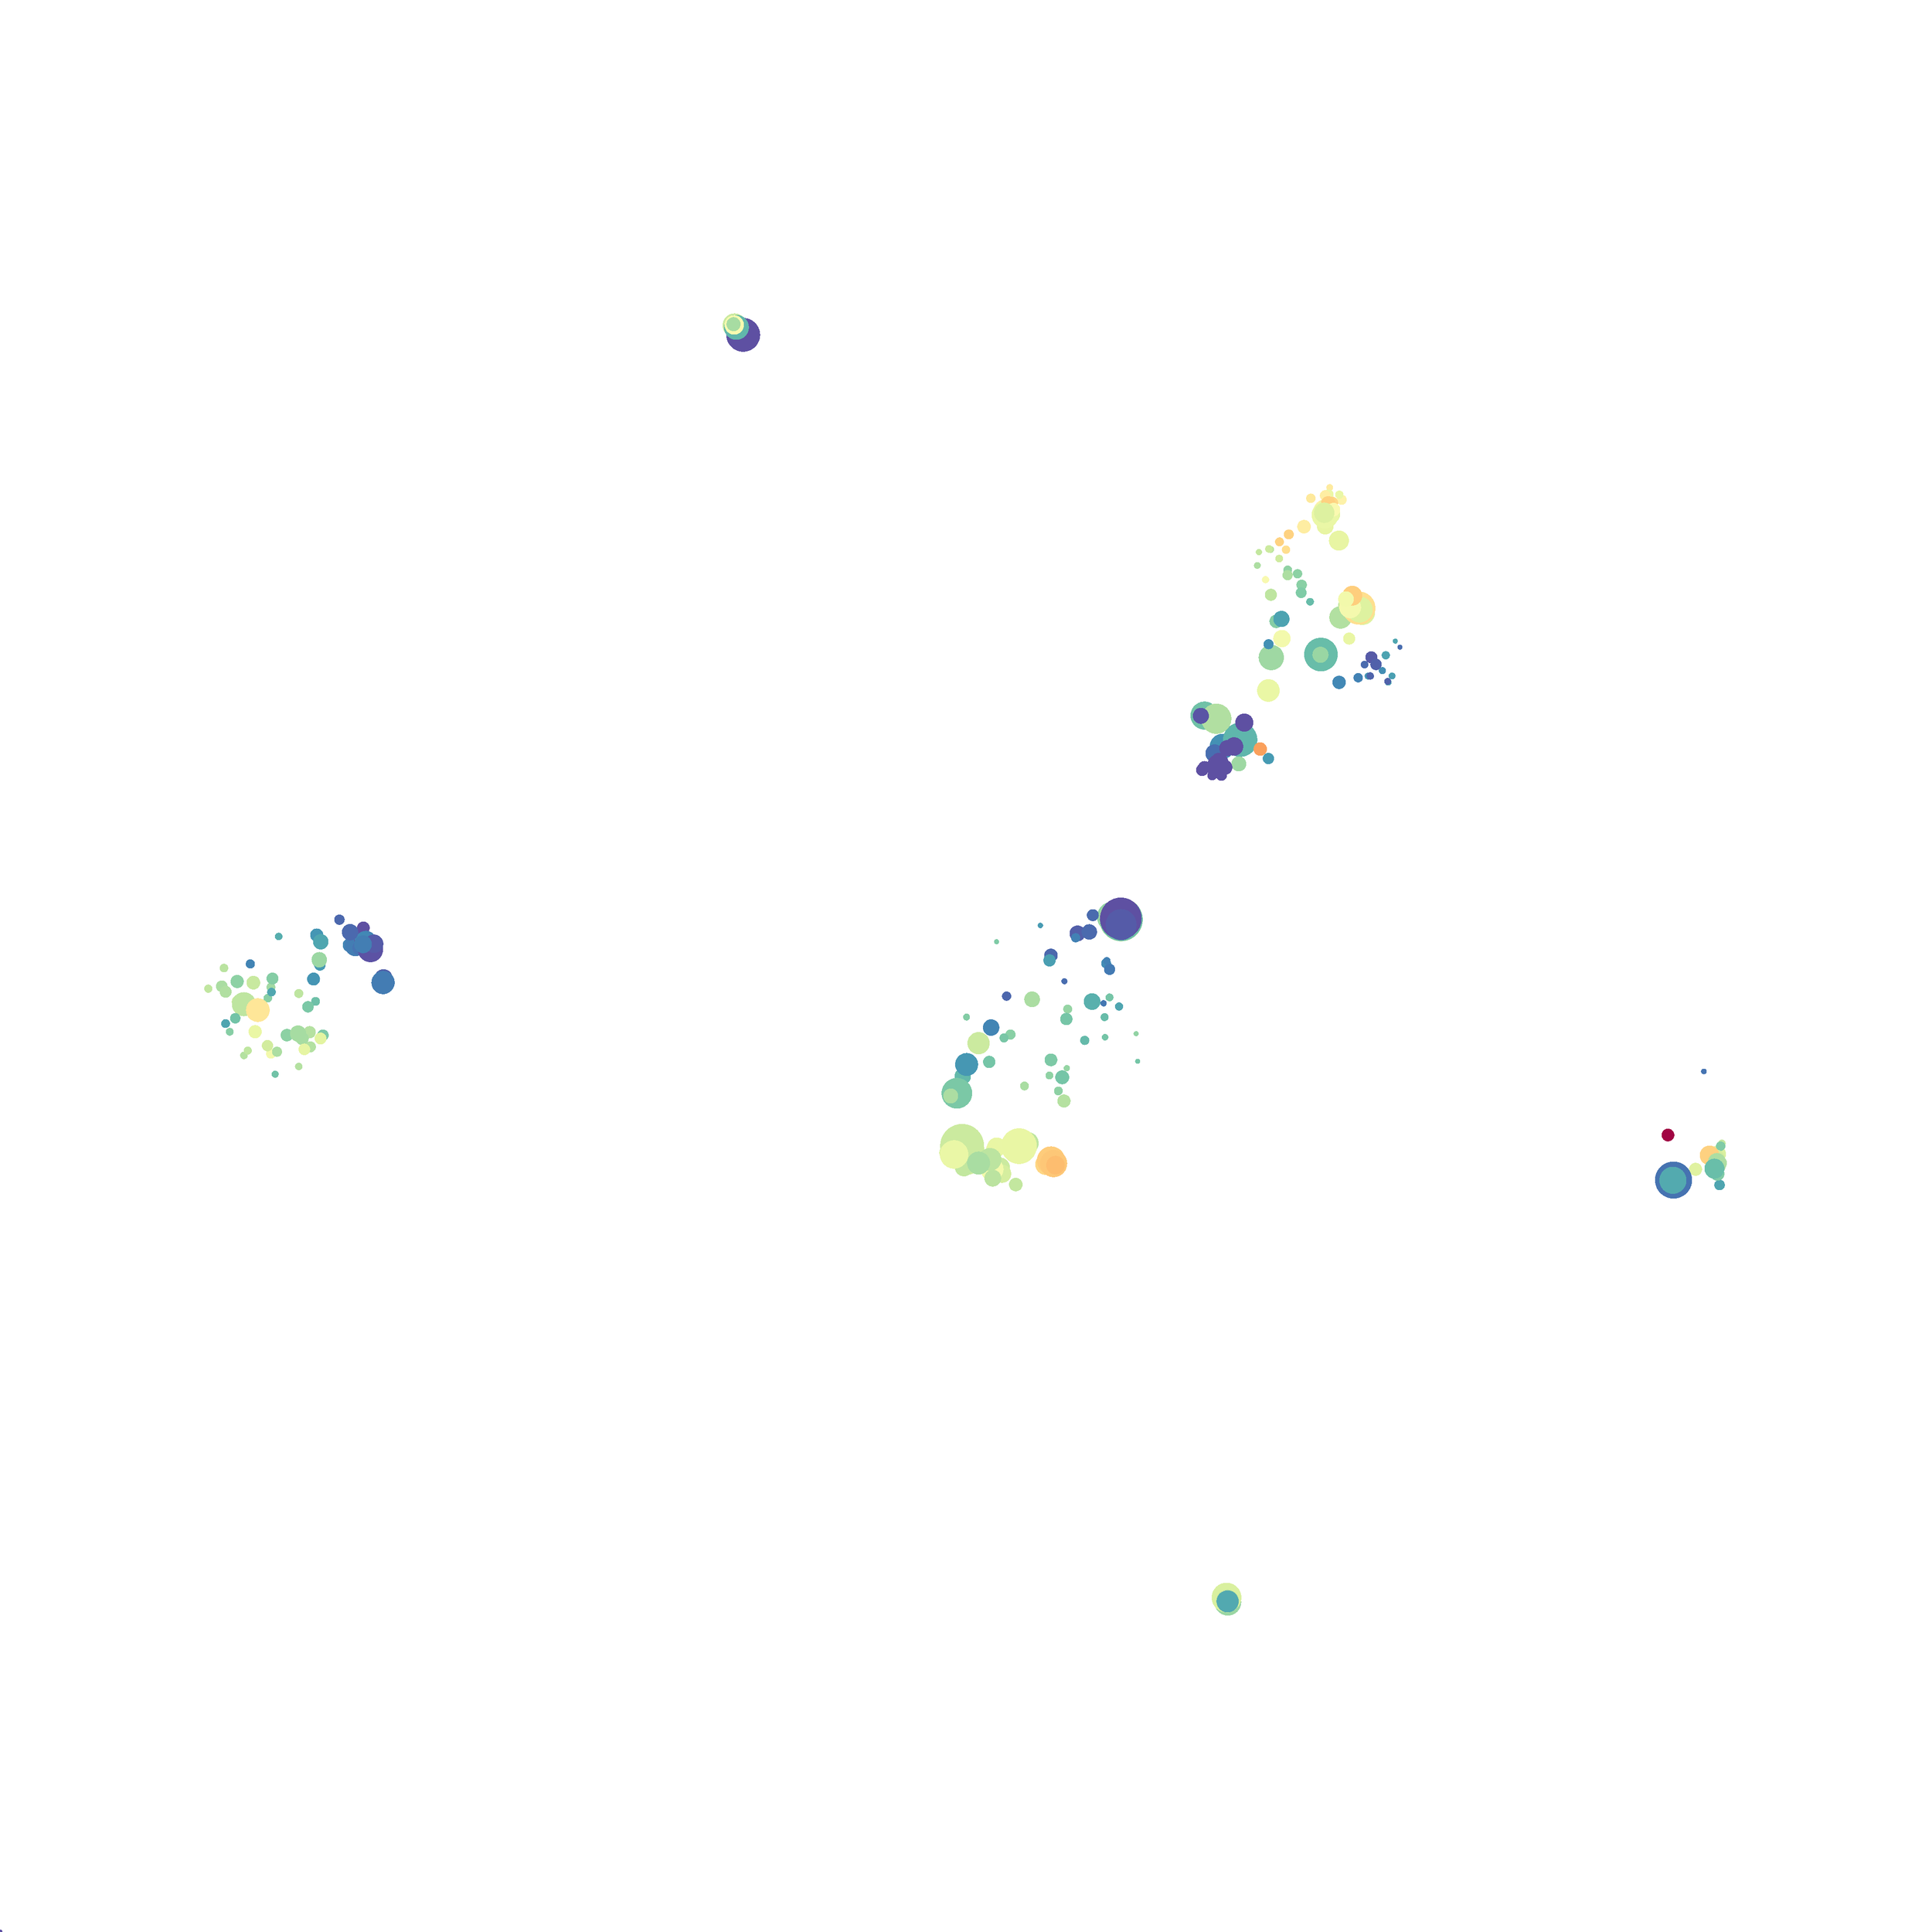
When it was done computing I played around with the coloration. Cytosplore has a ton of different color palettes:
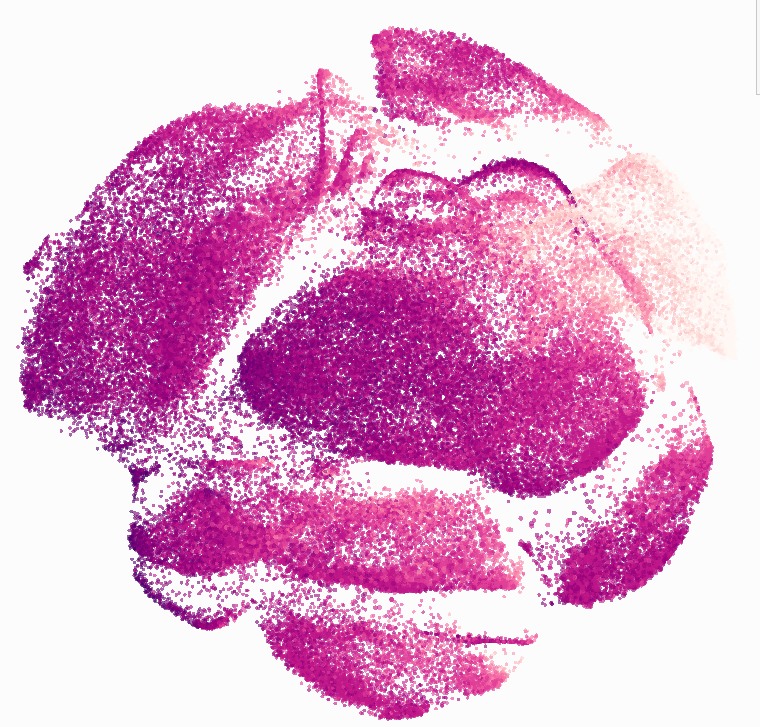
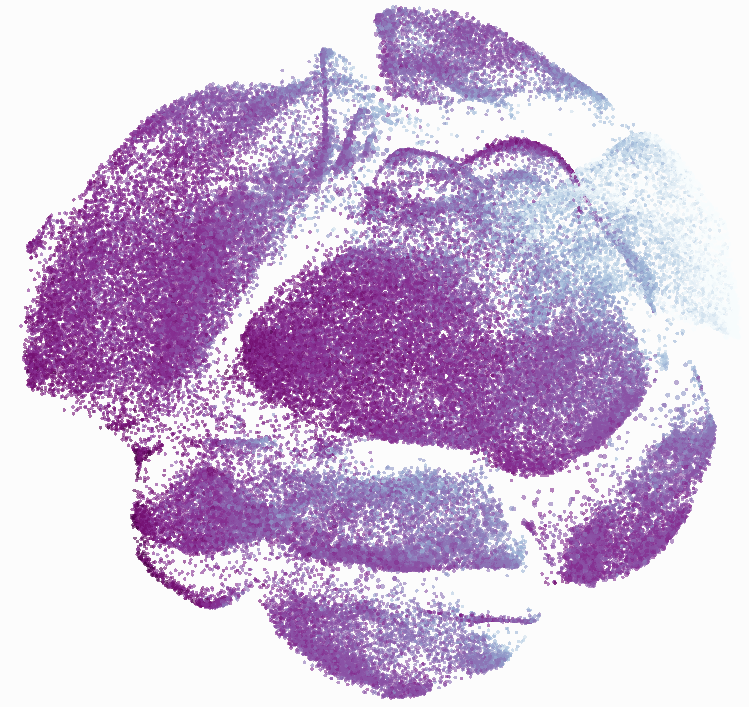
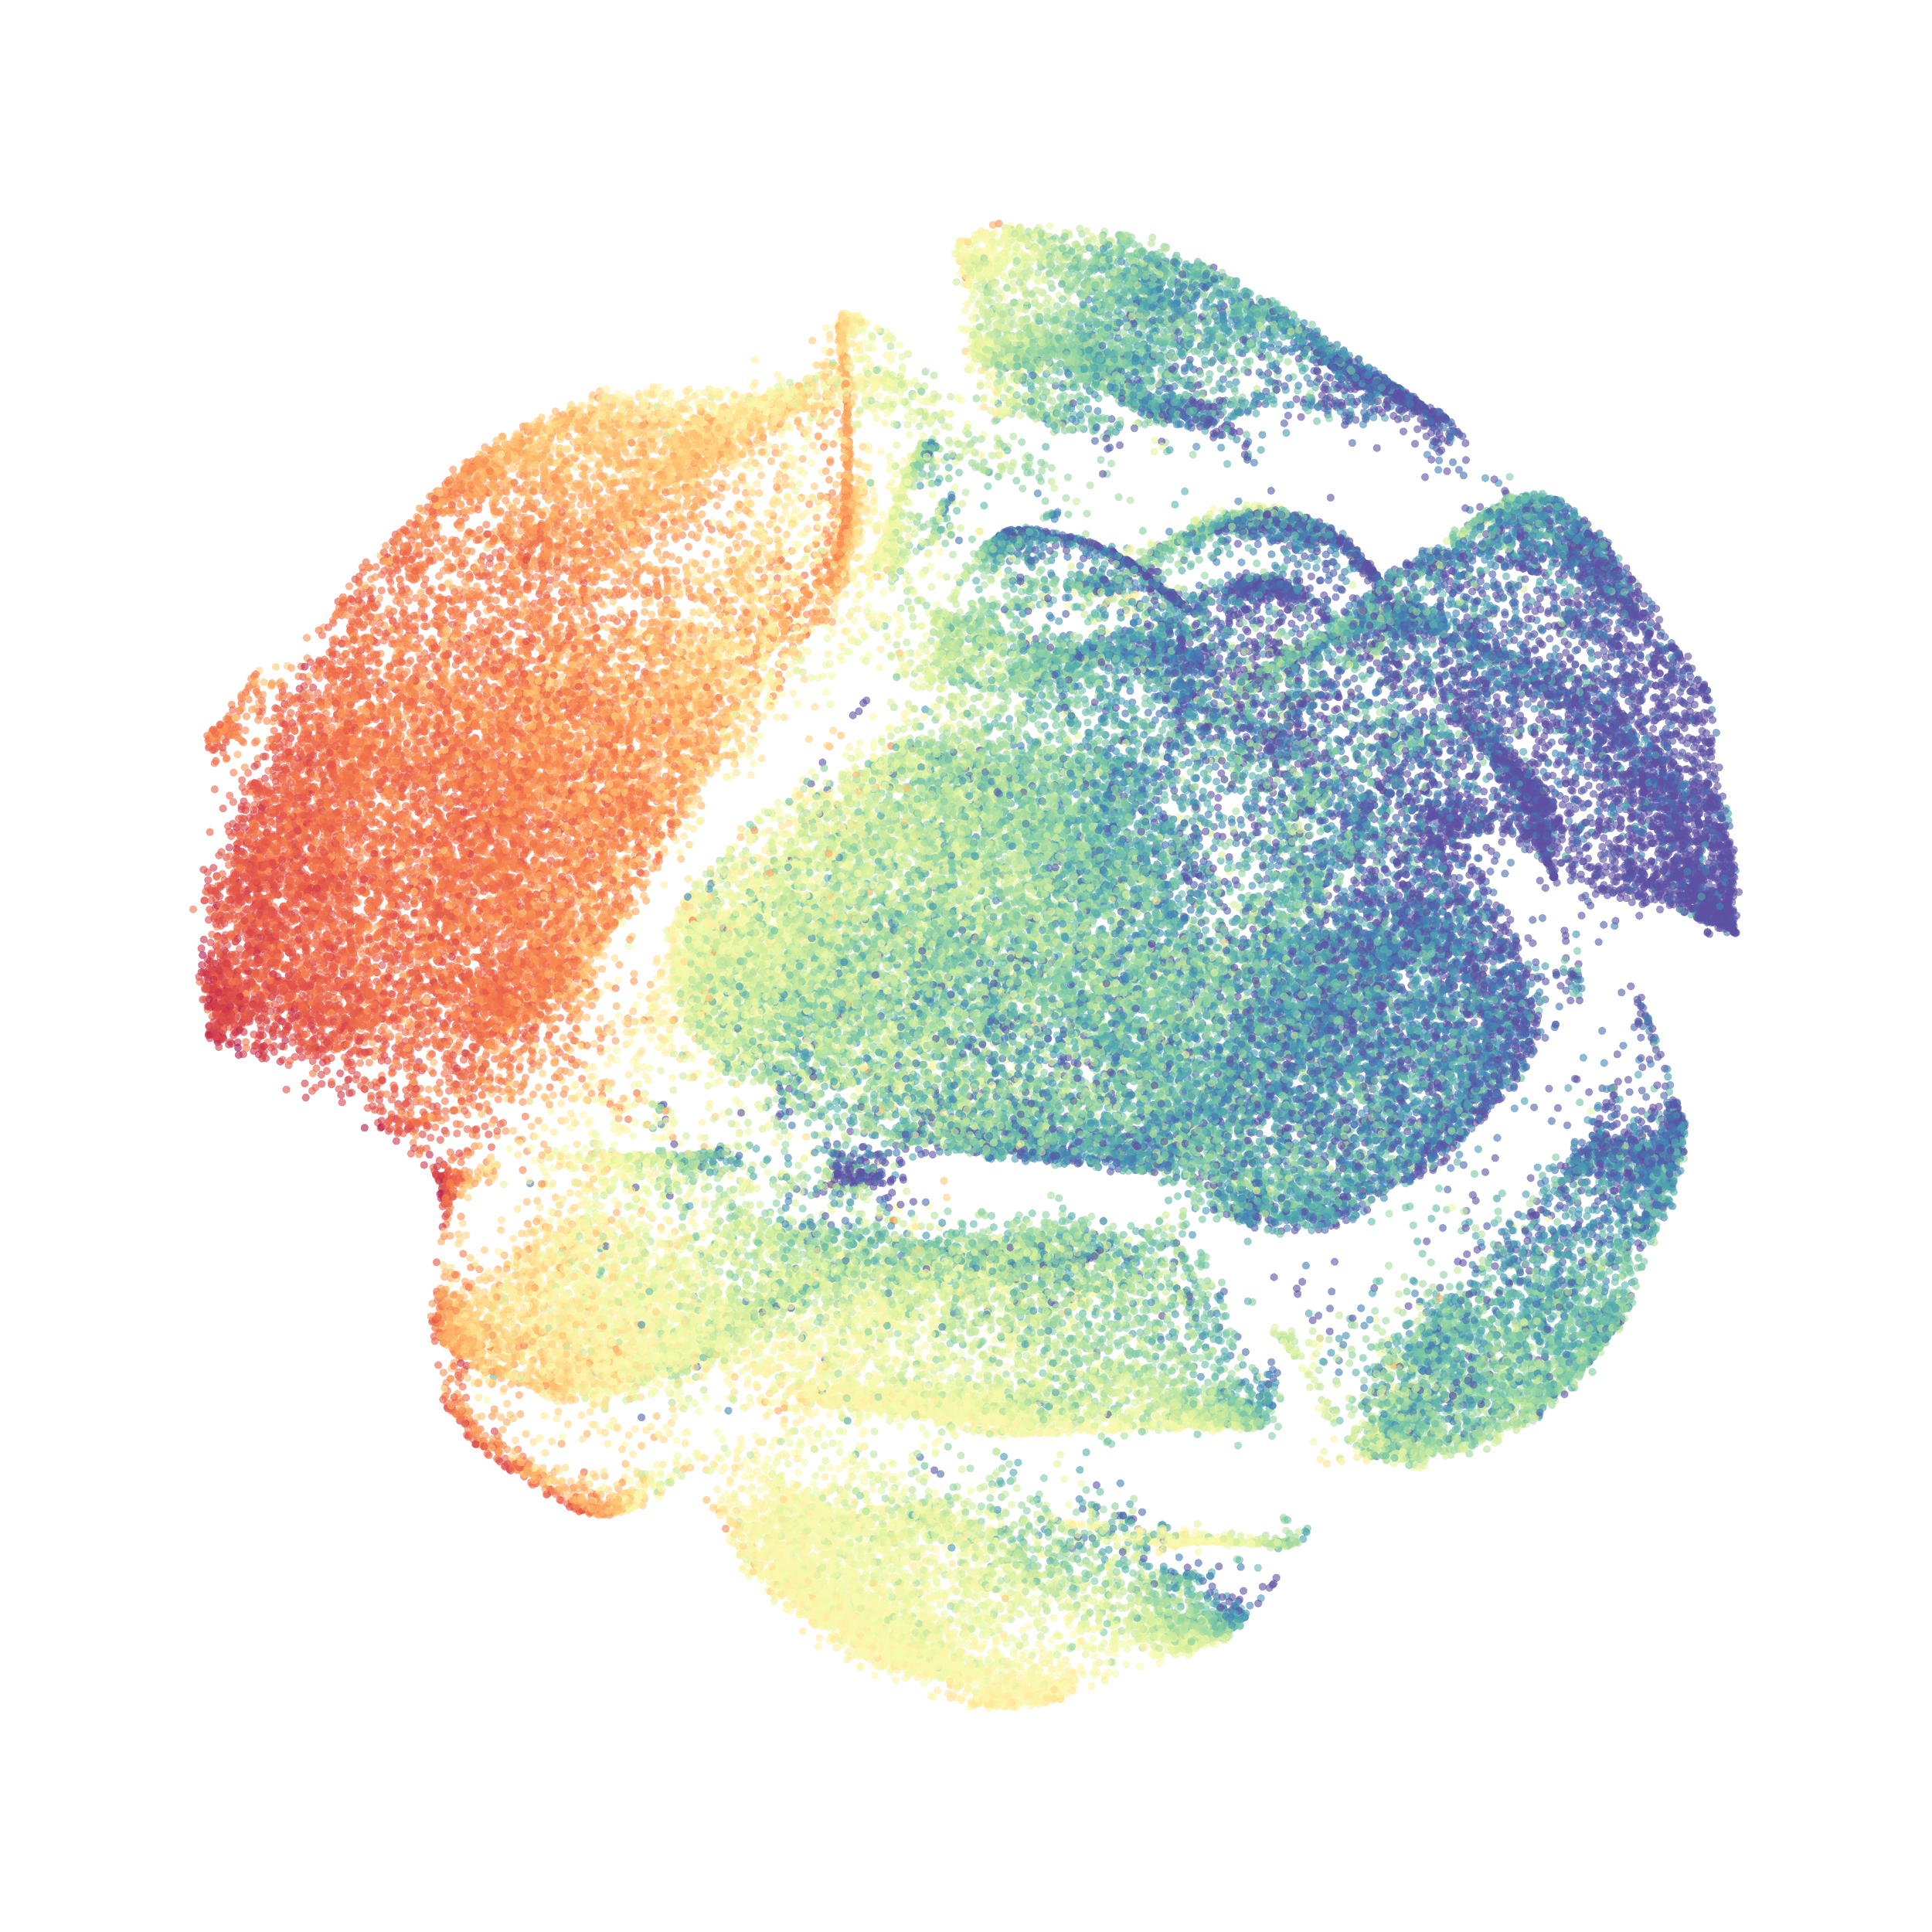
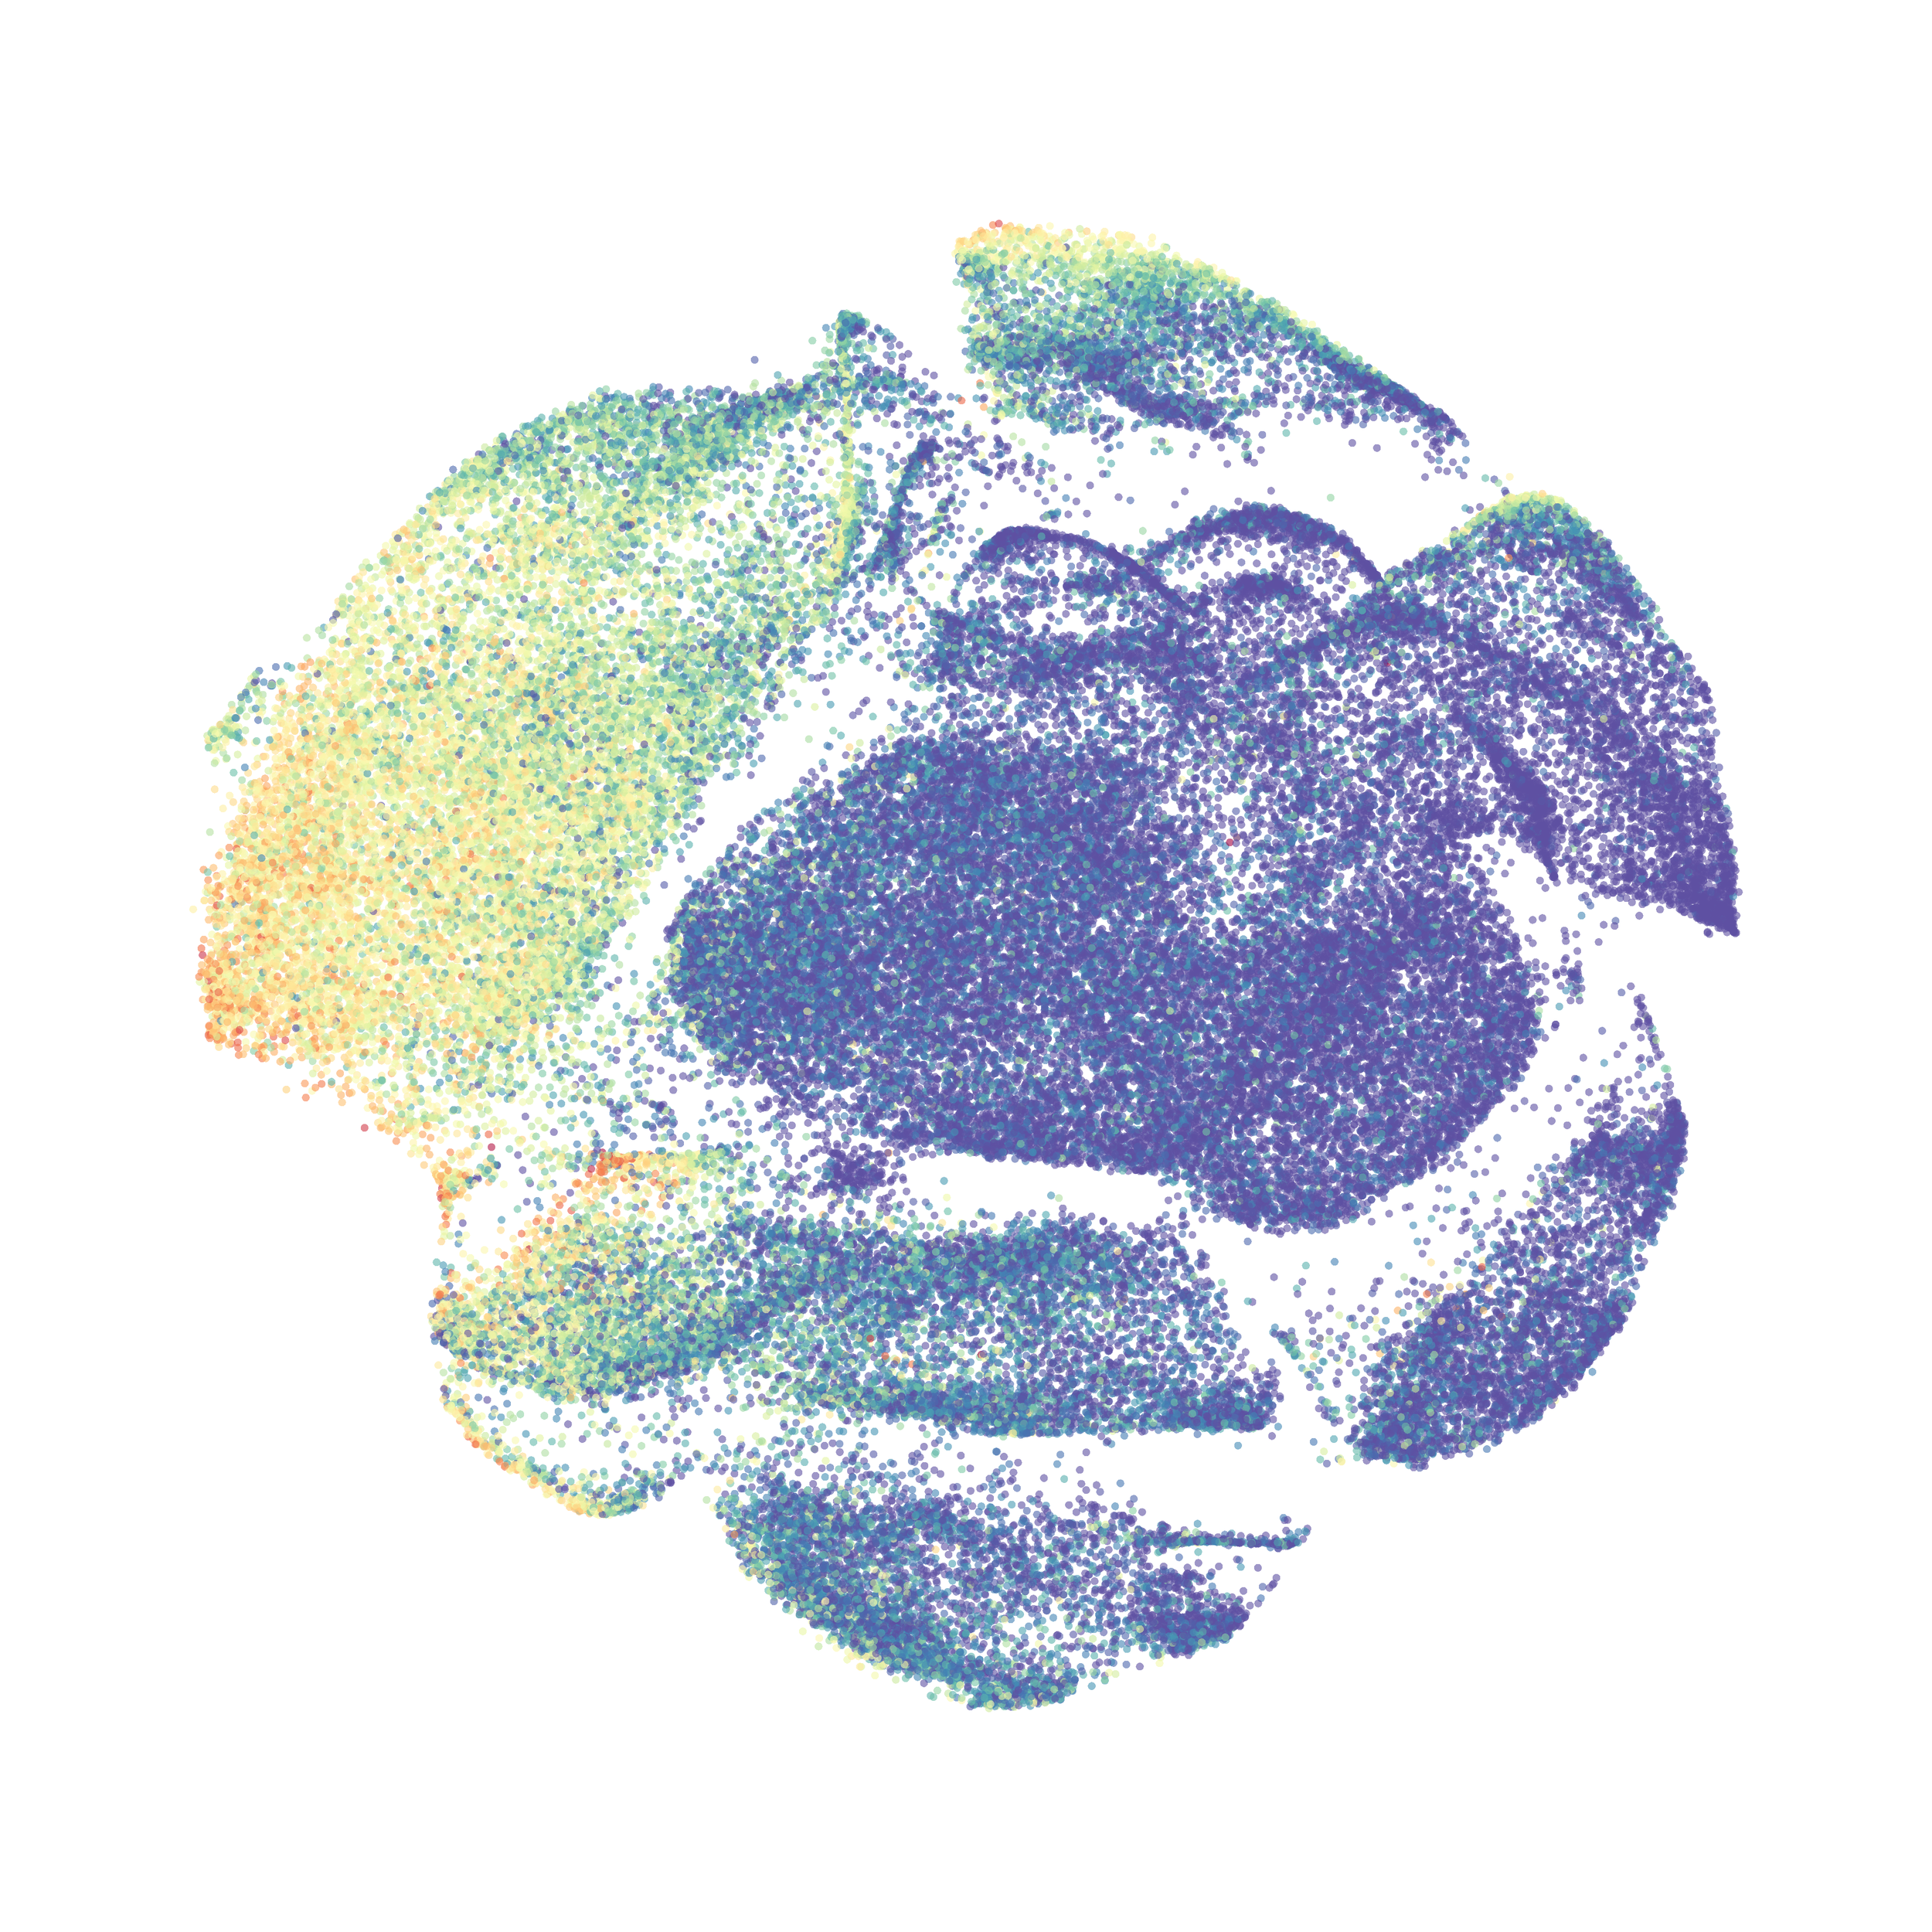
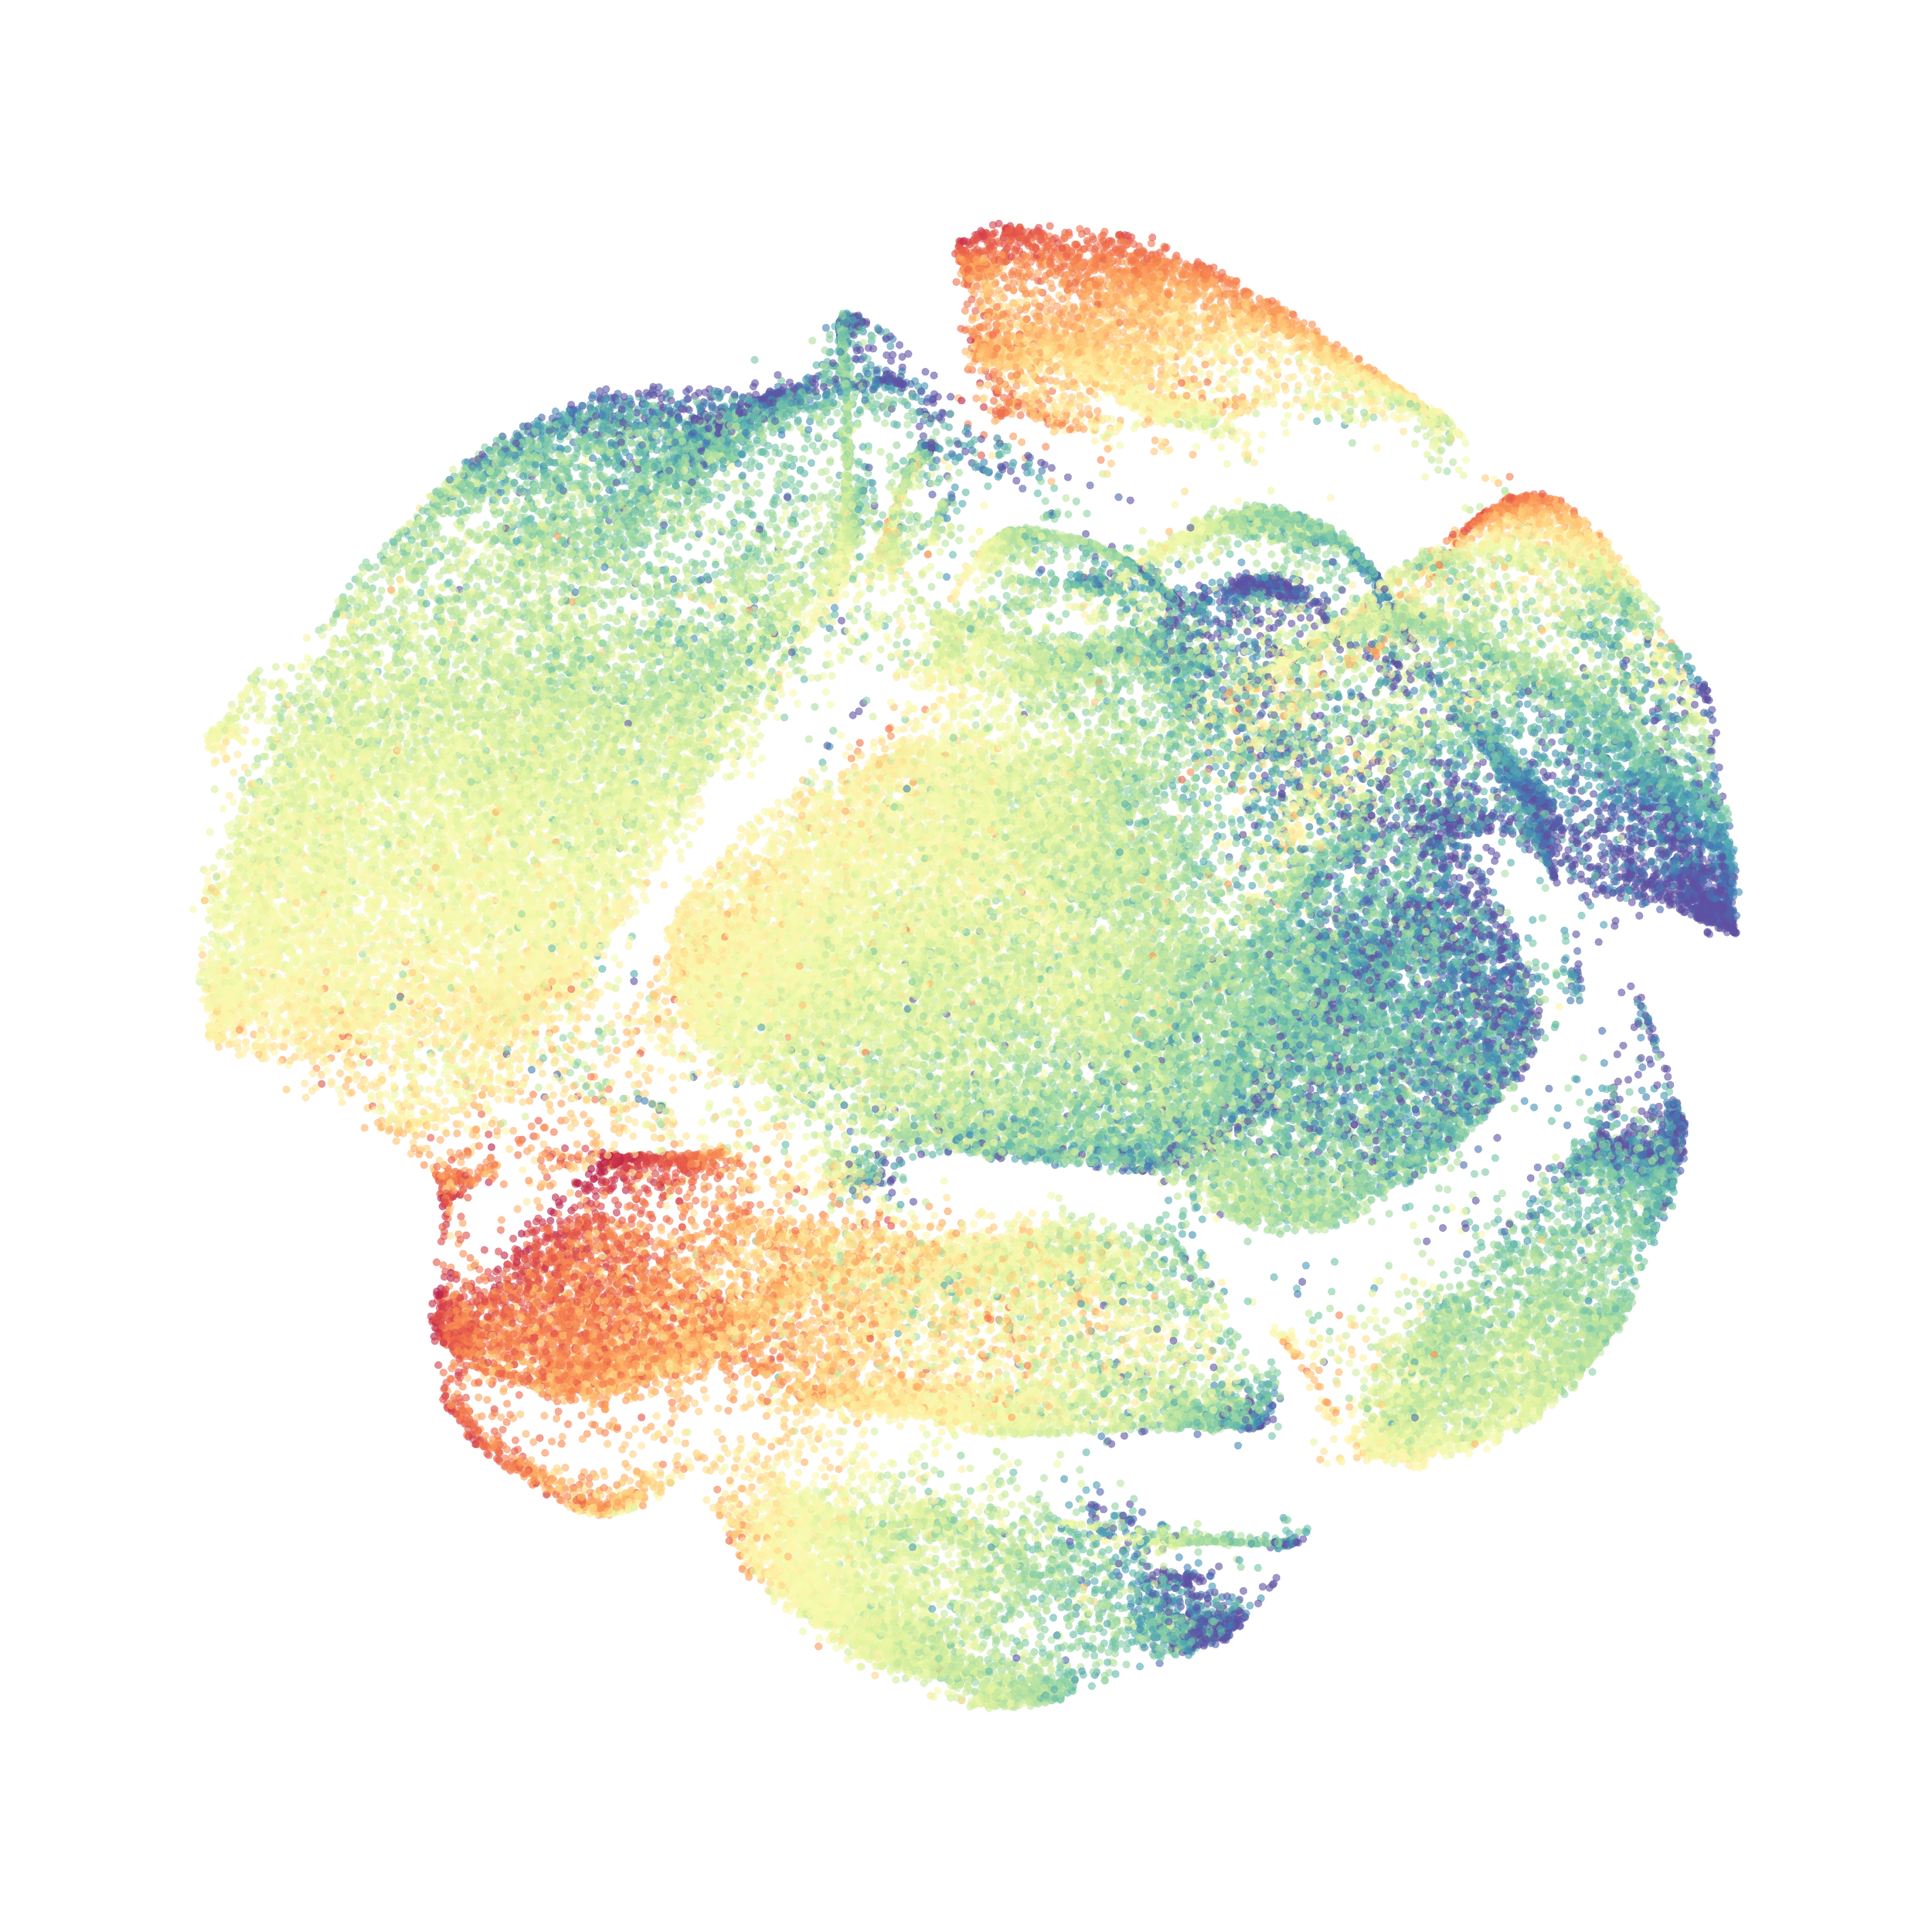
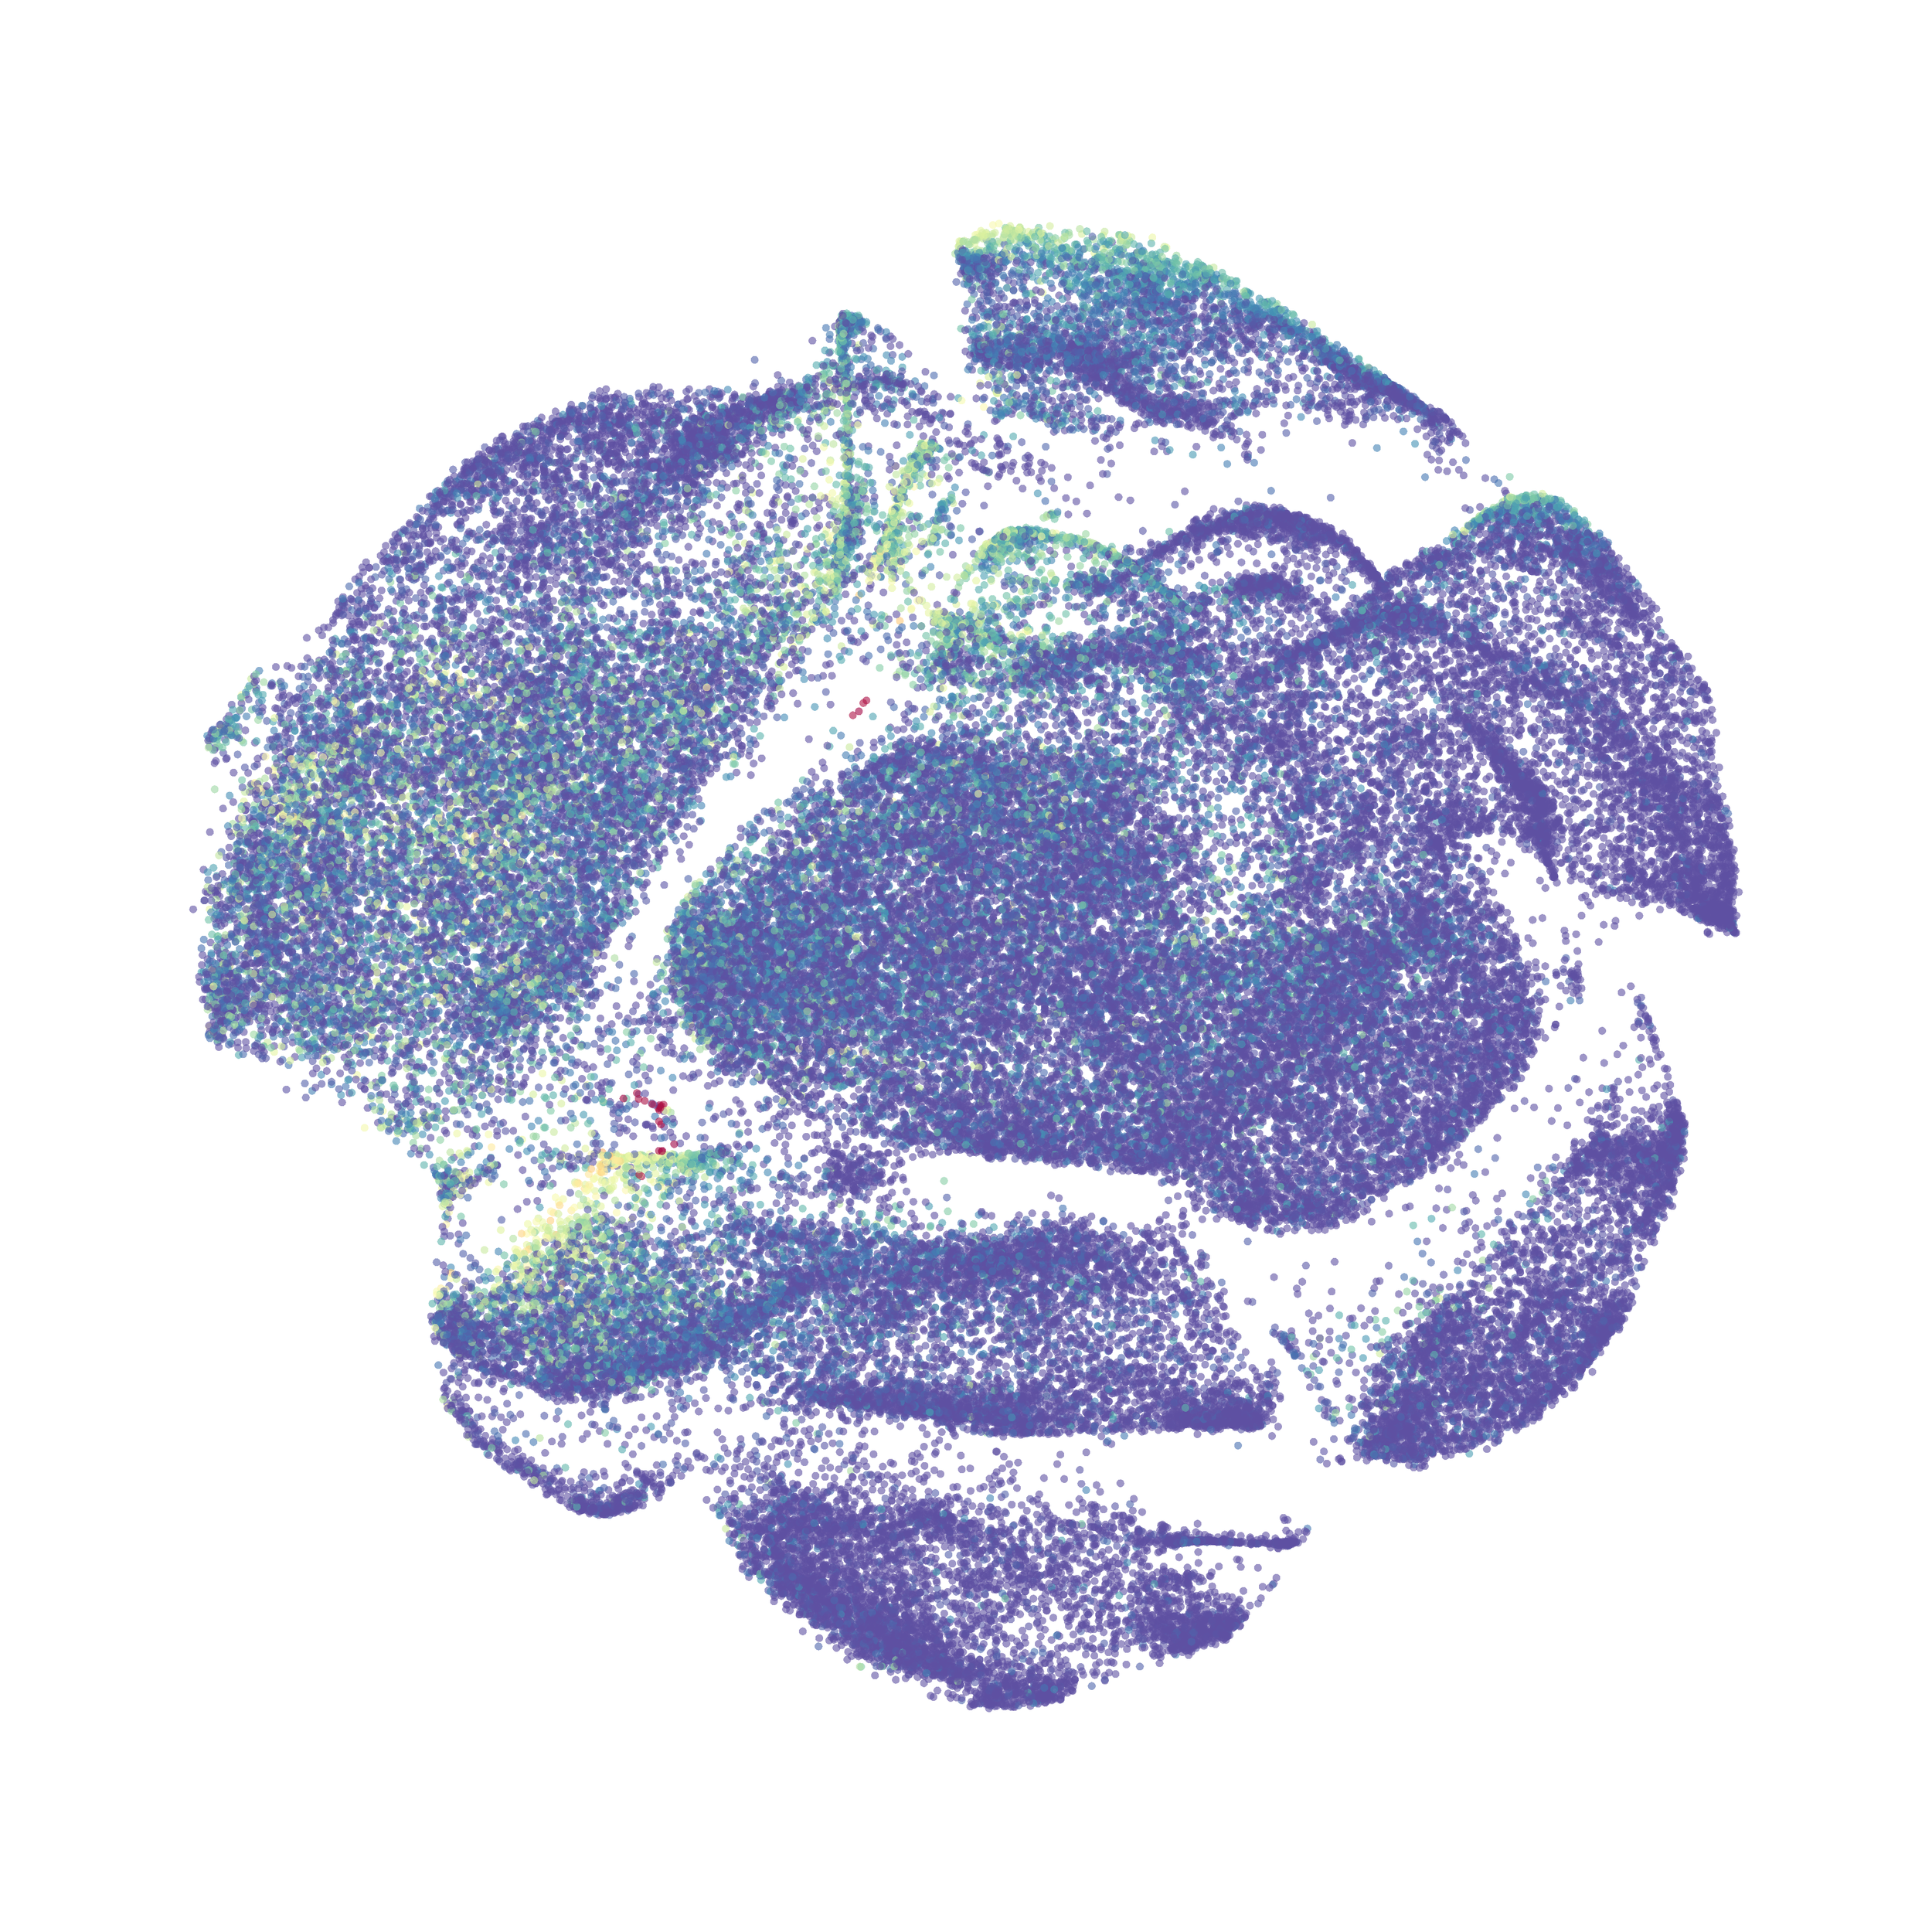
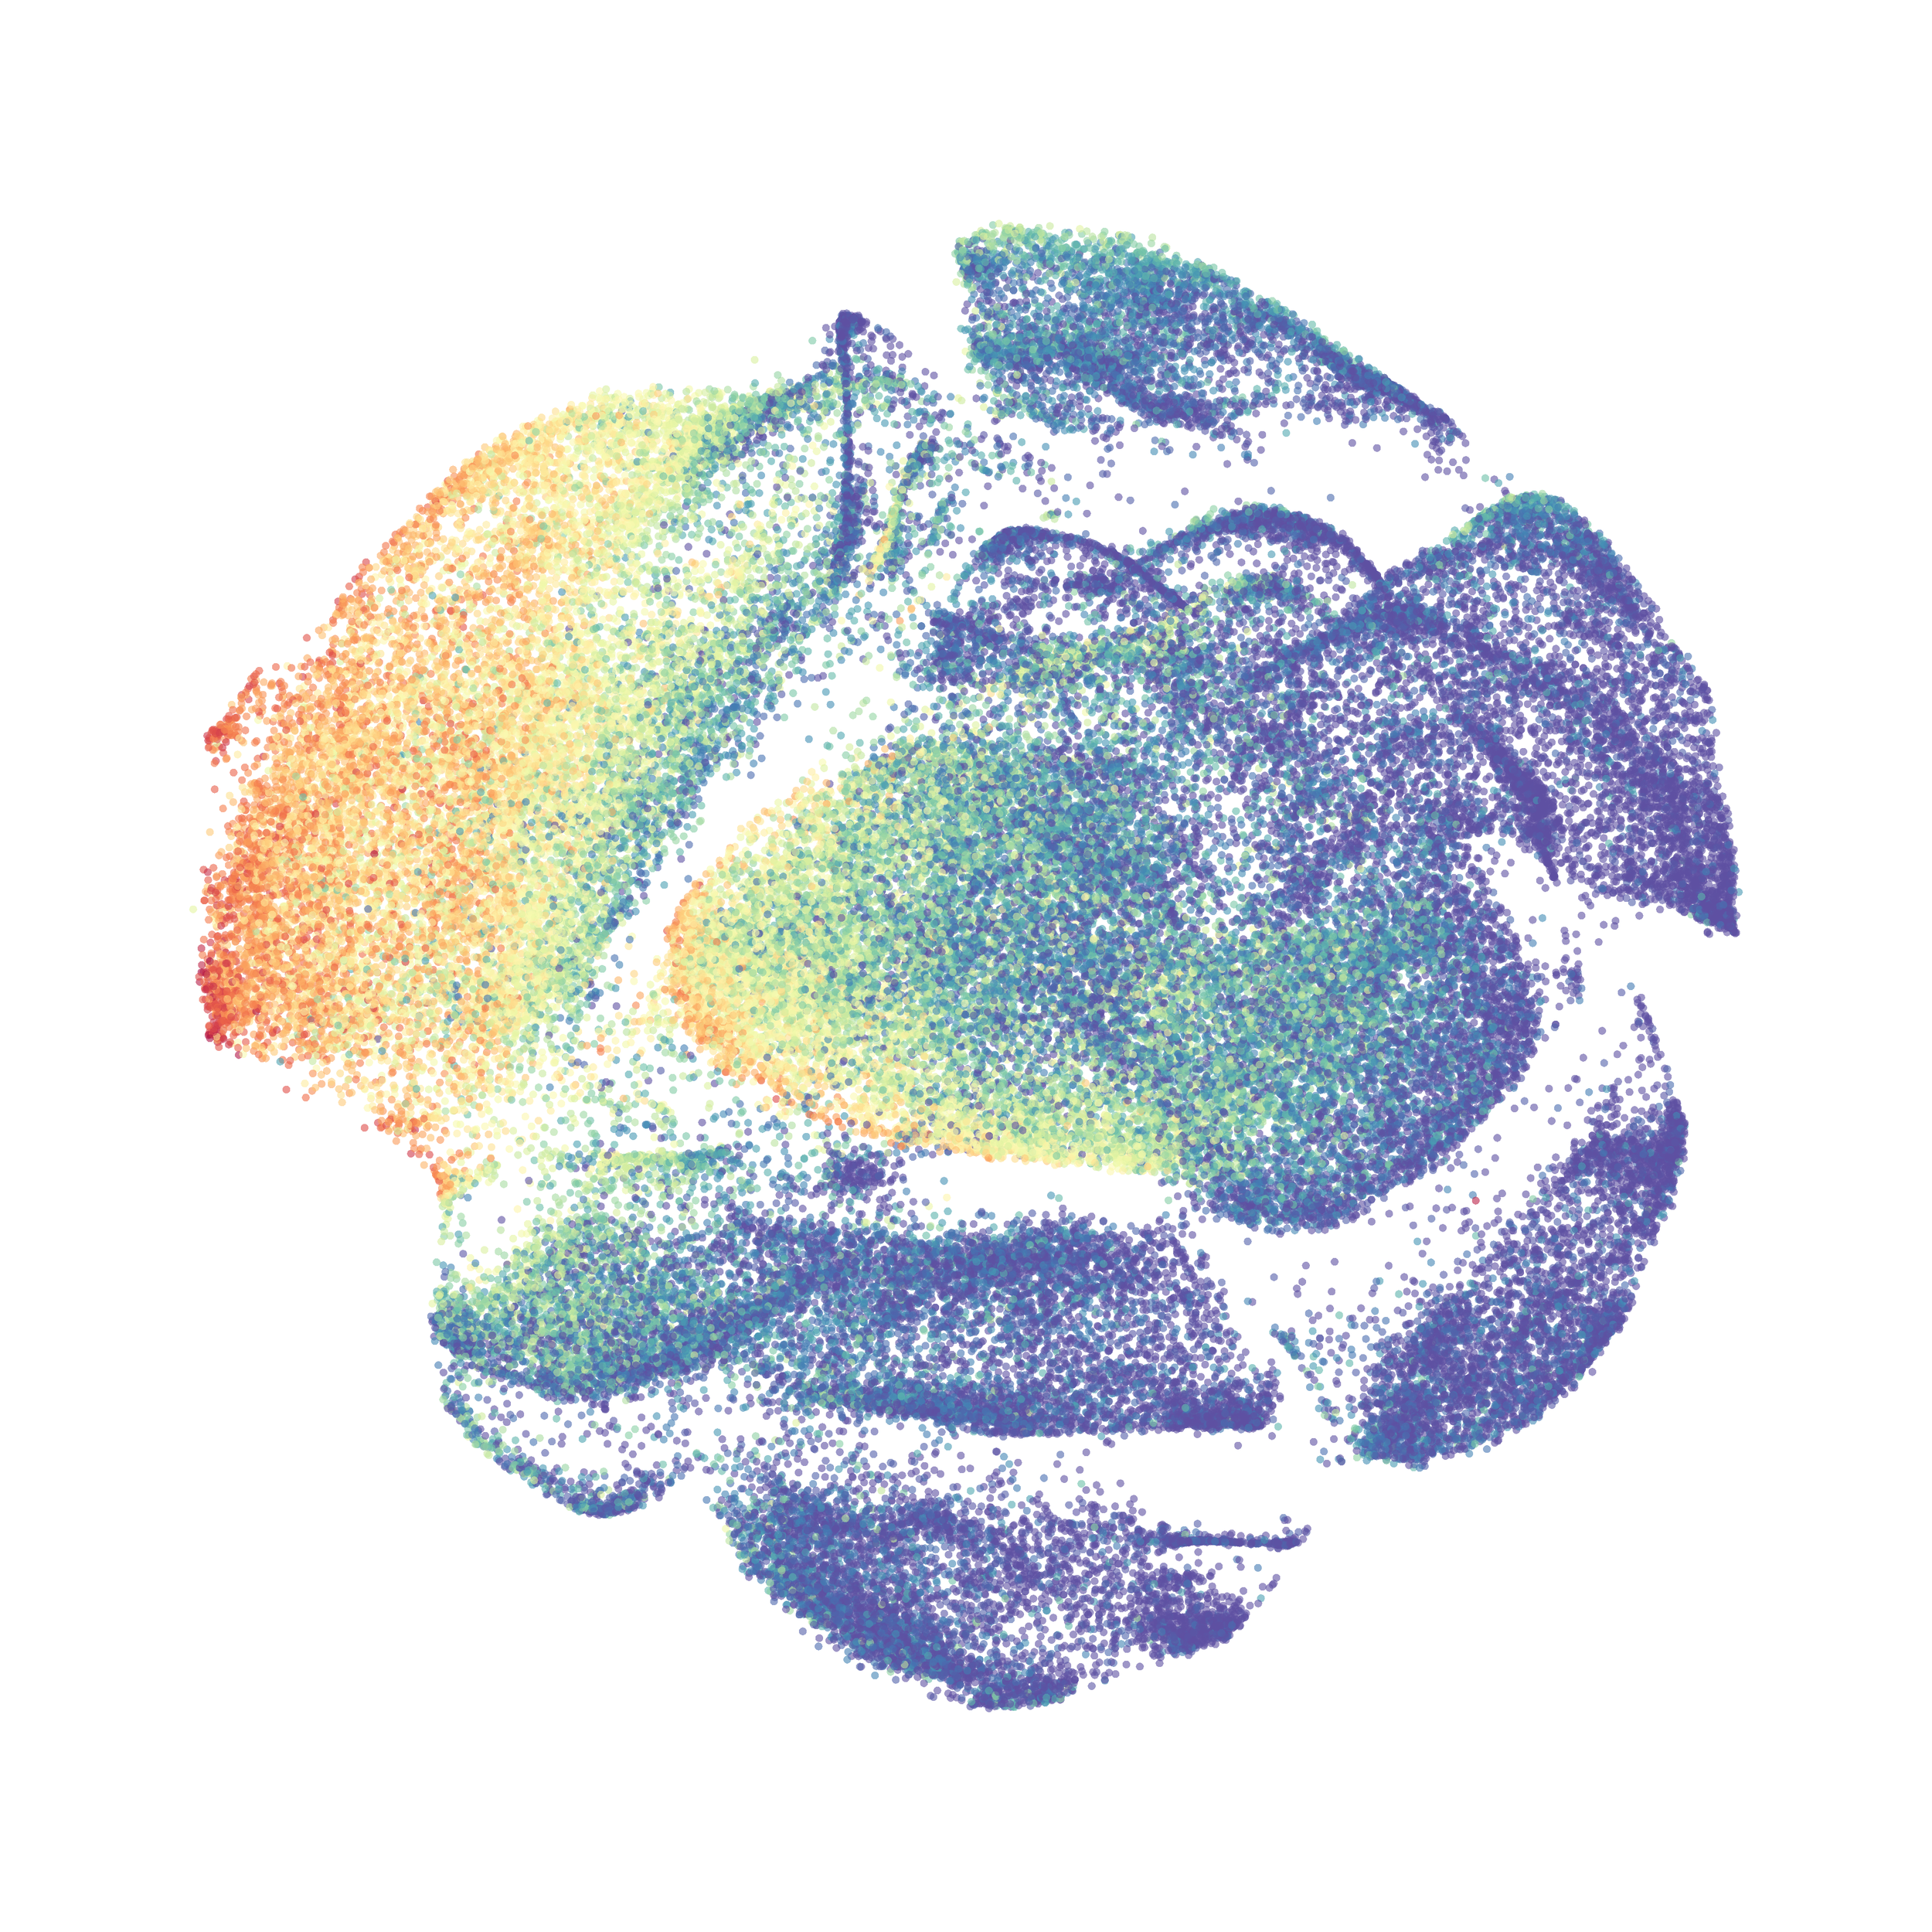
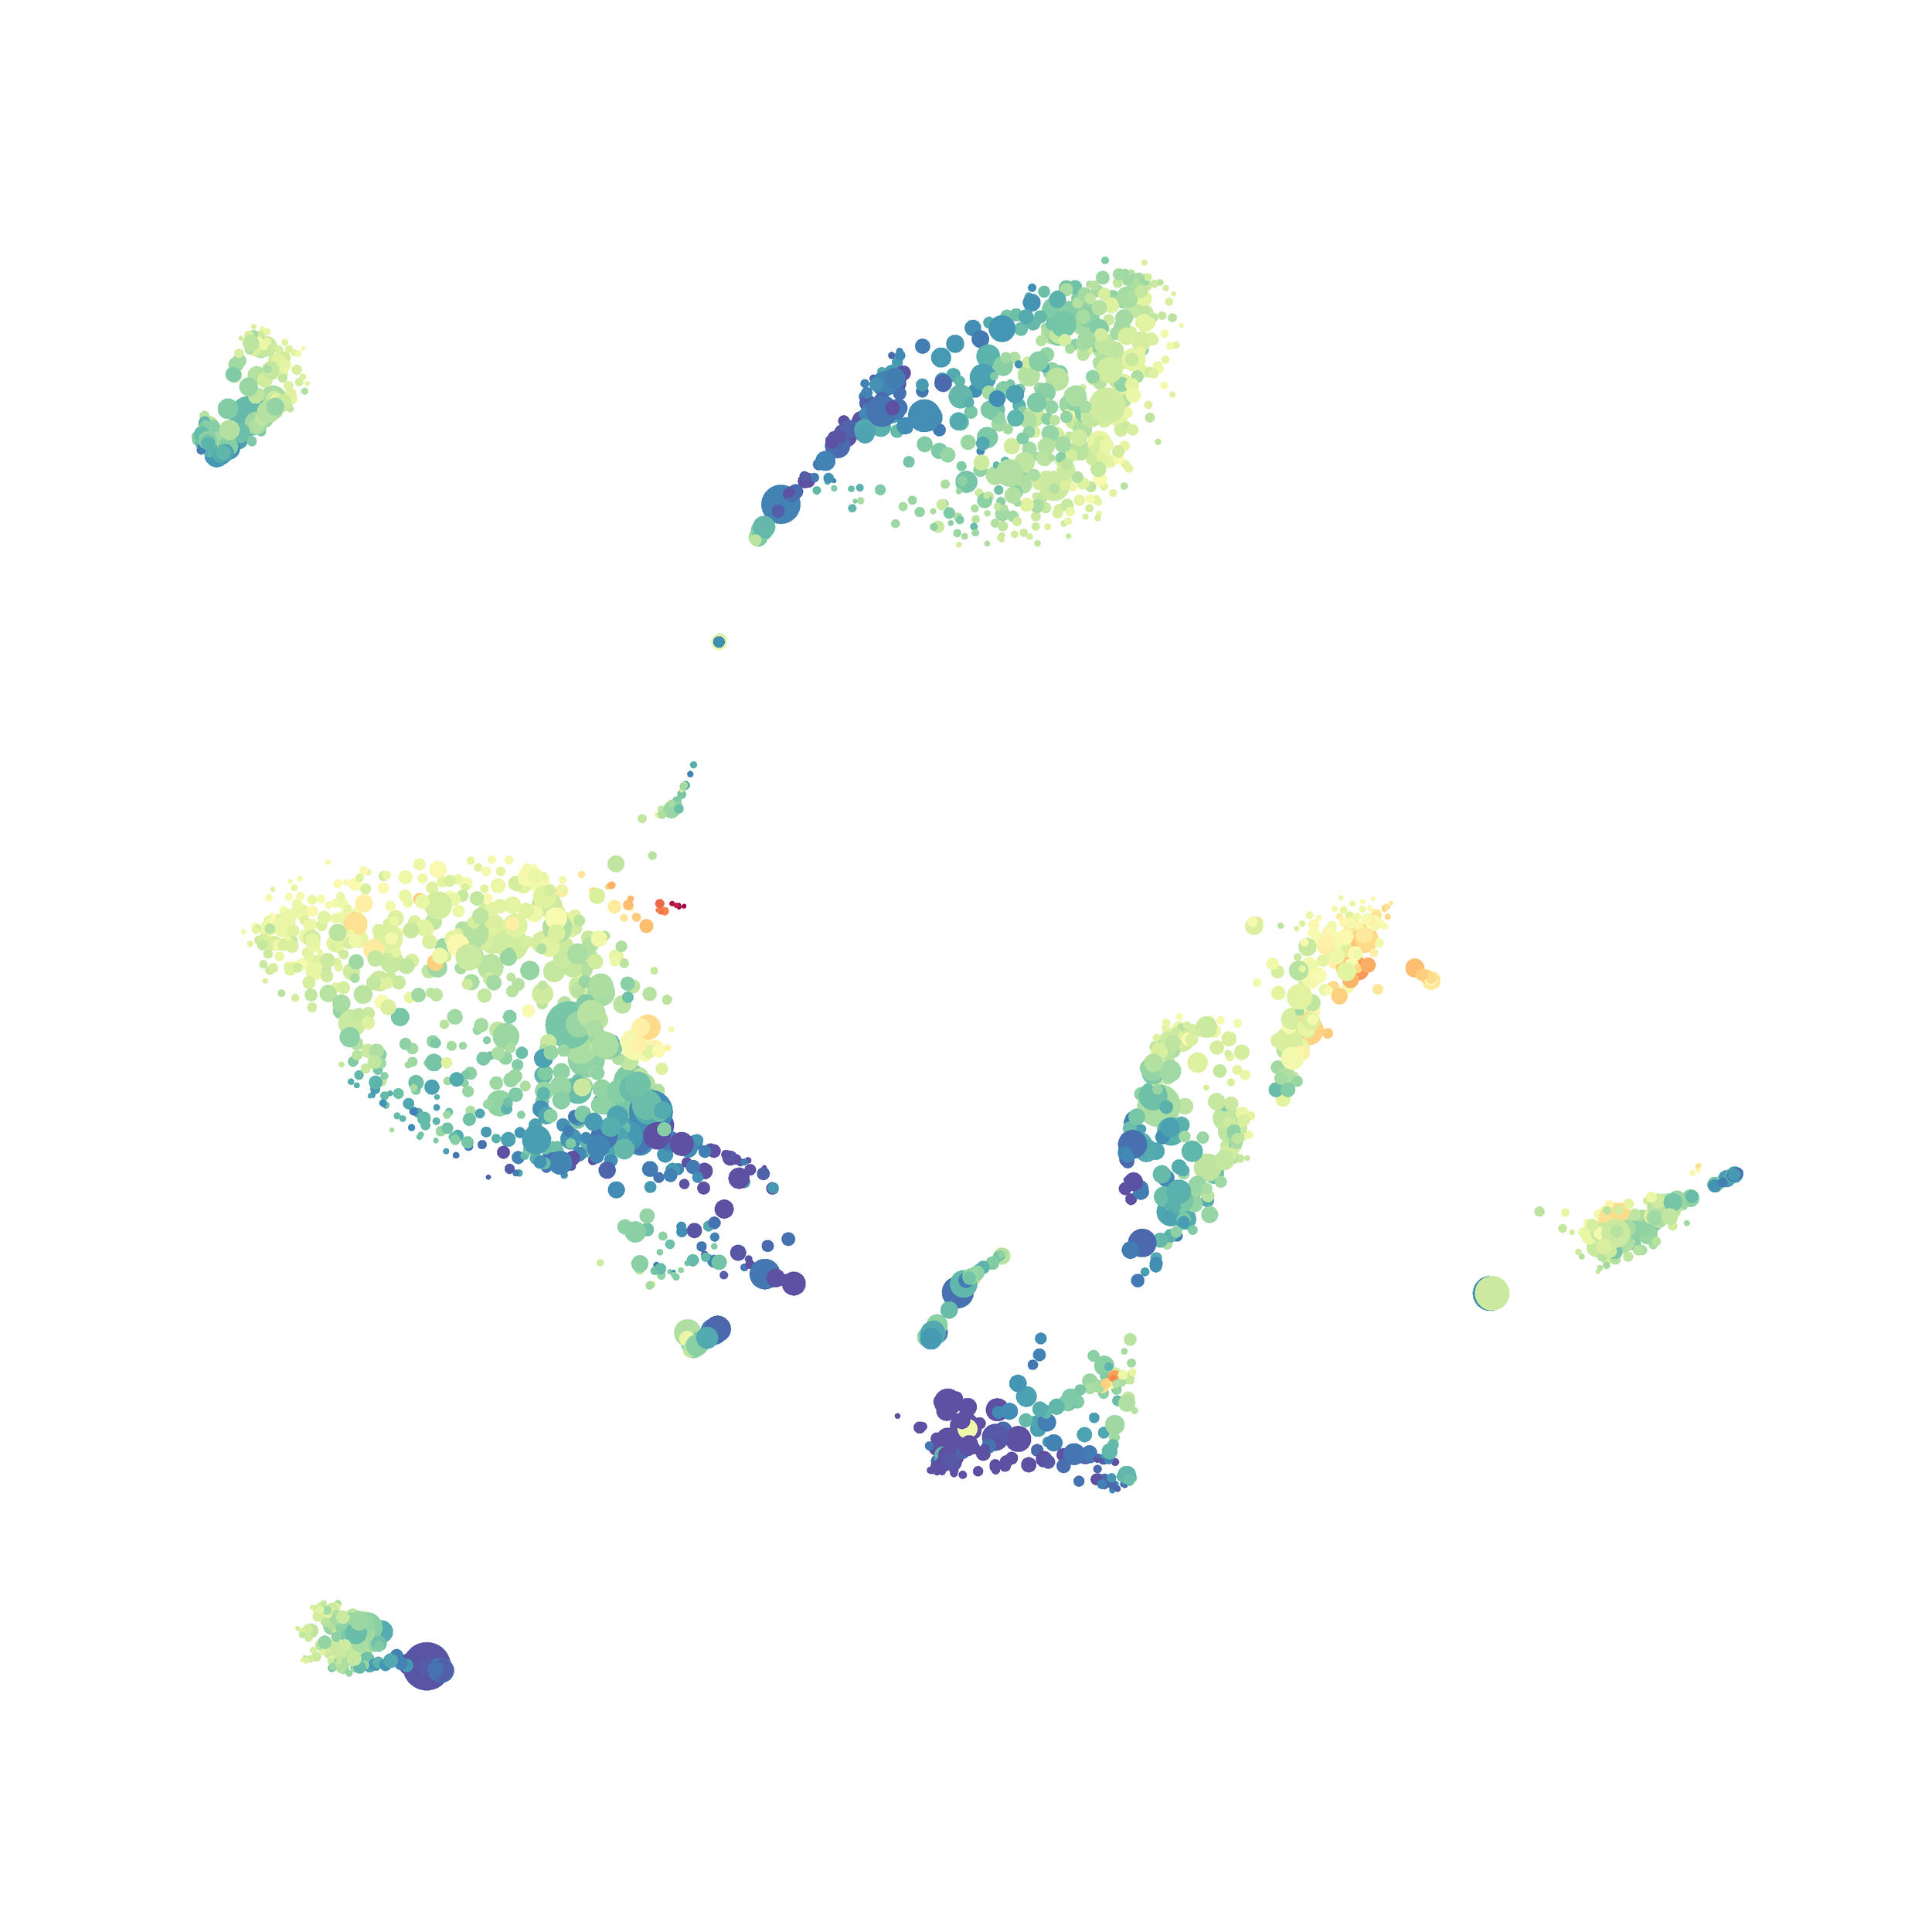
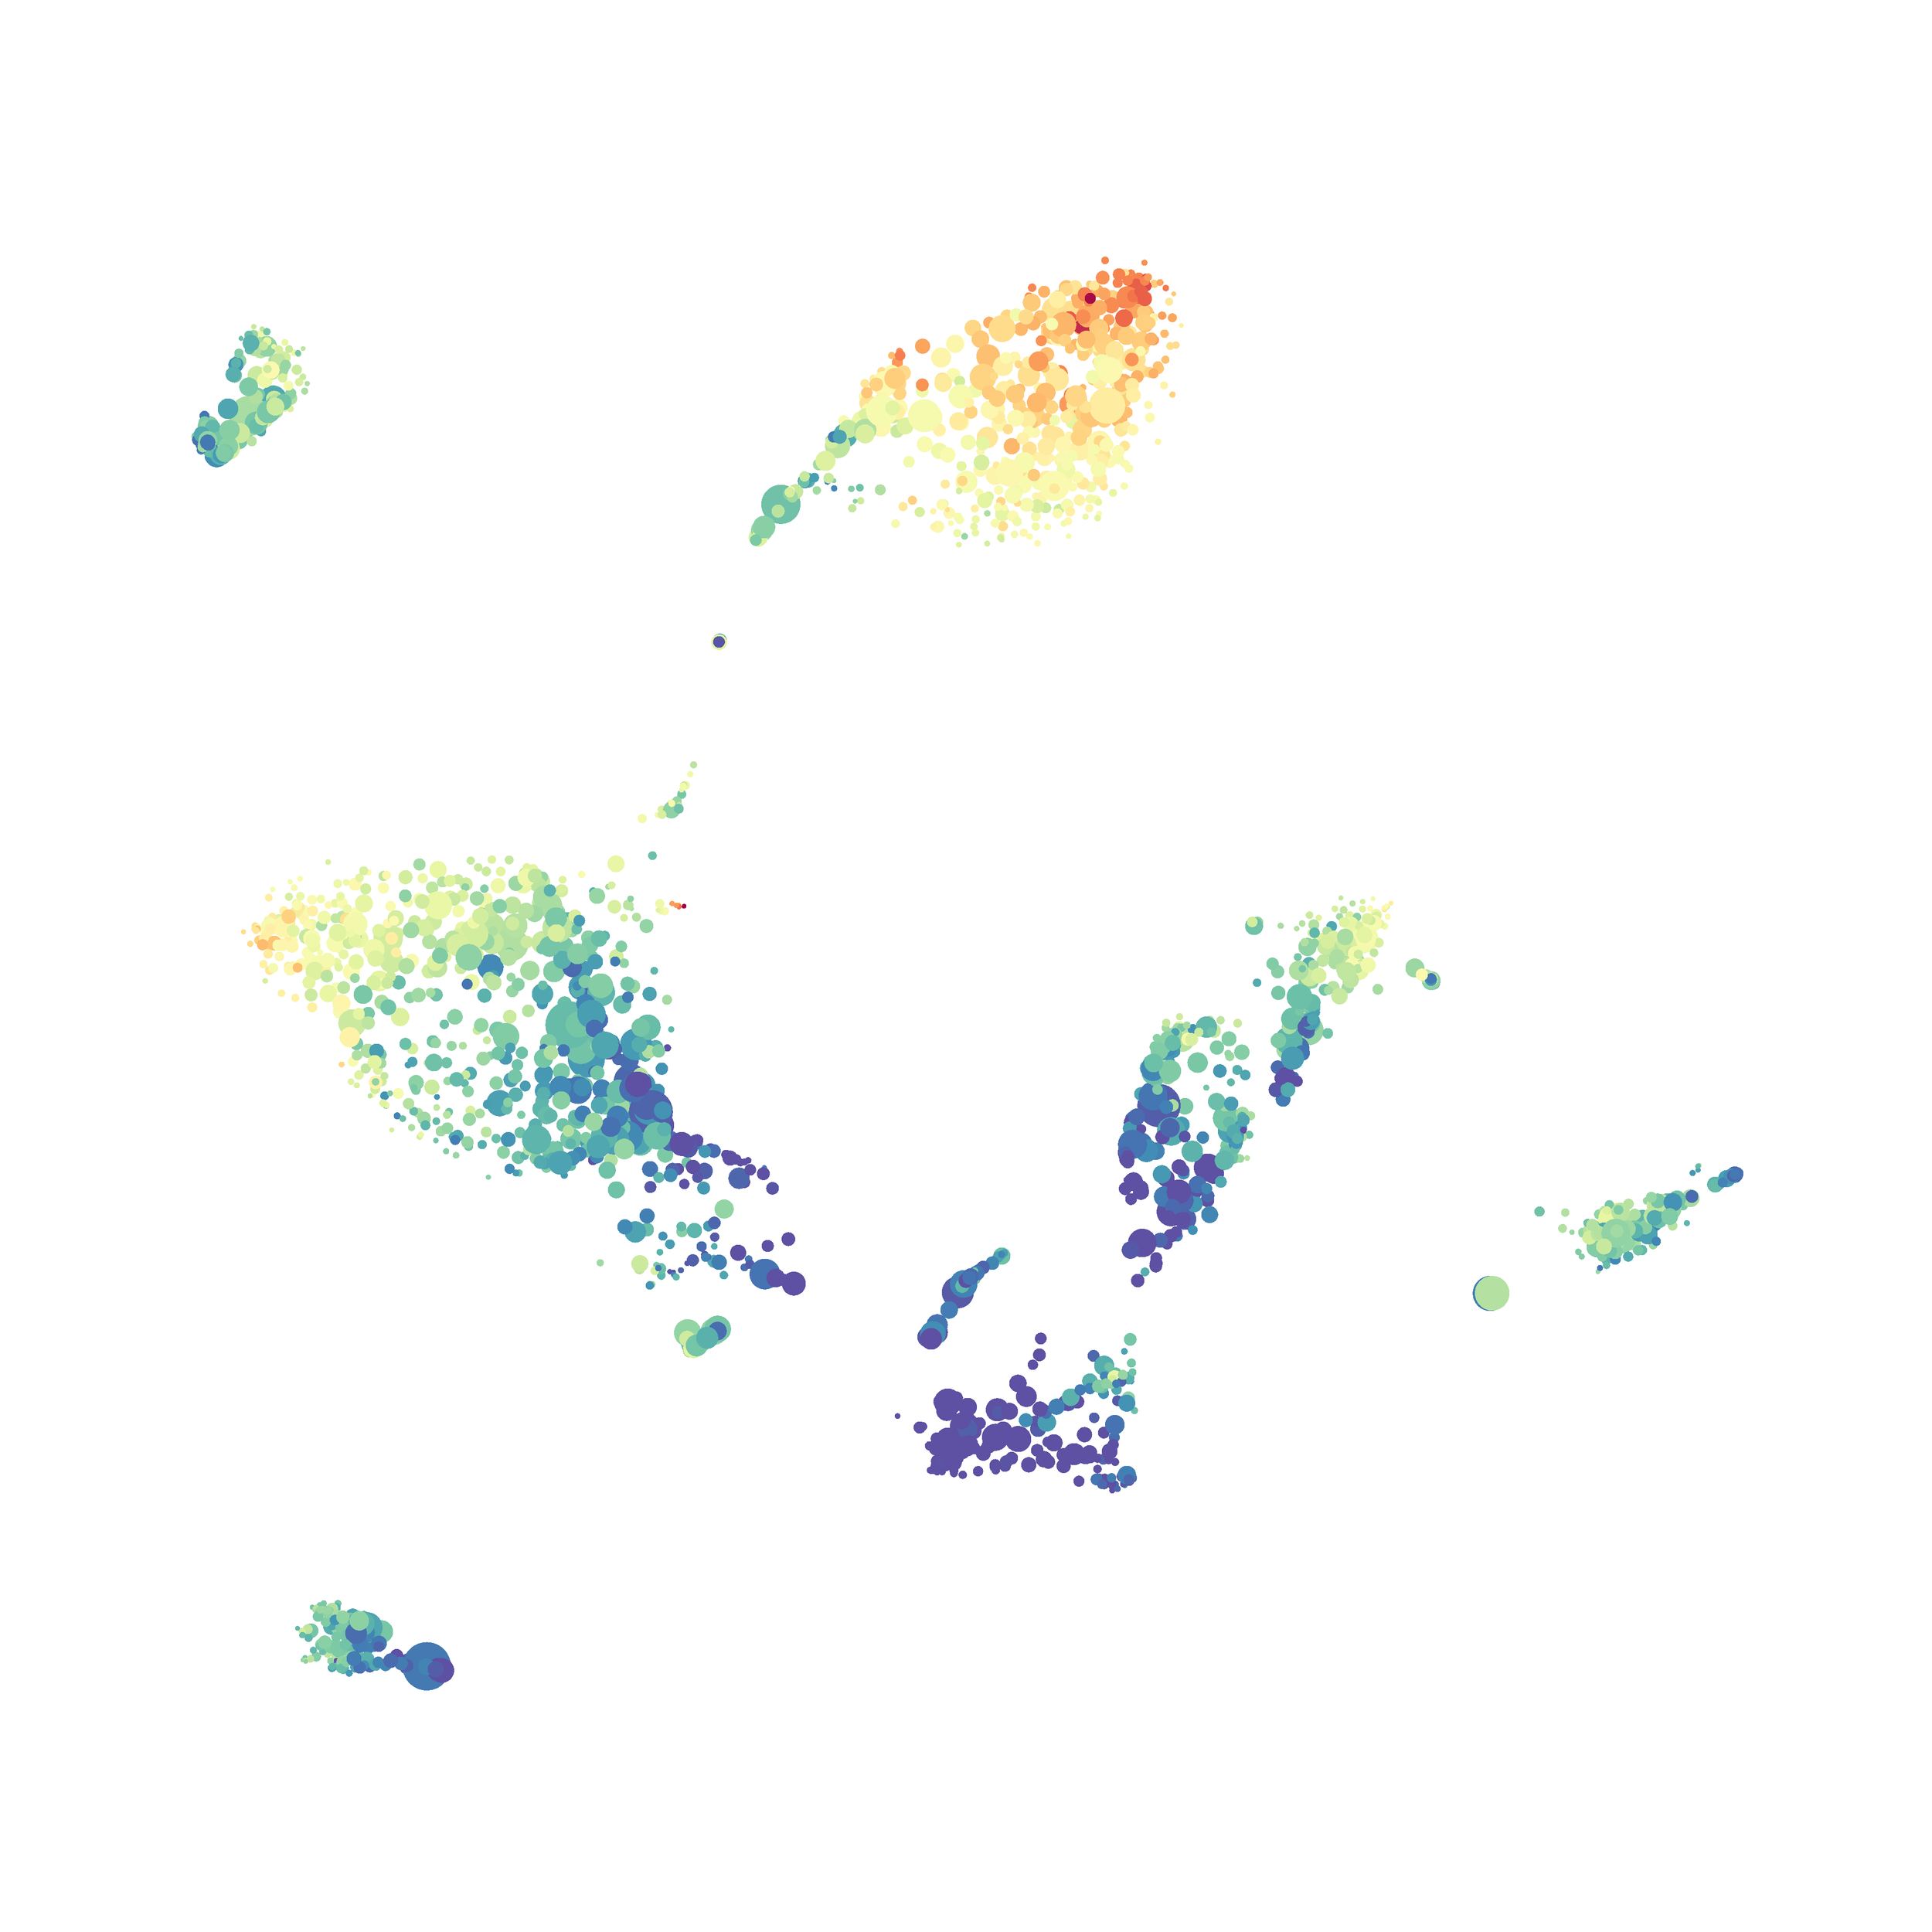
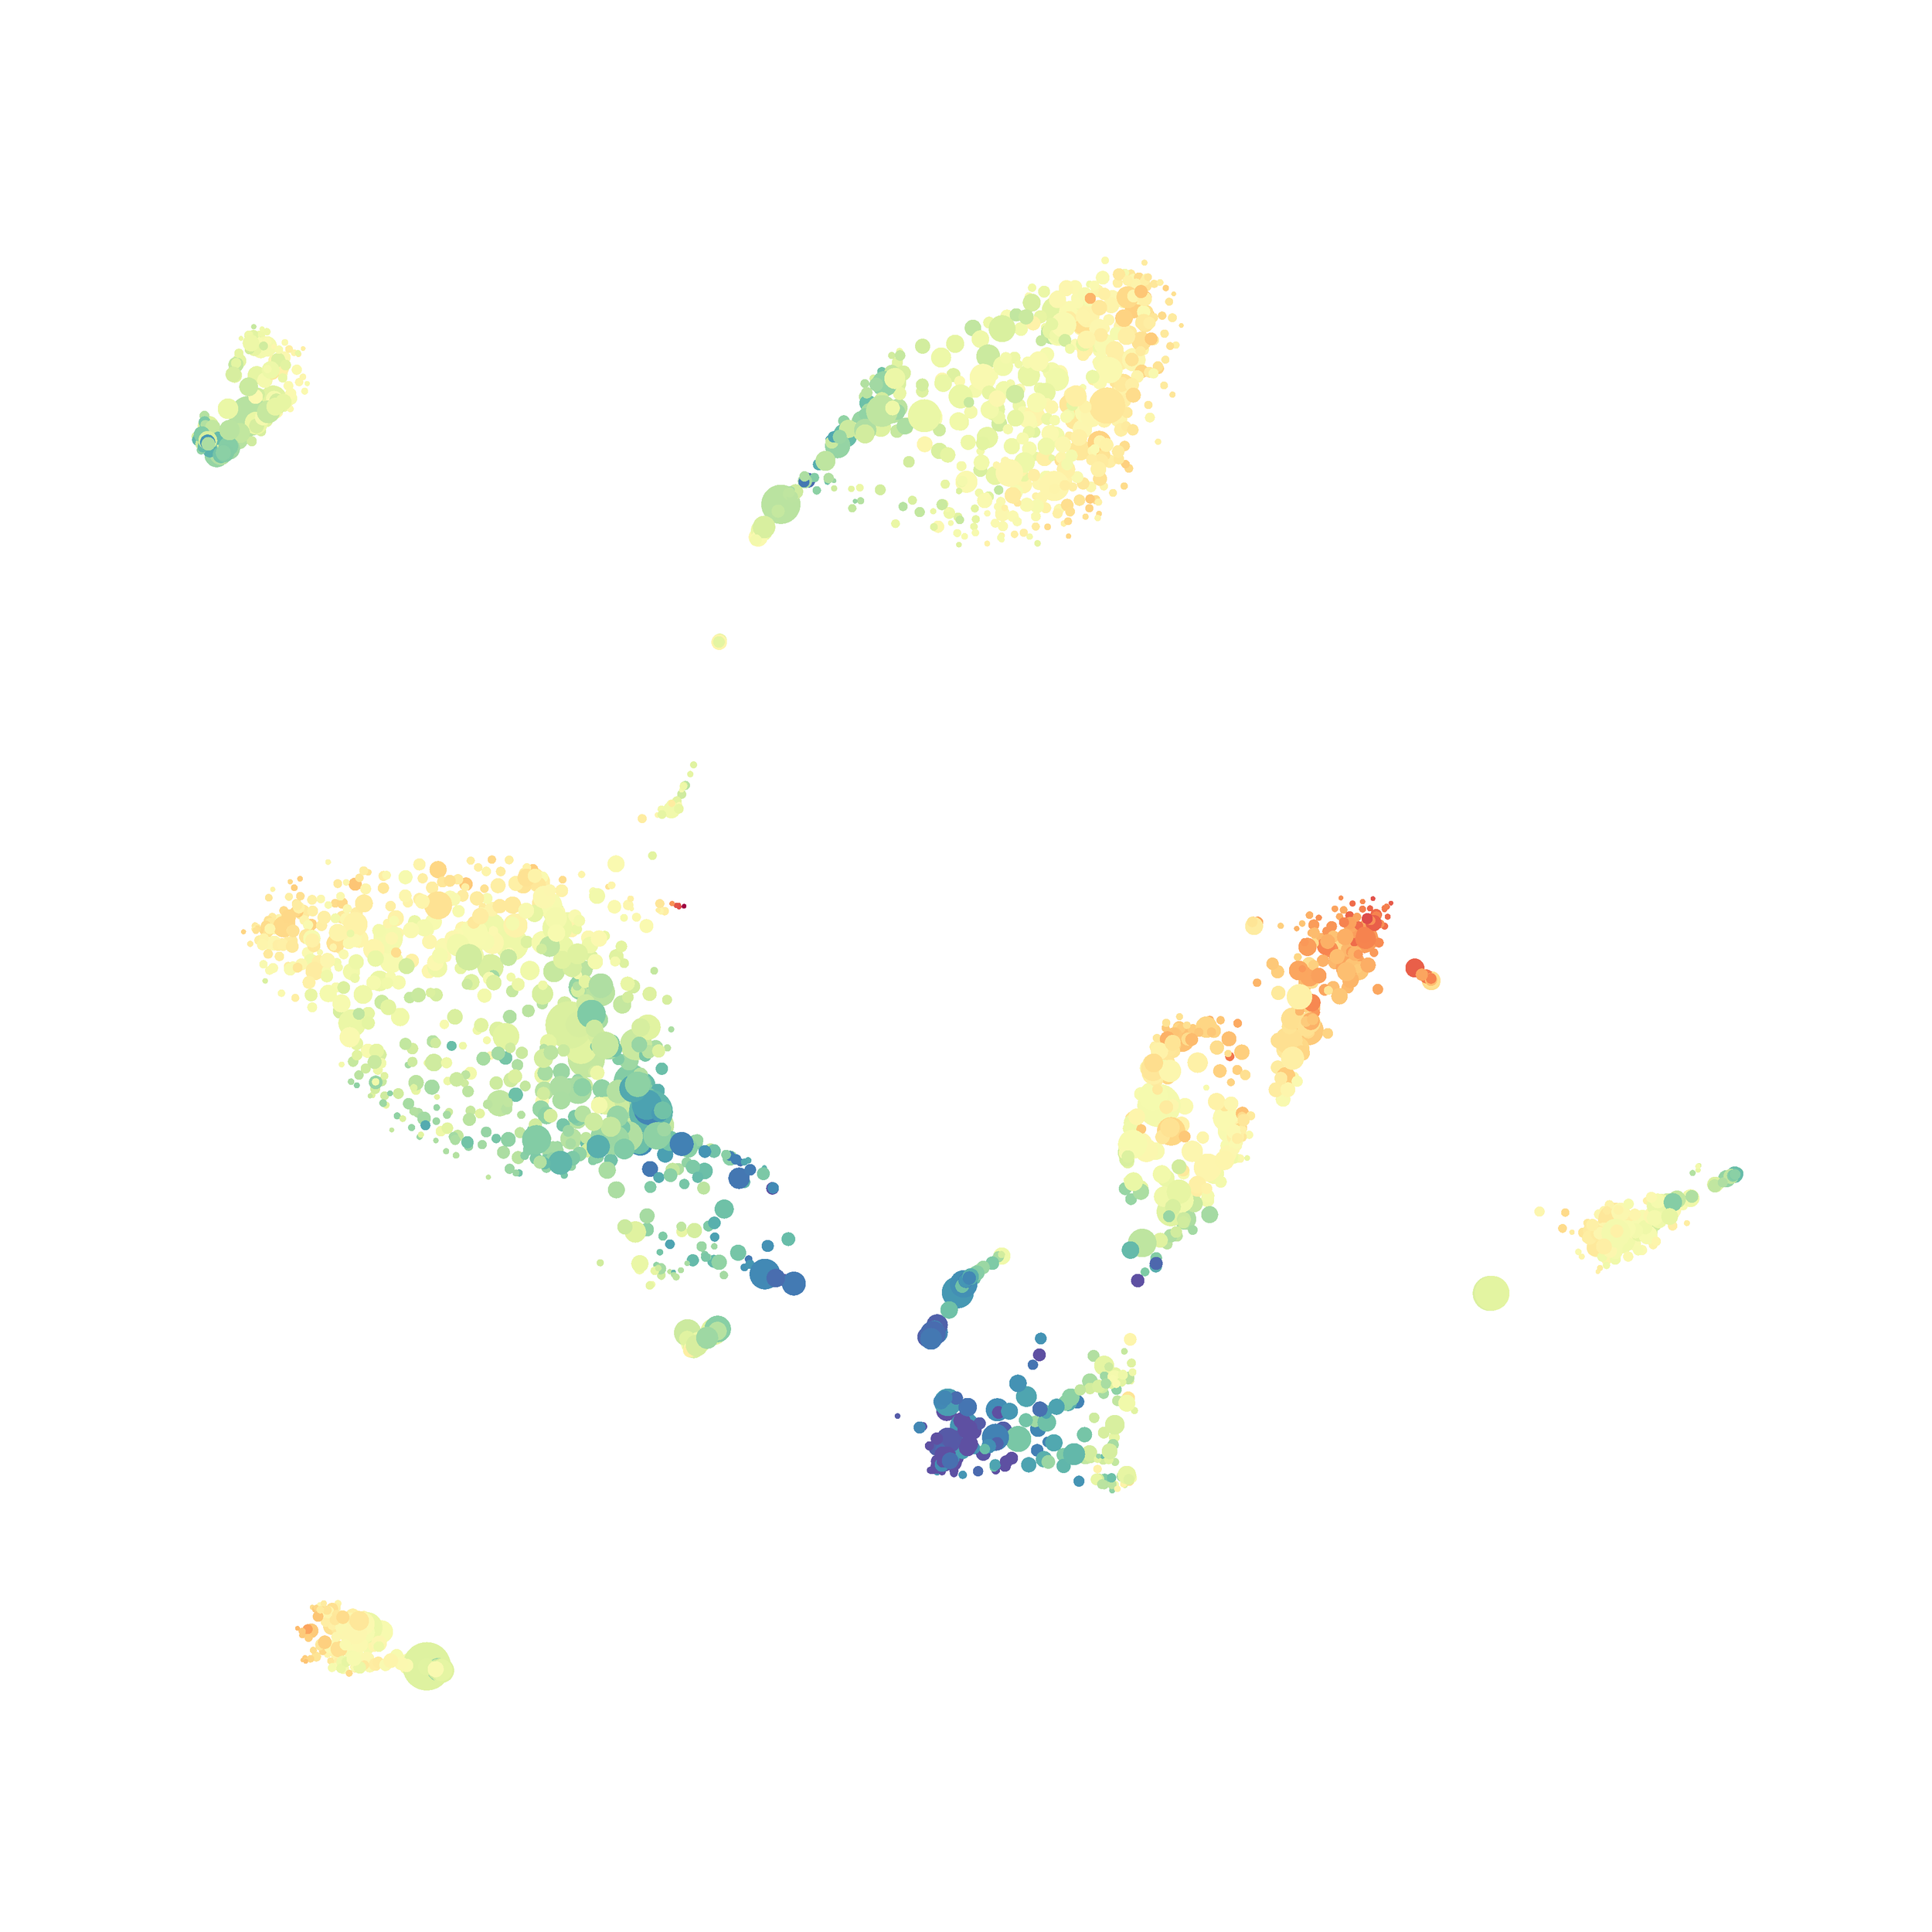
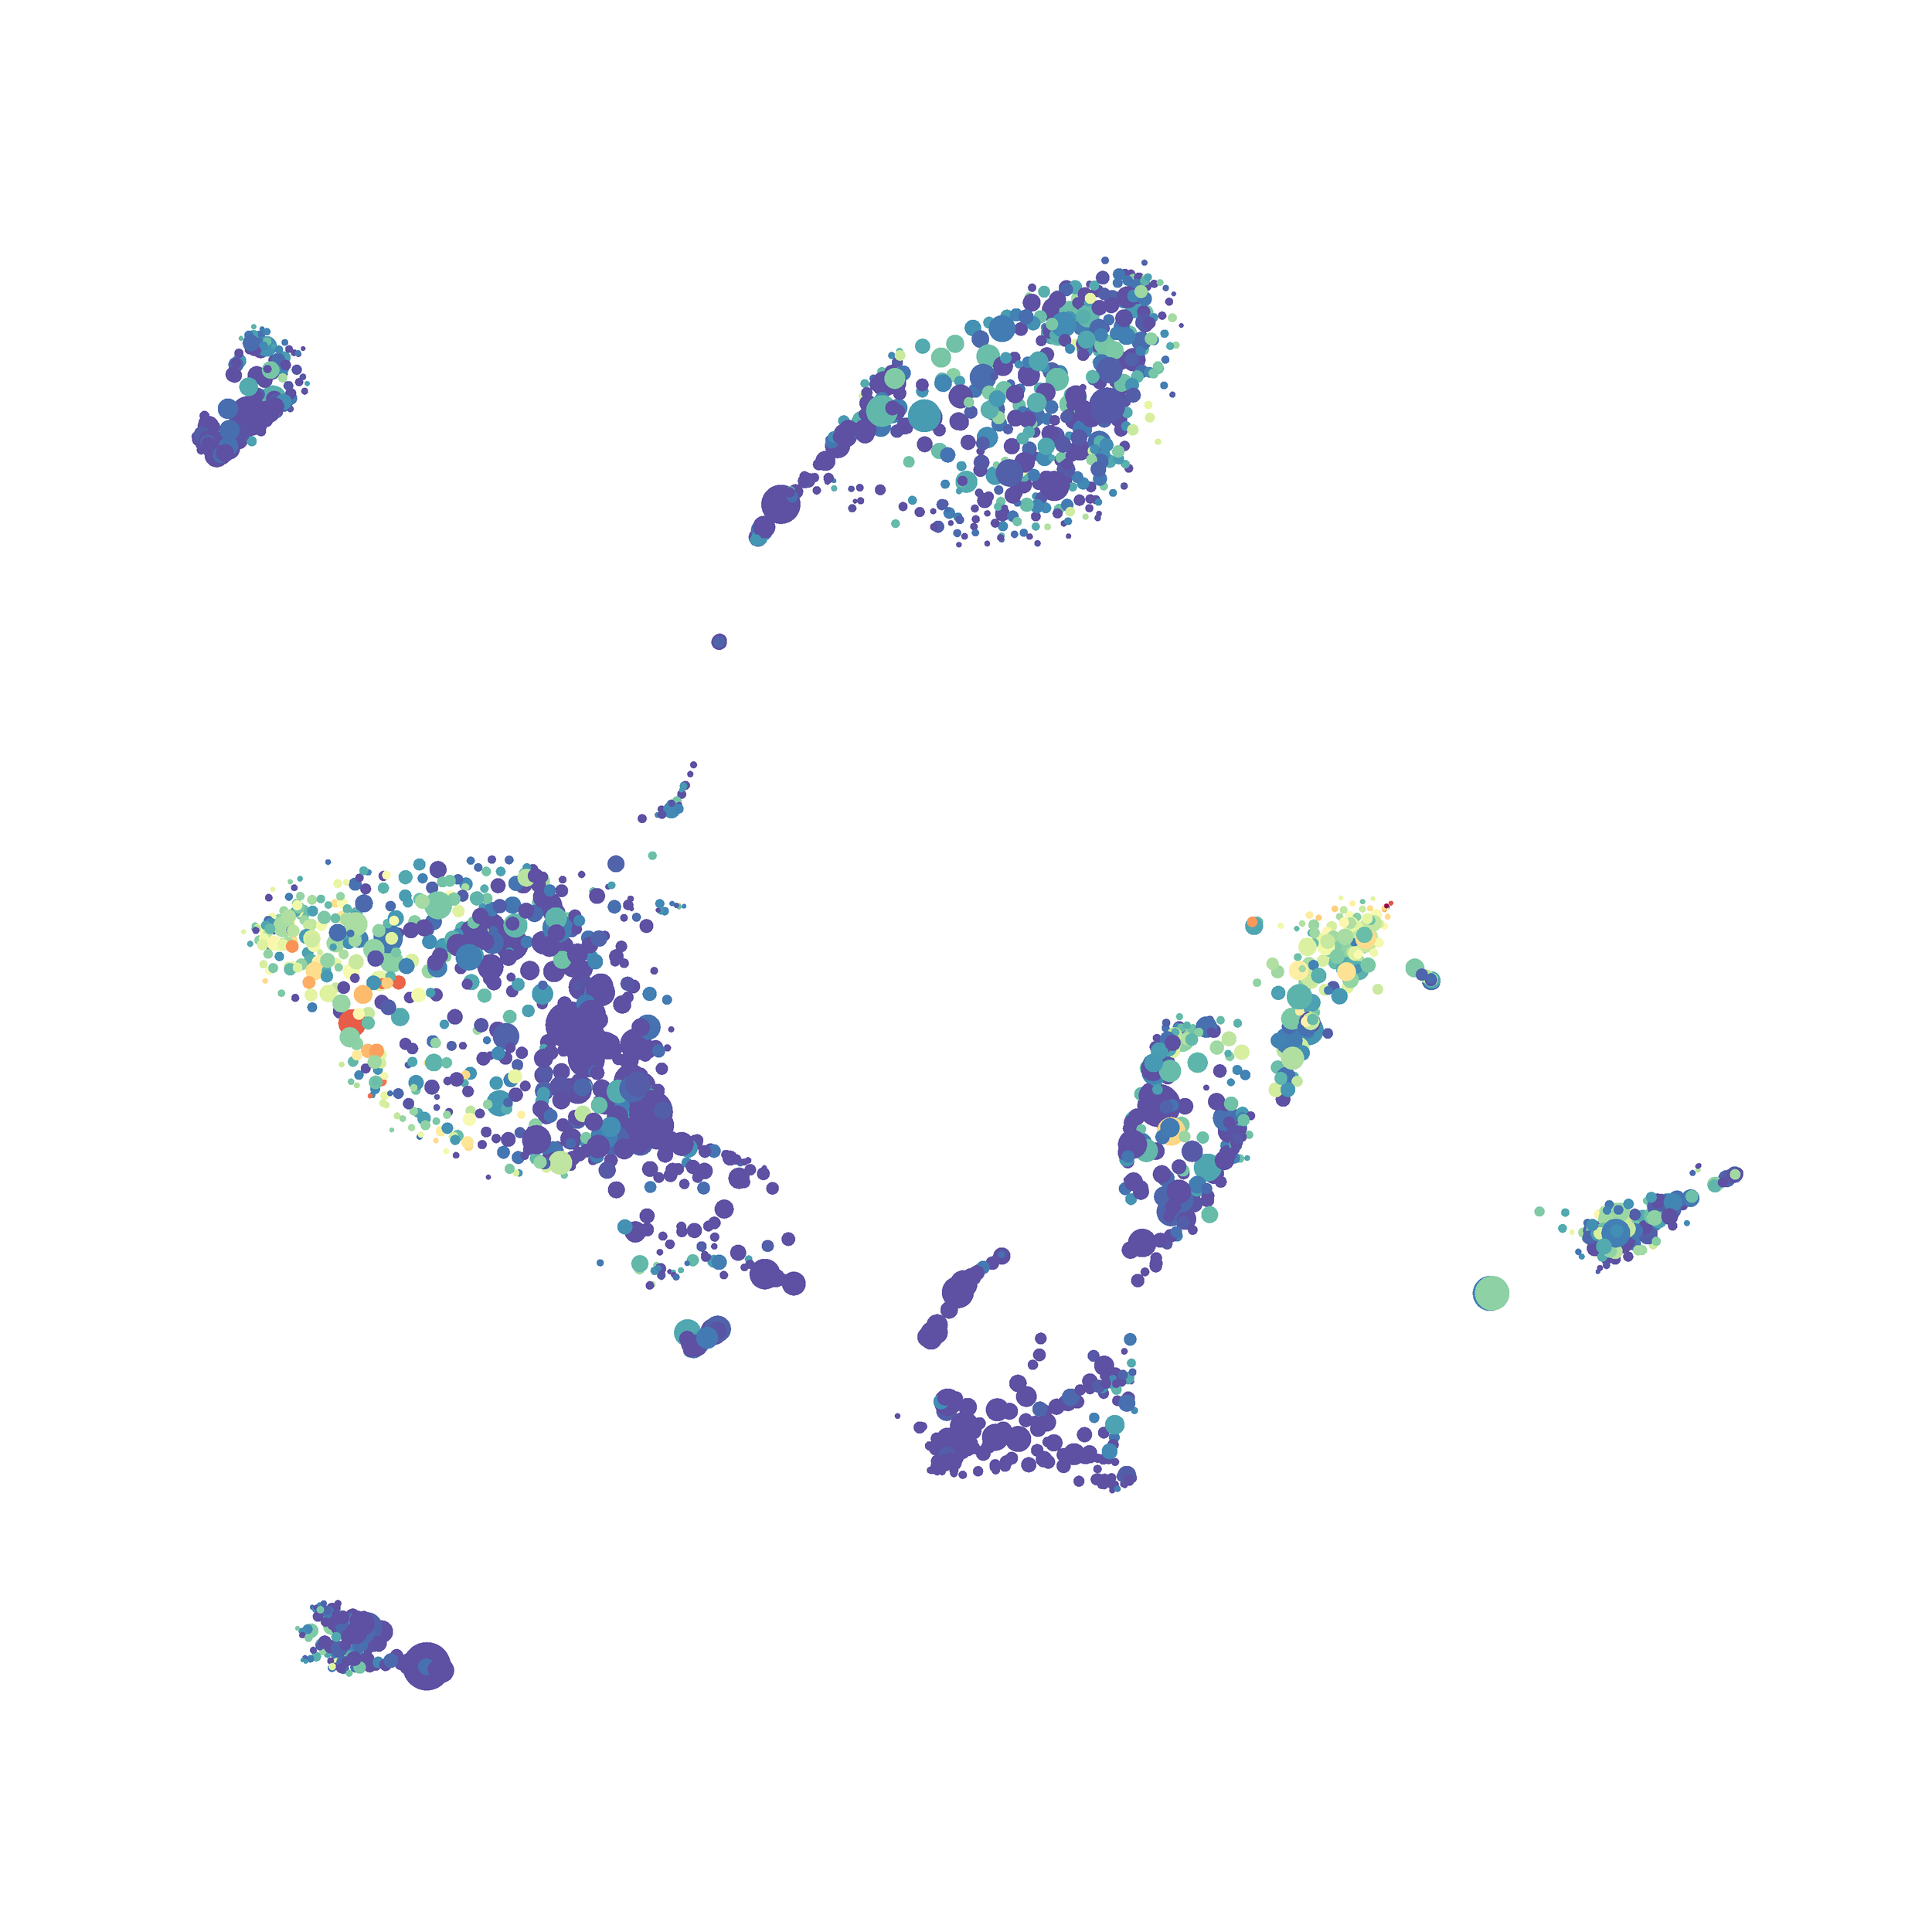
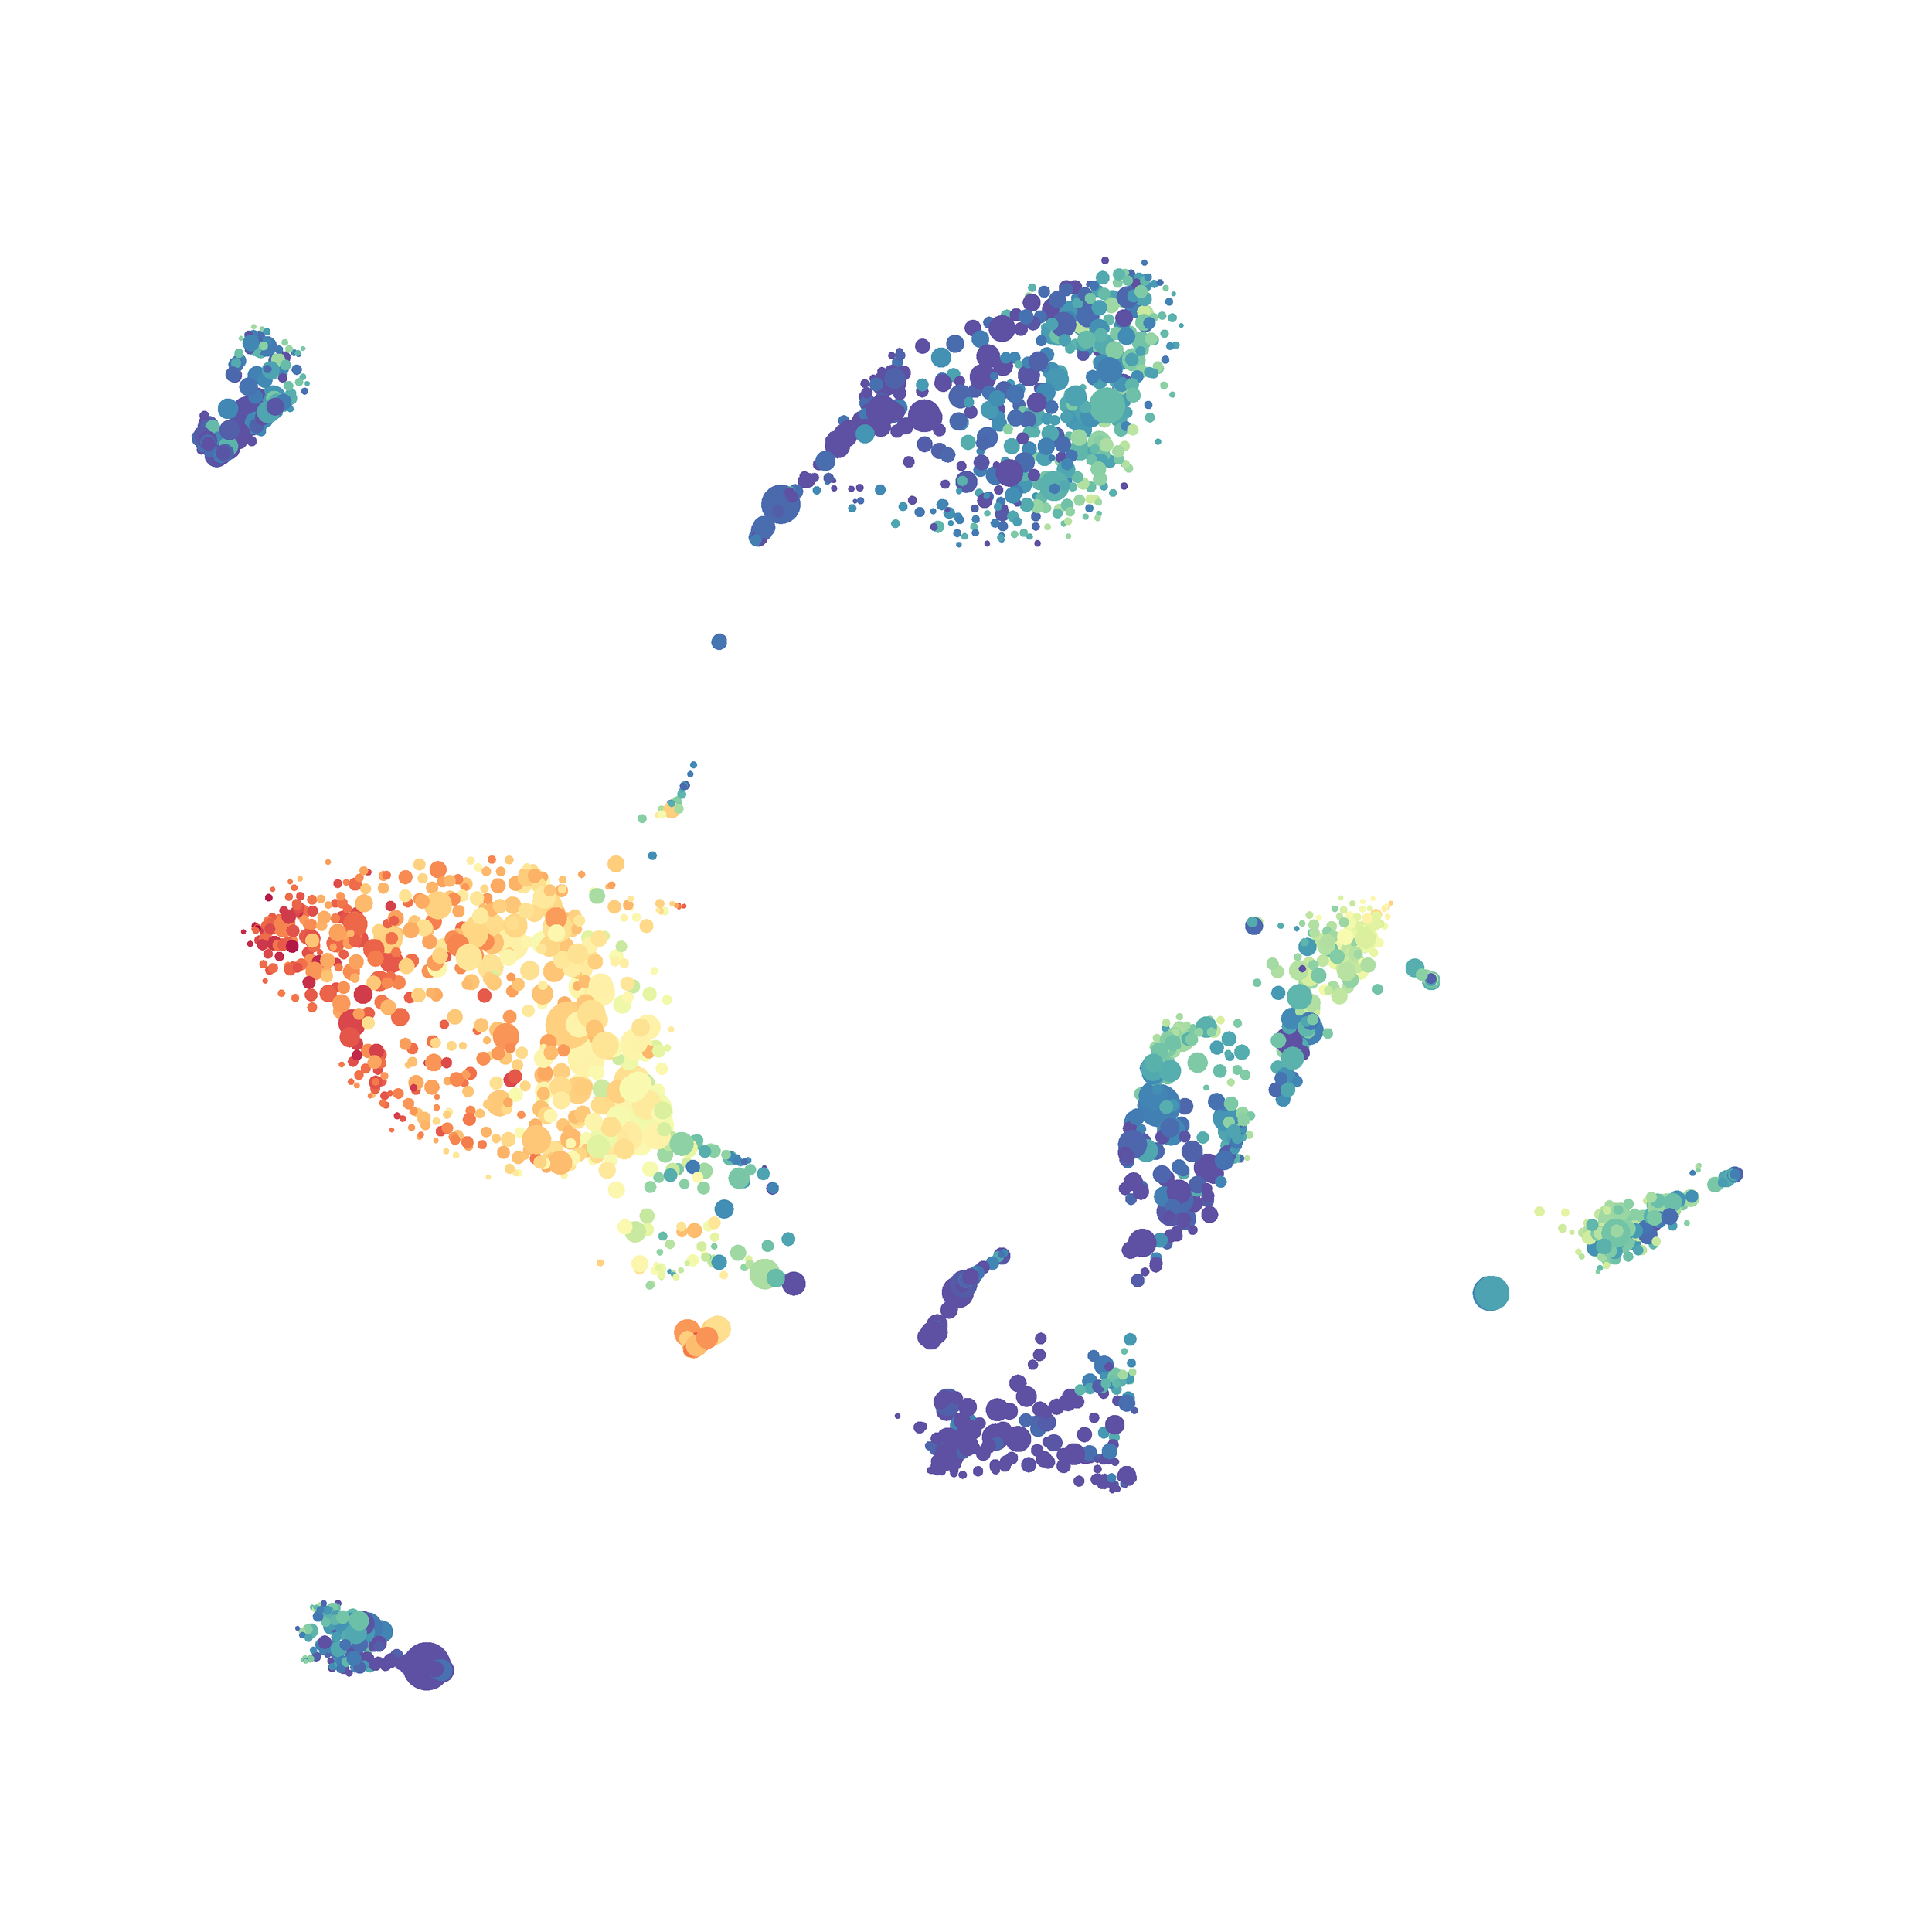
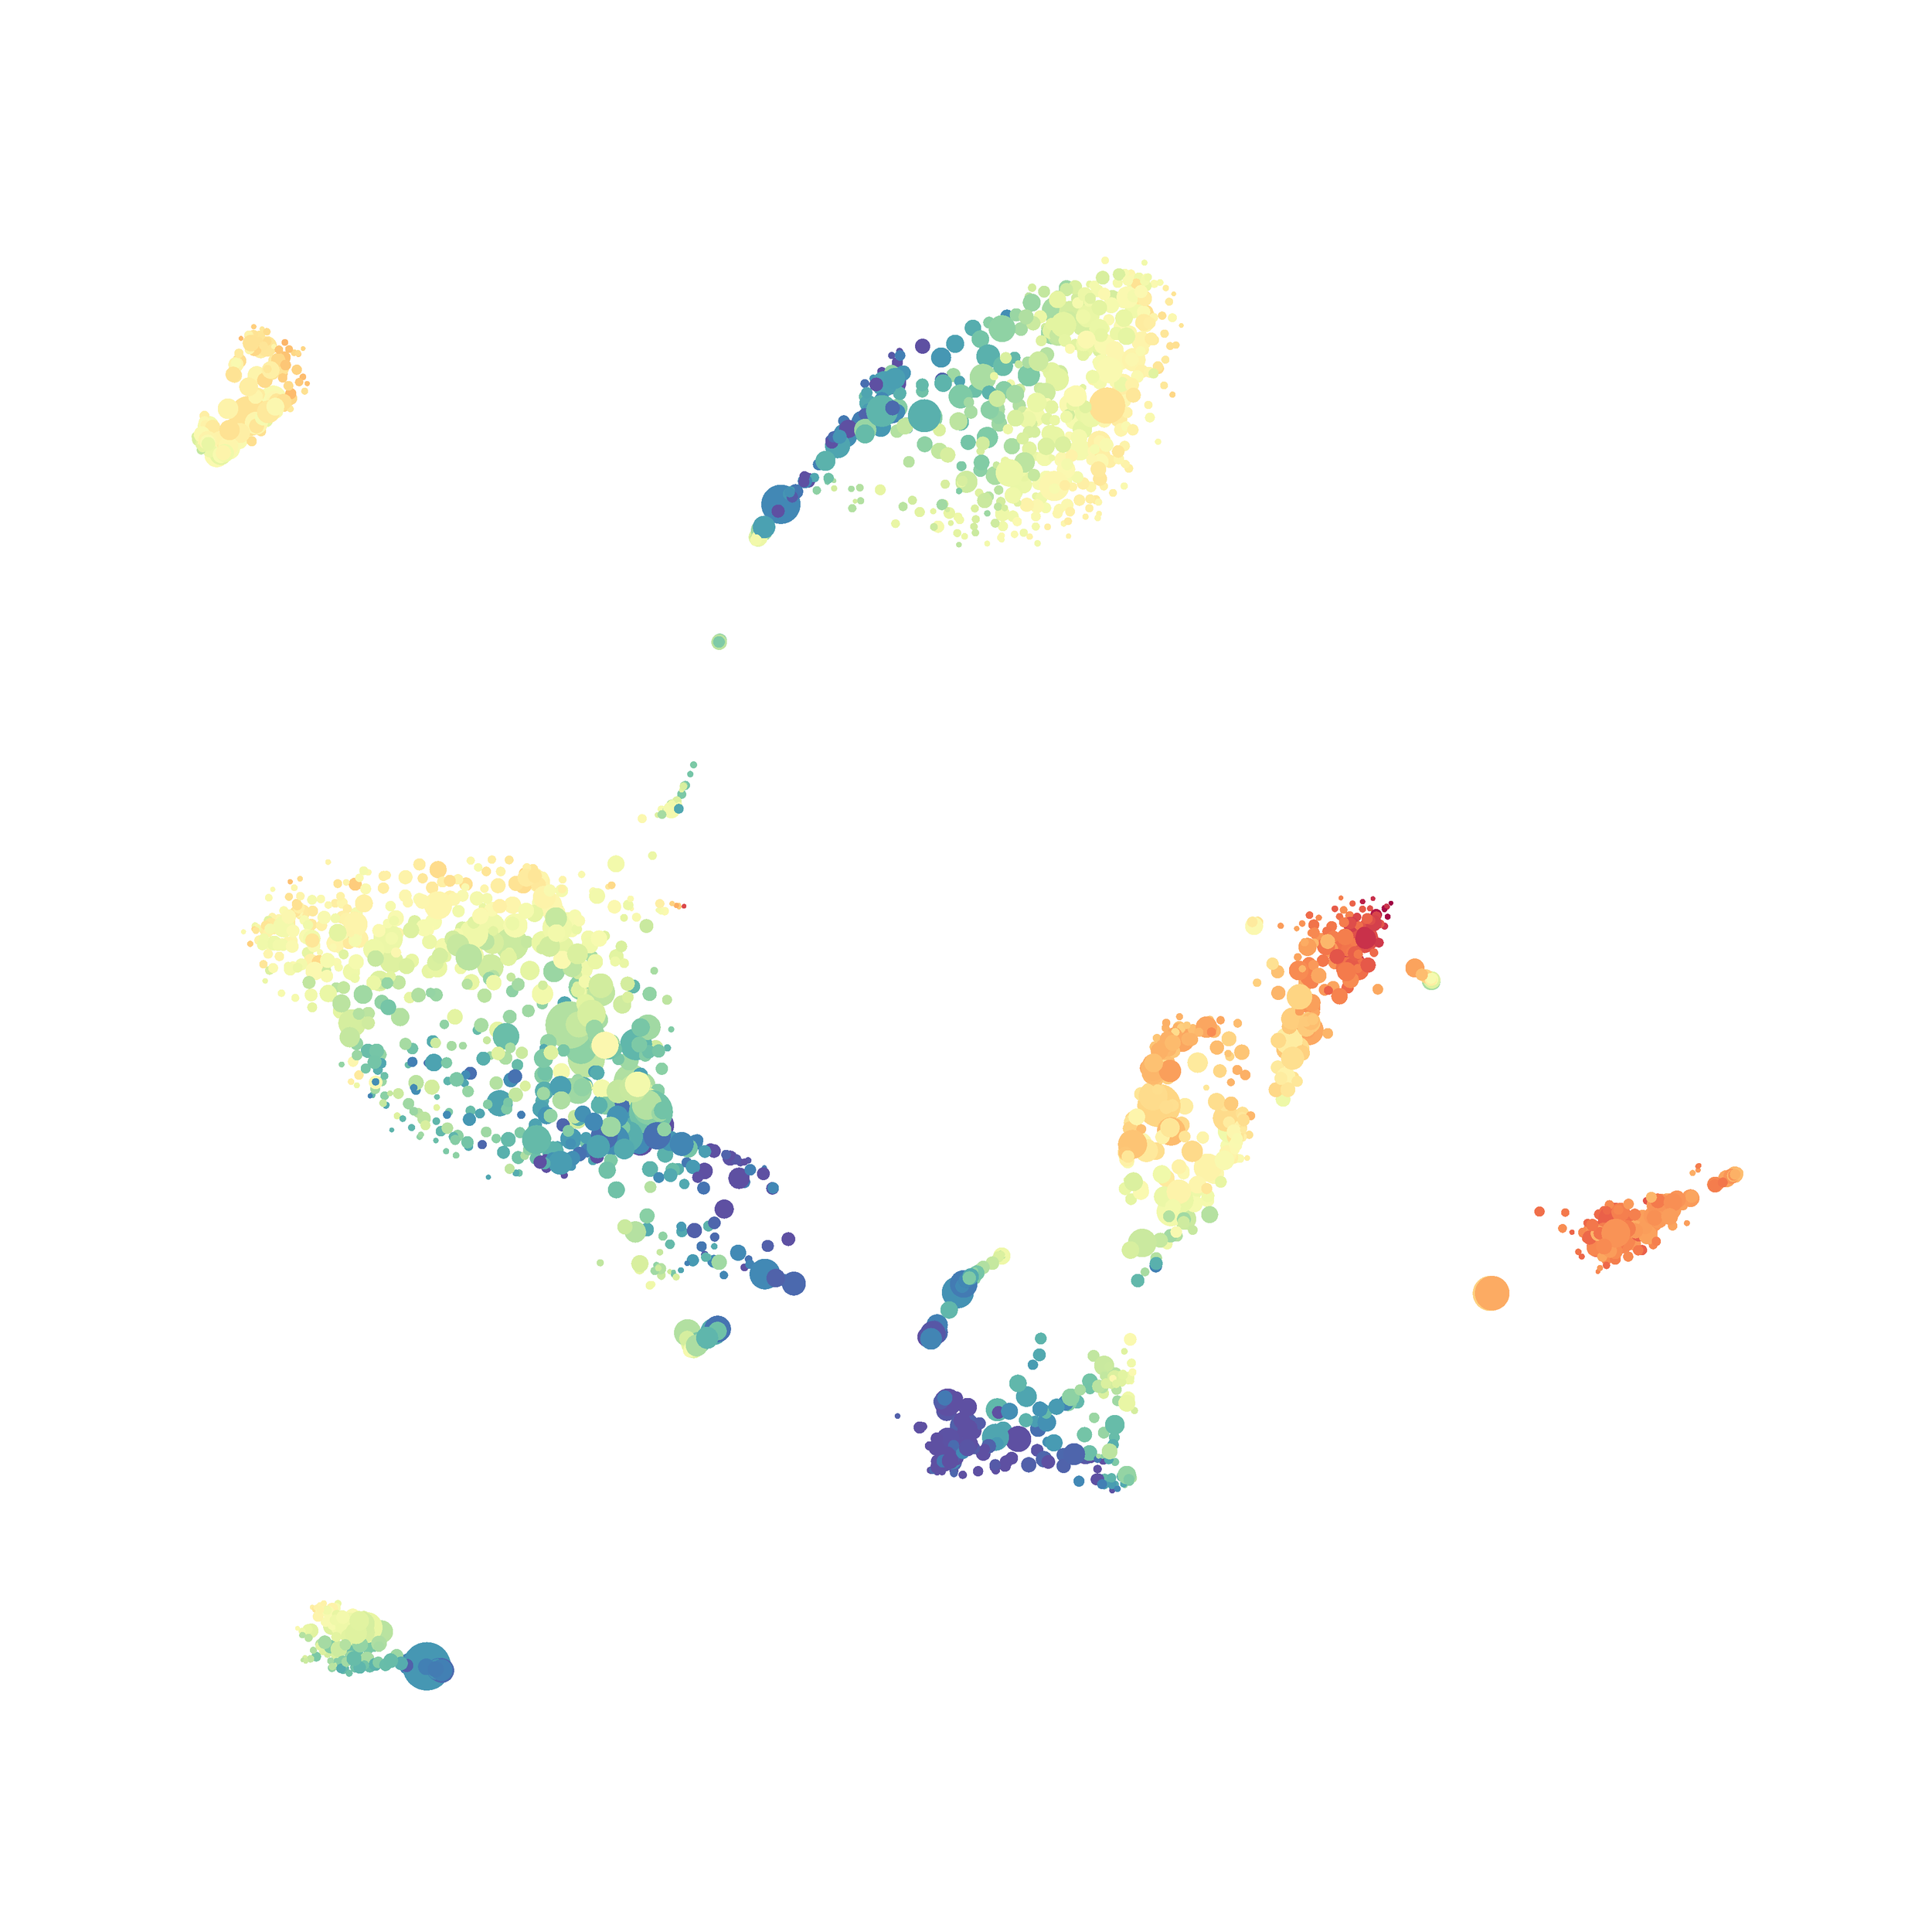
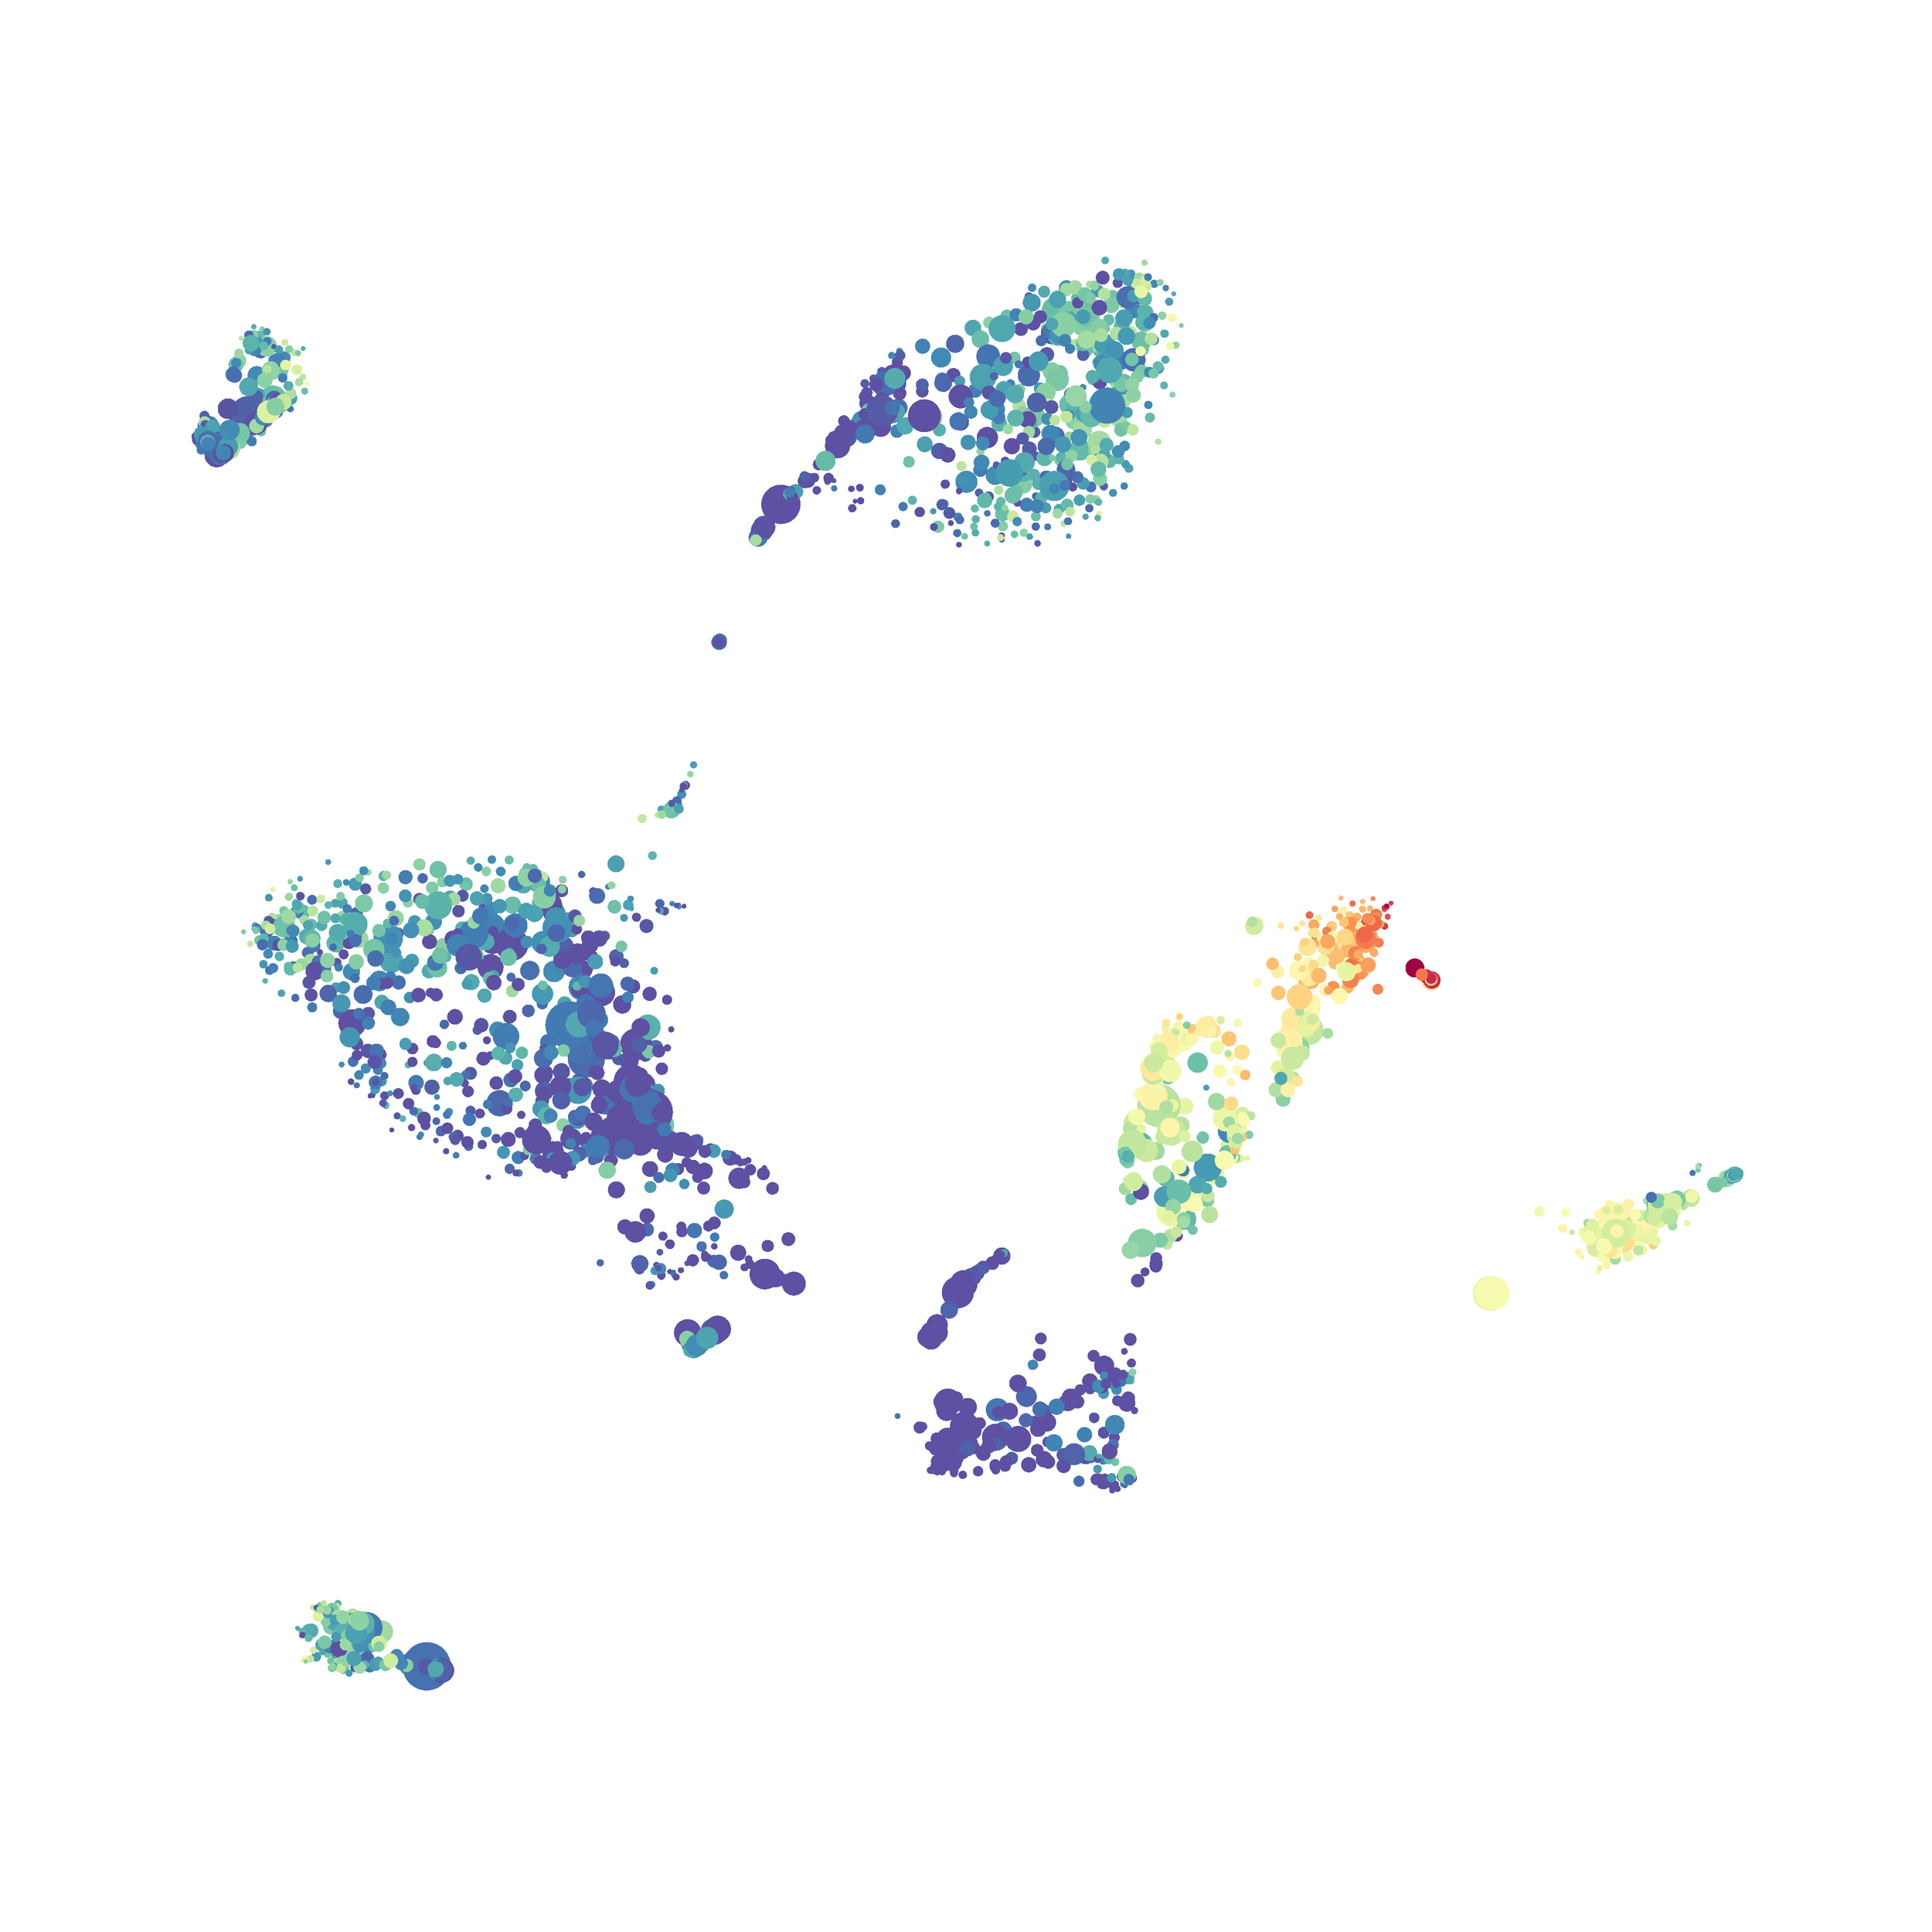
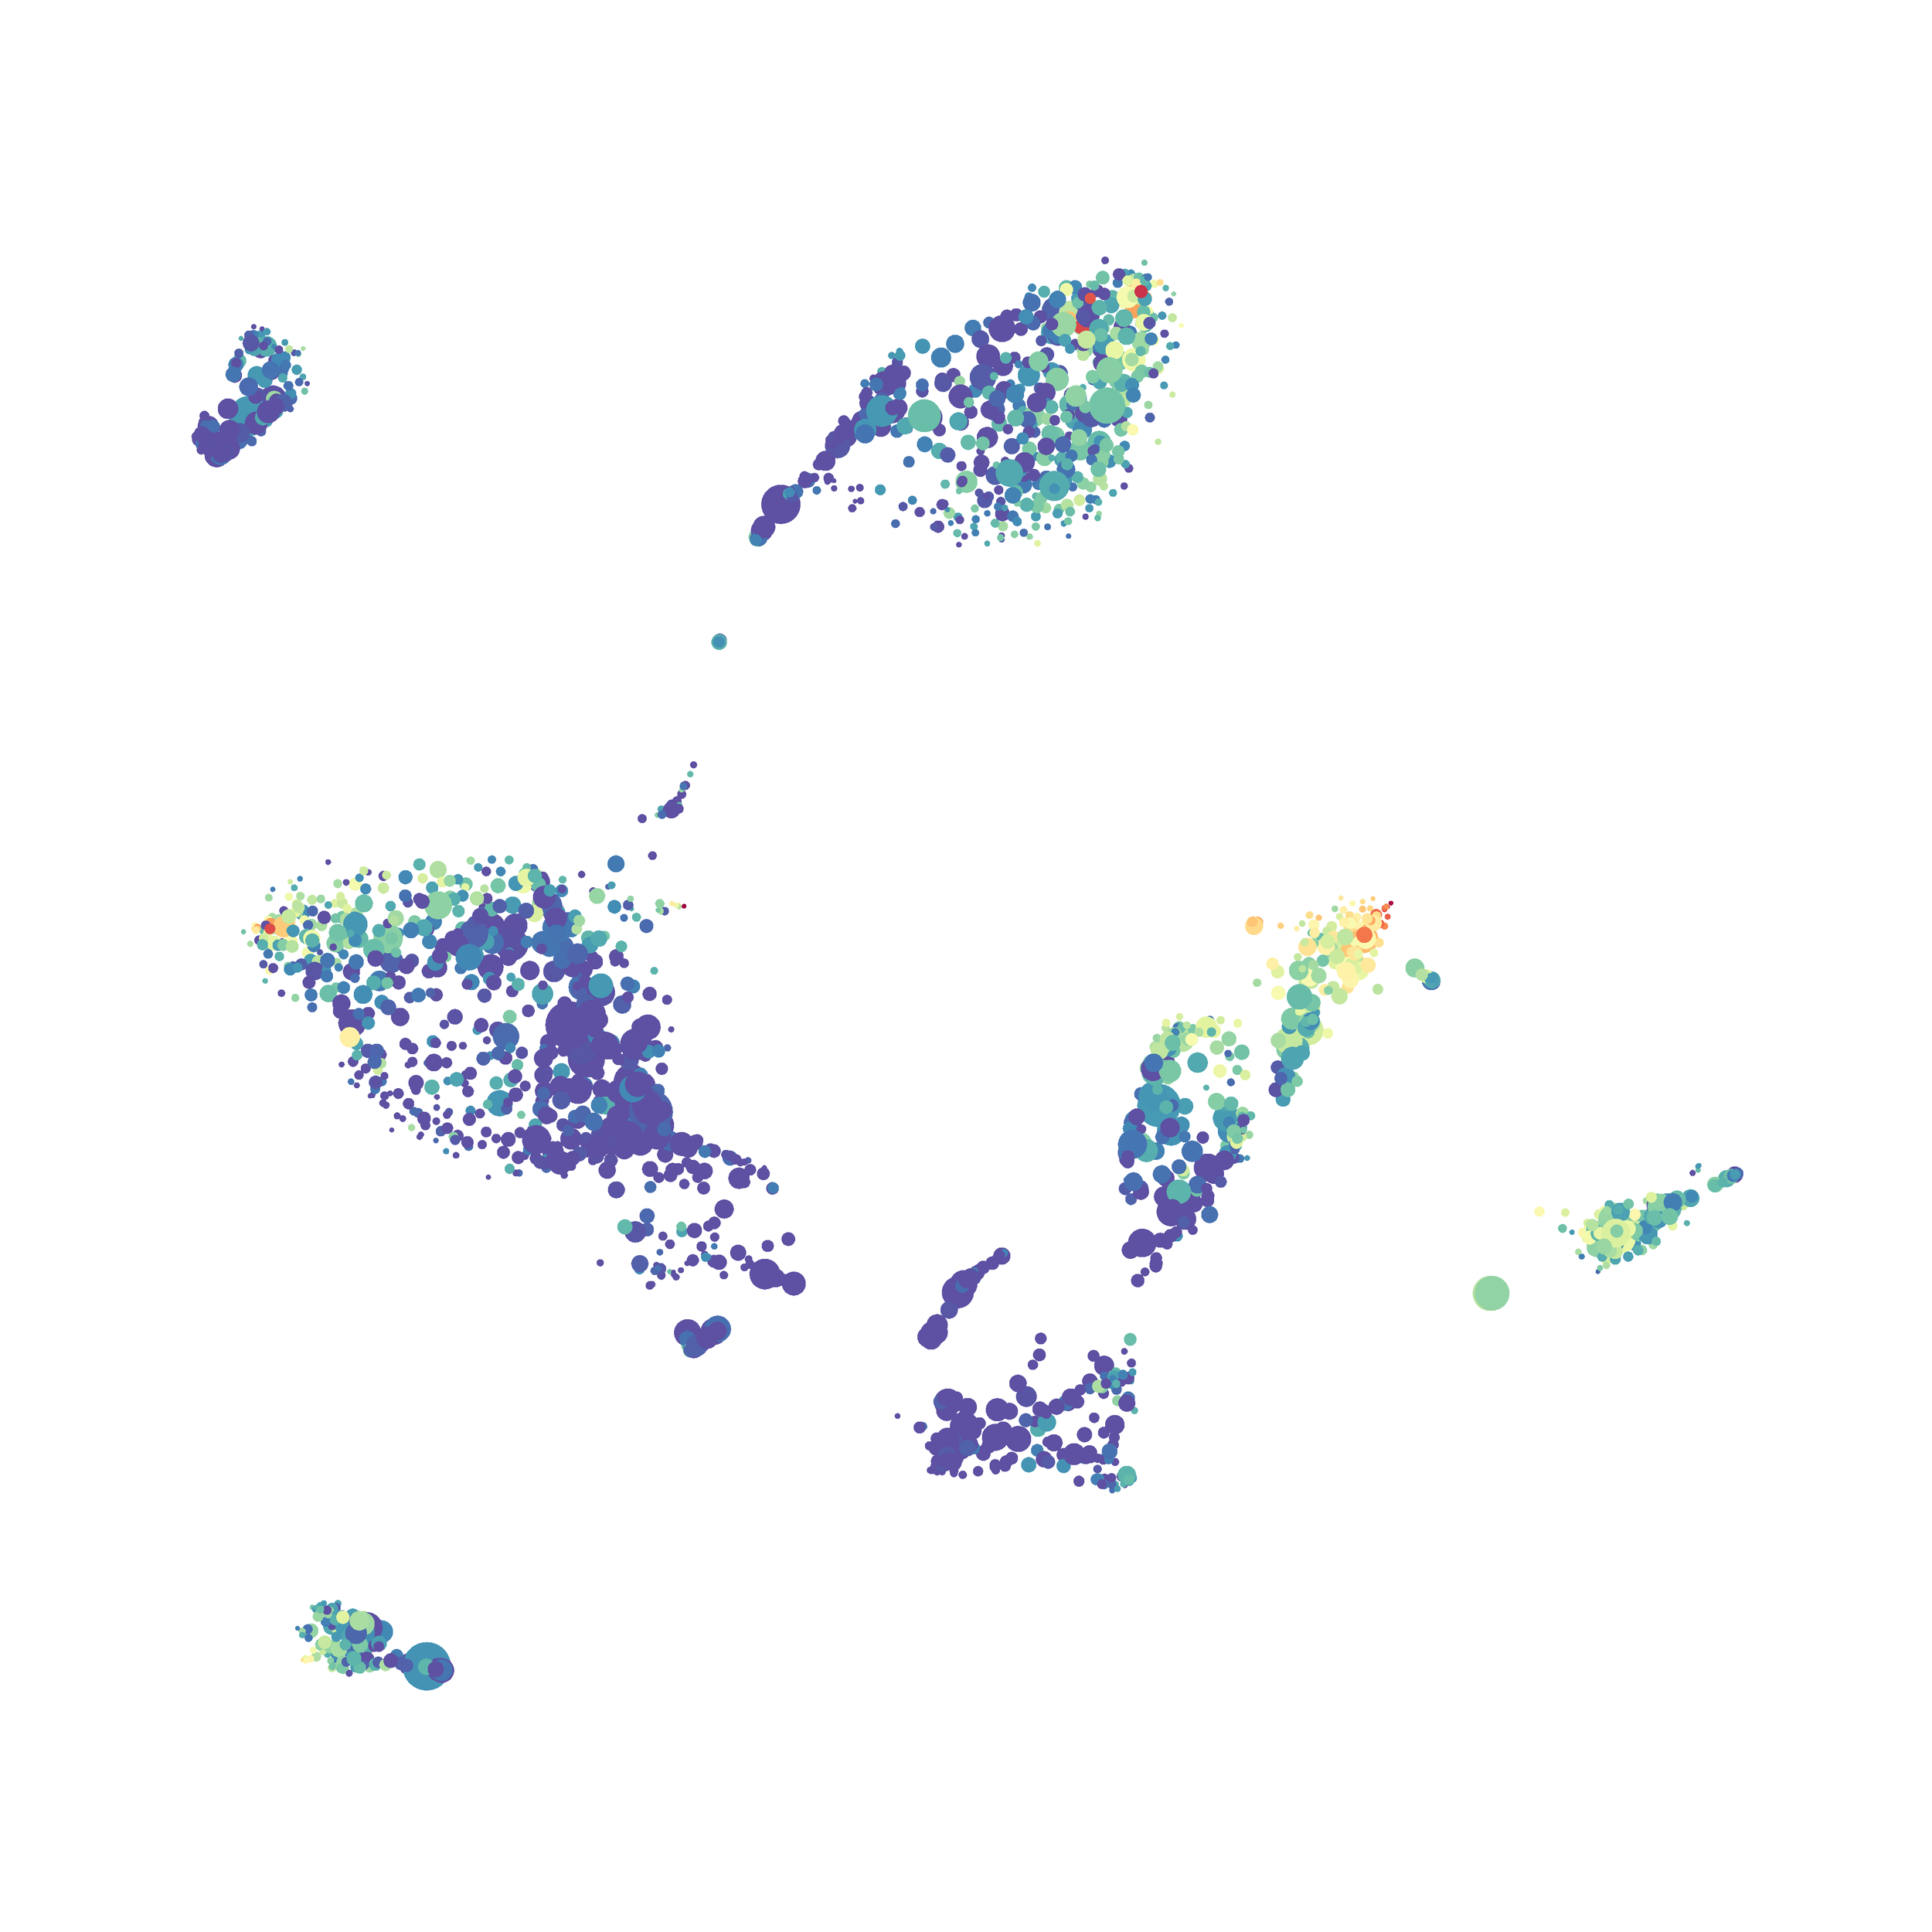
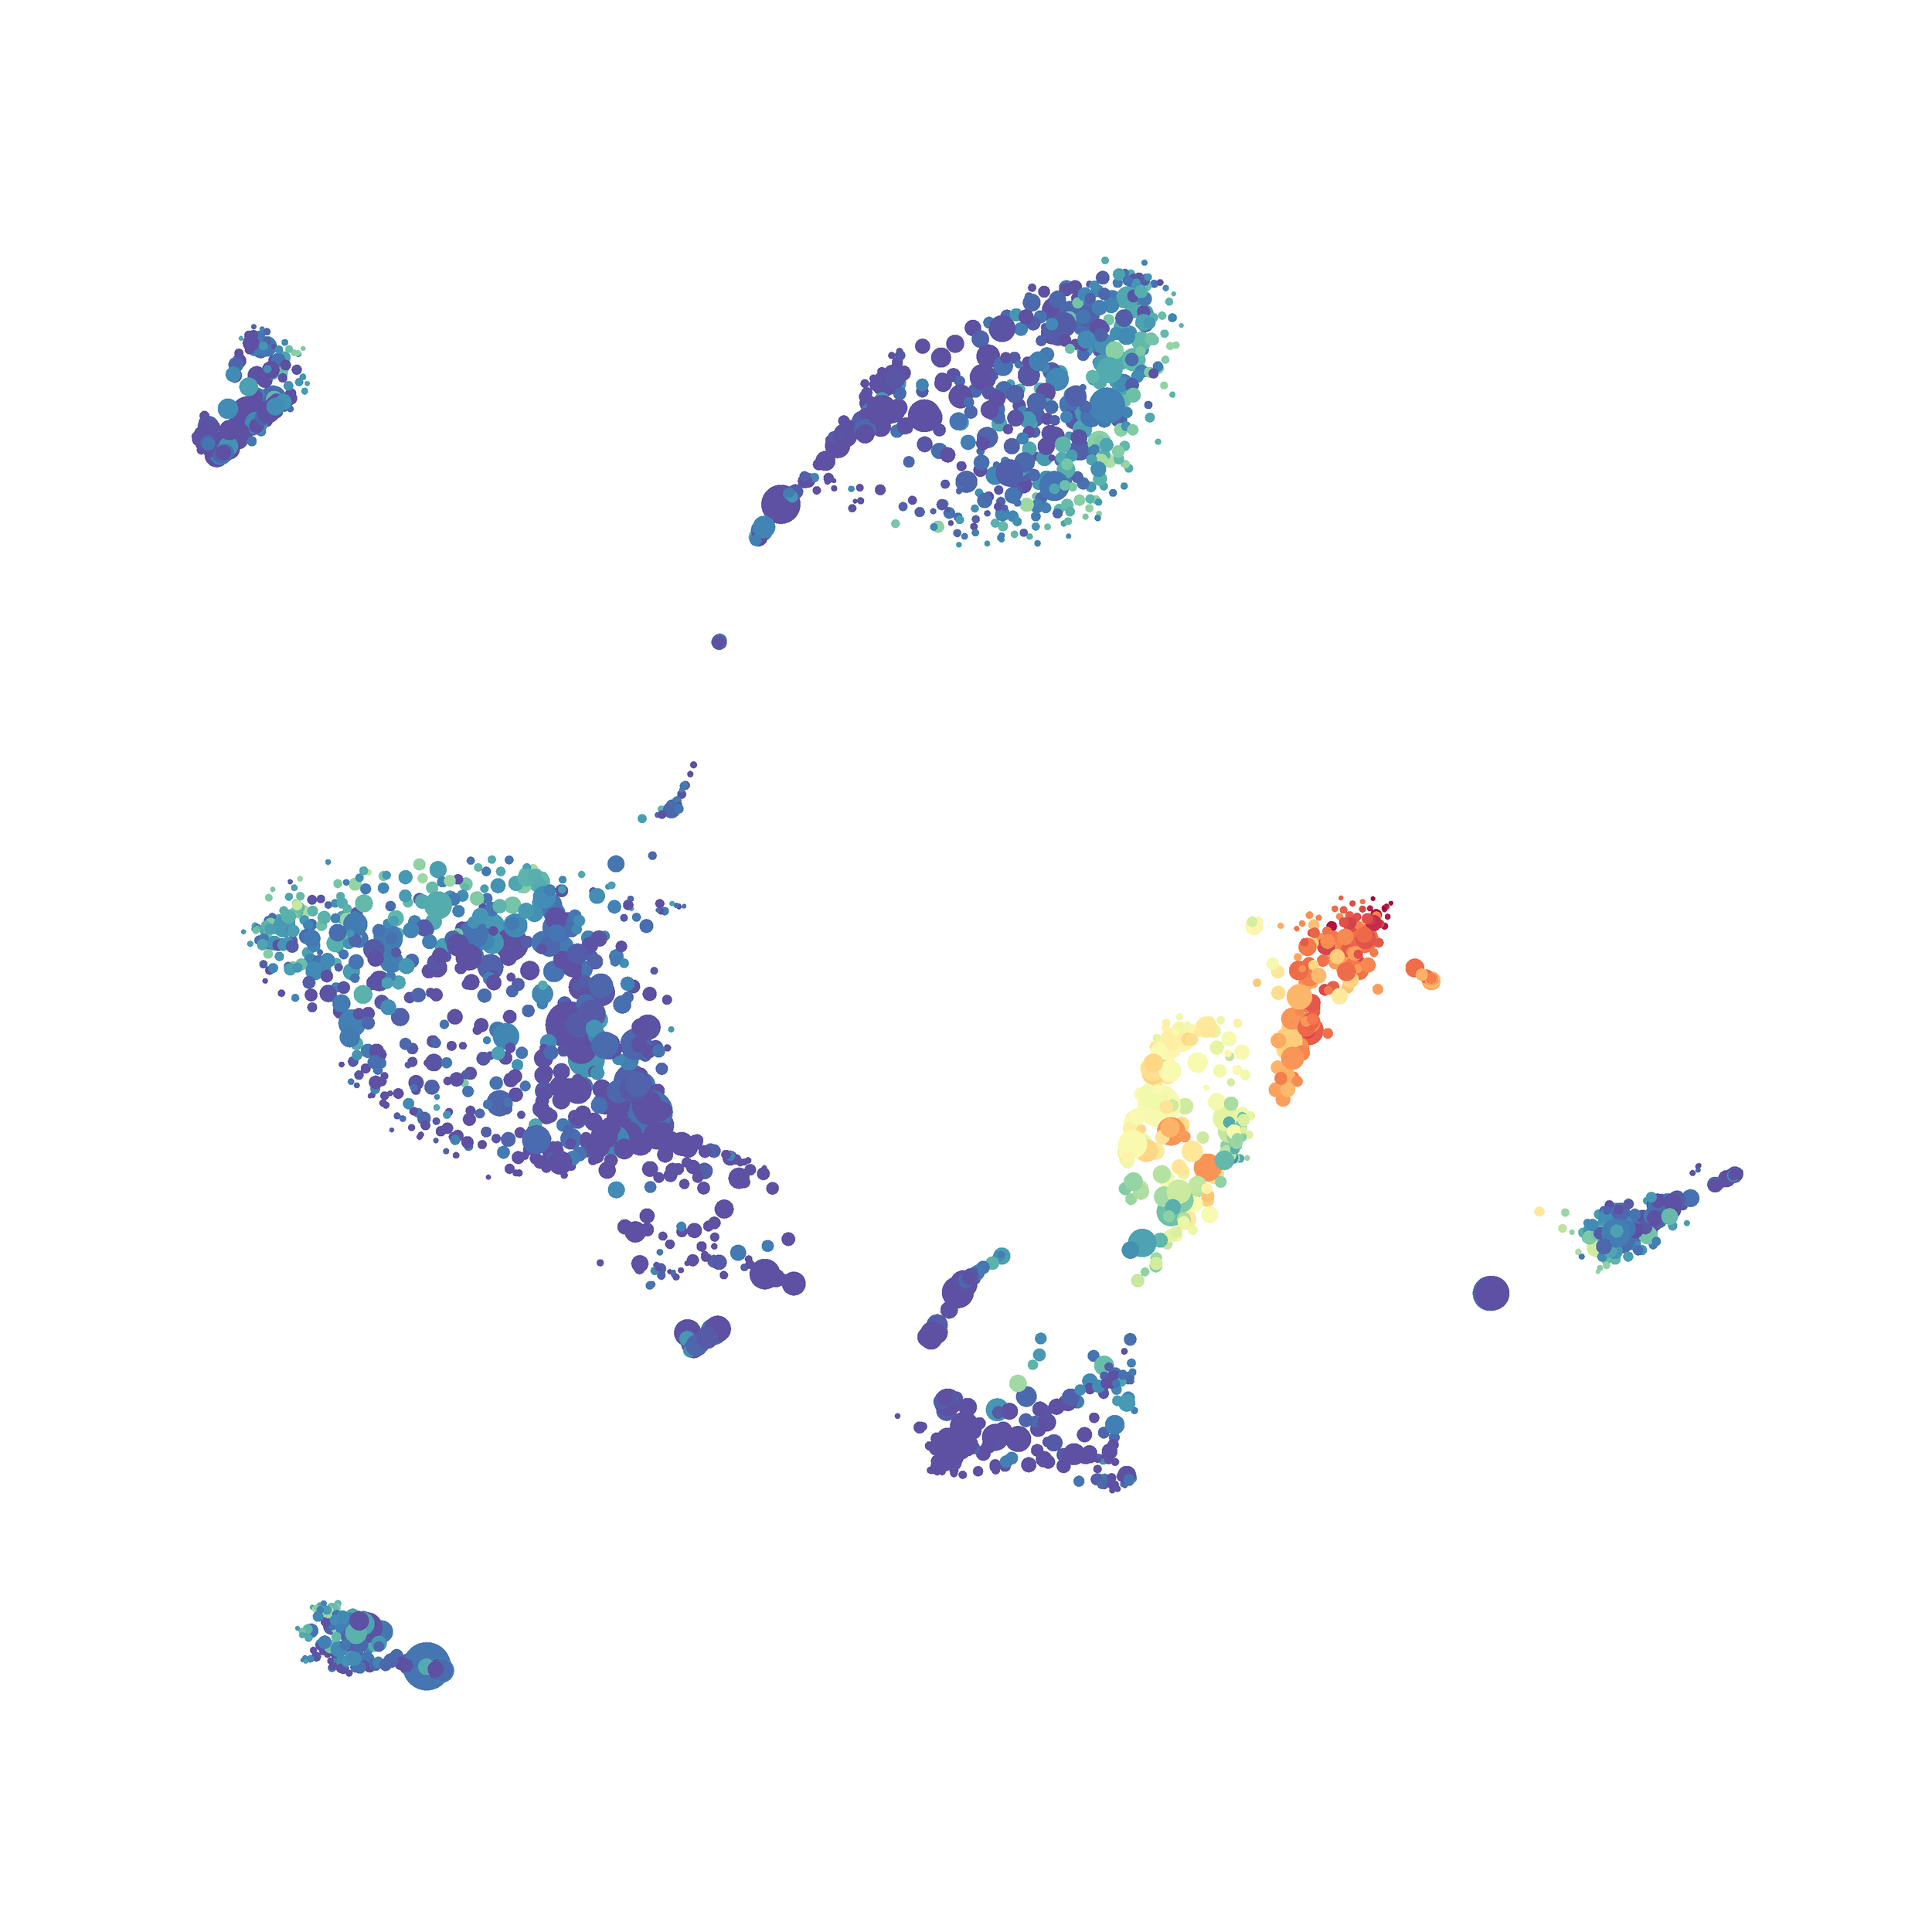
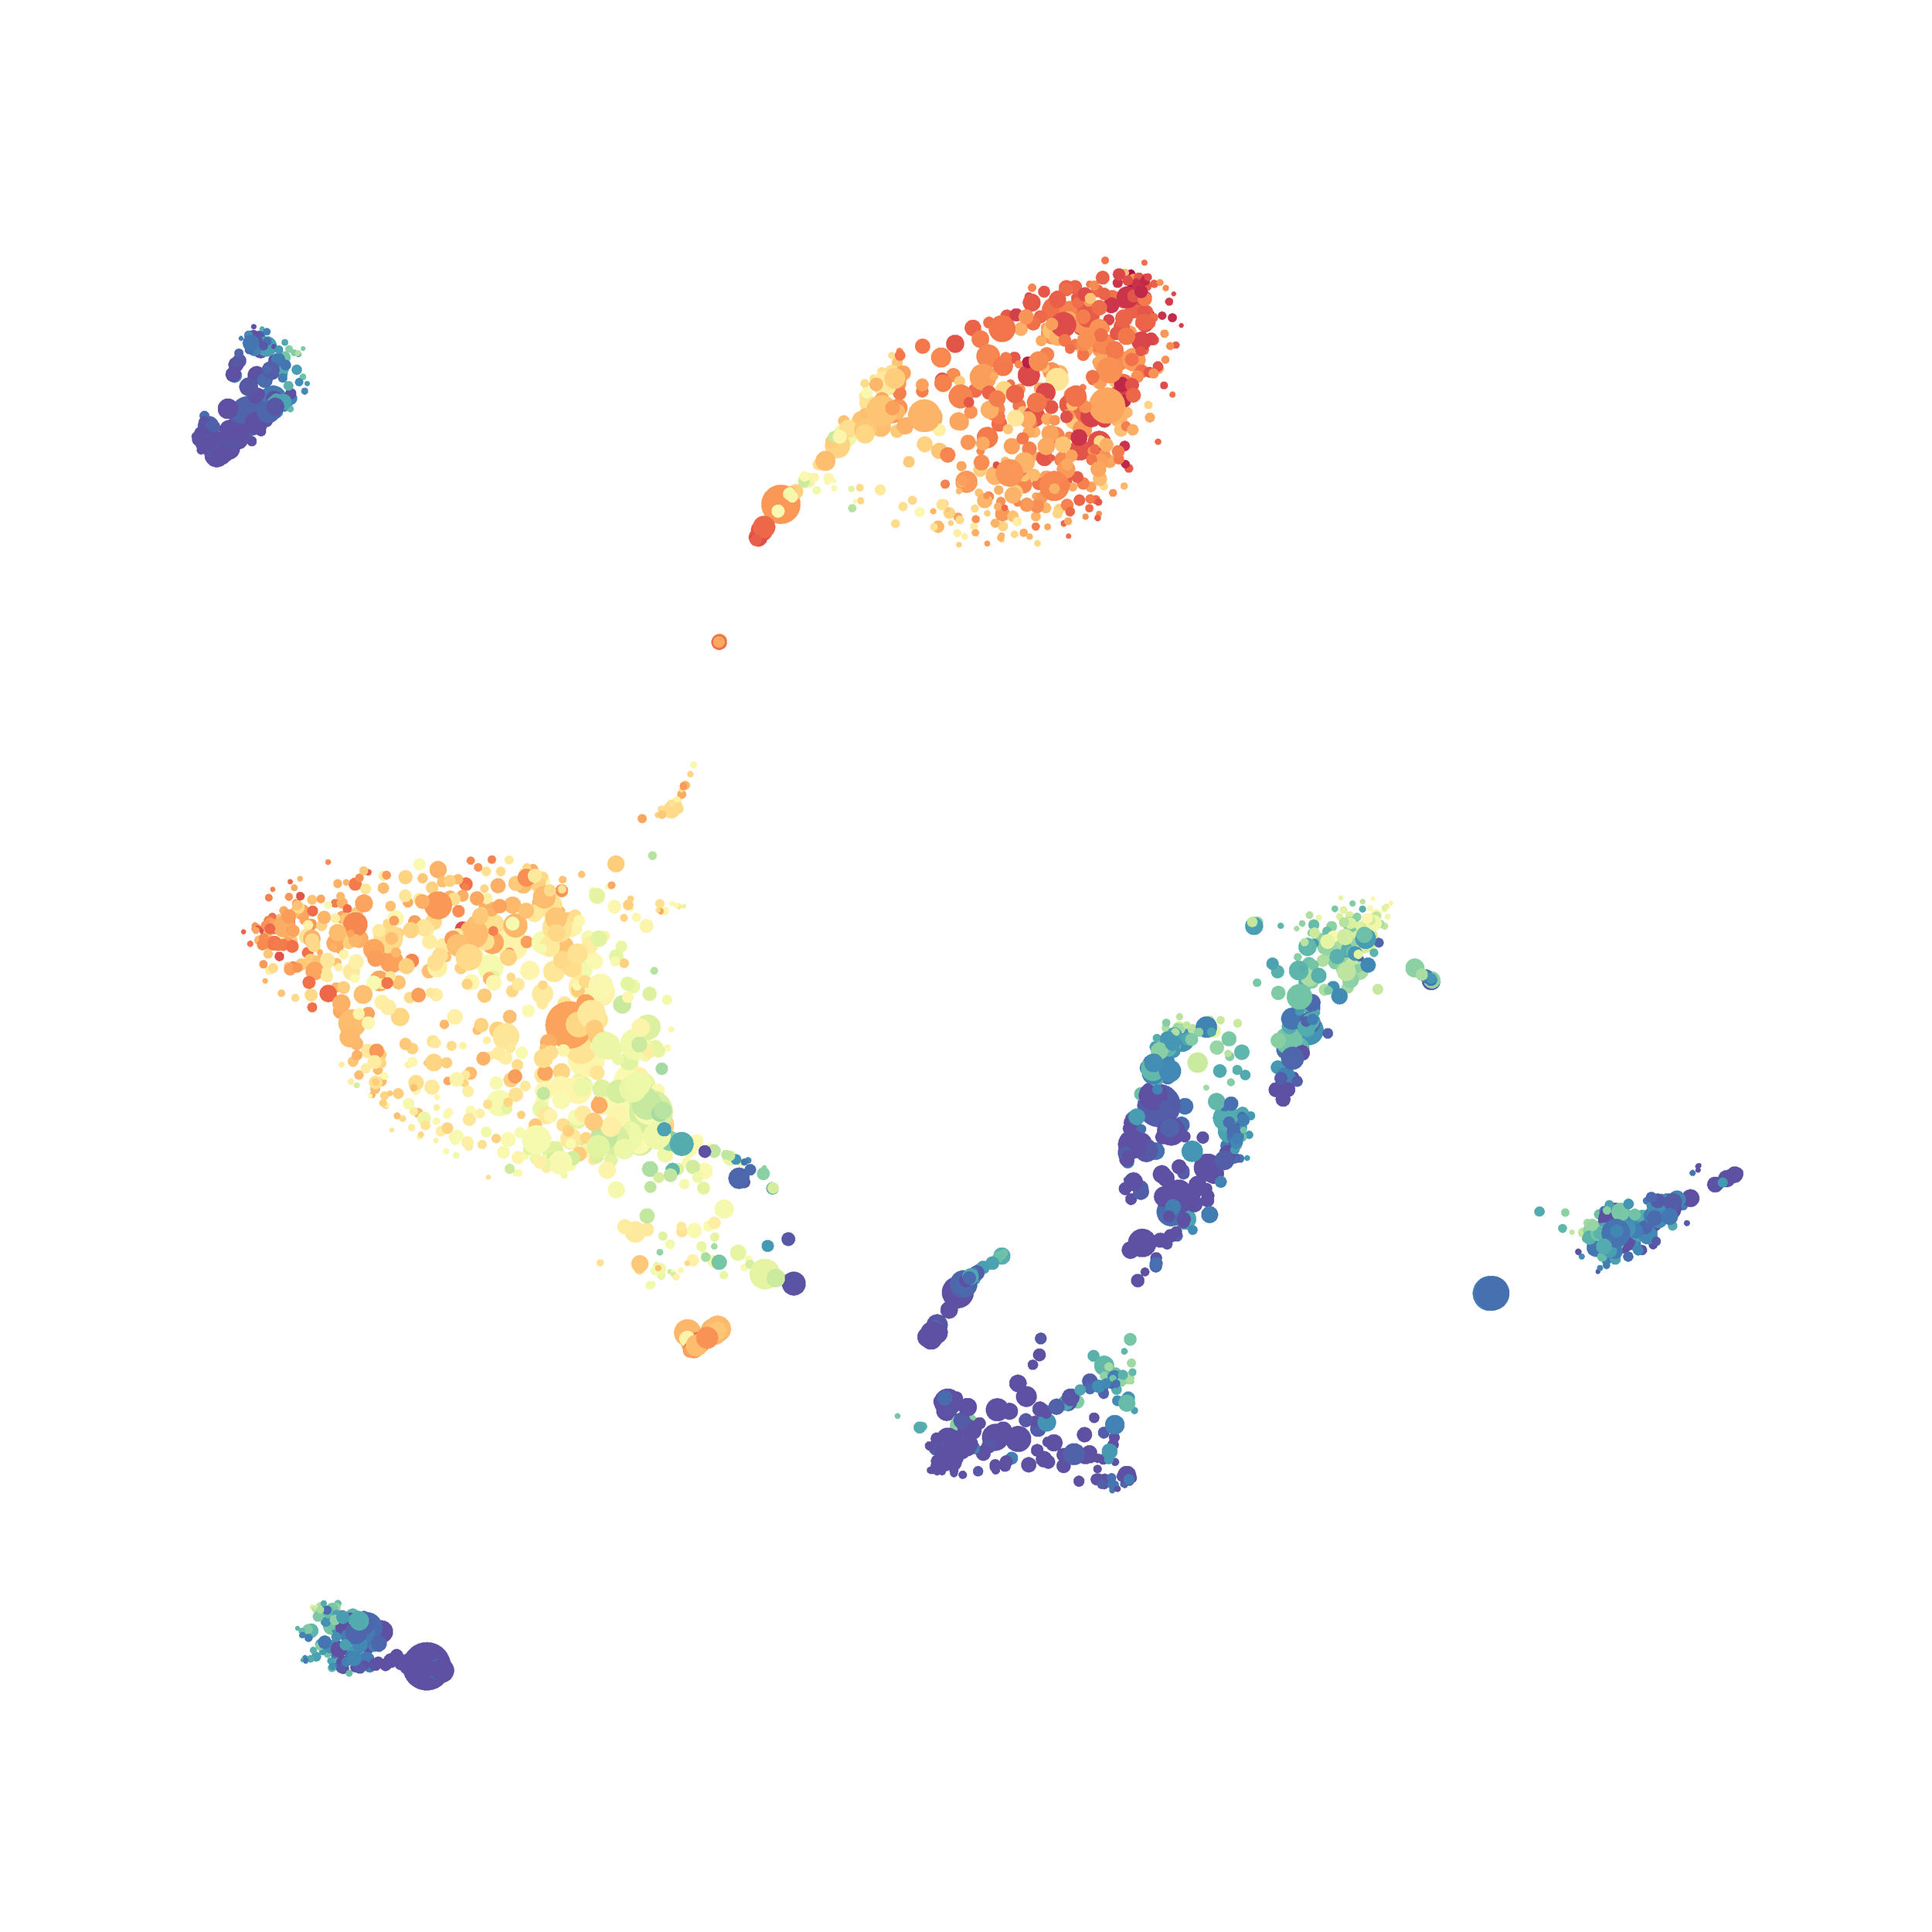
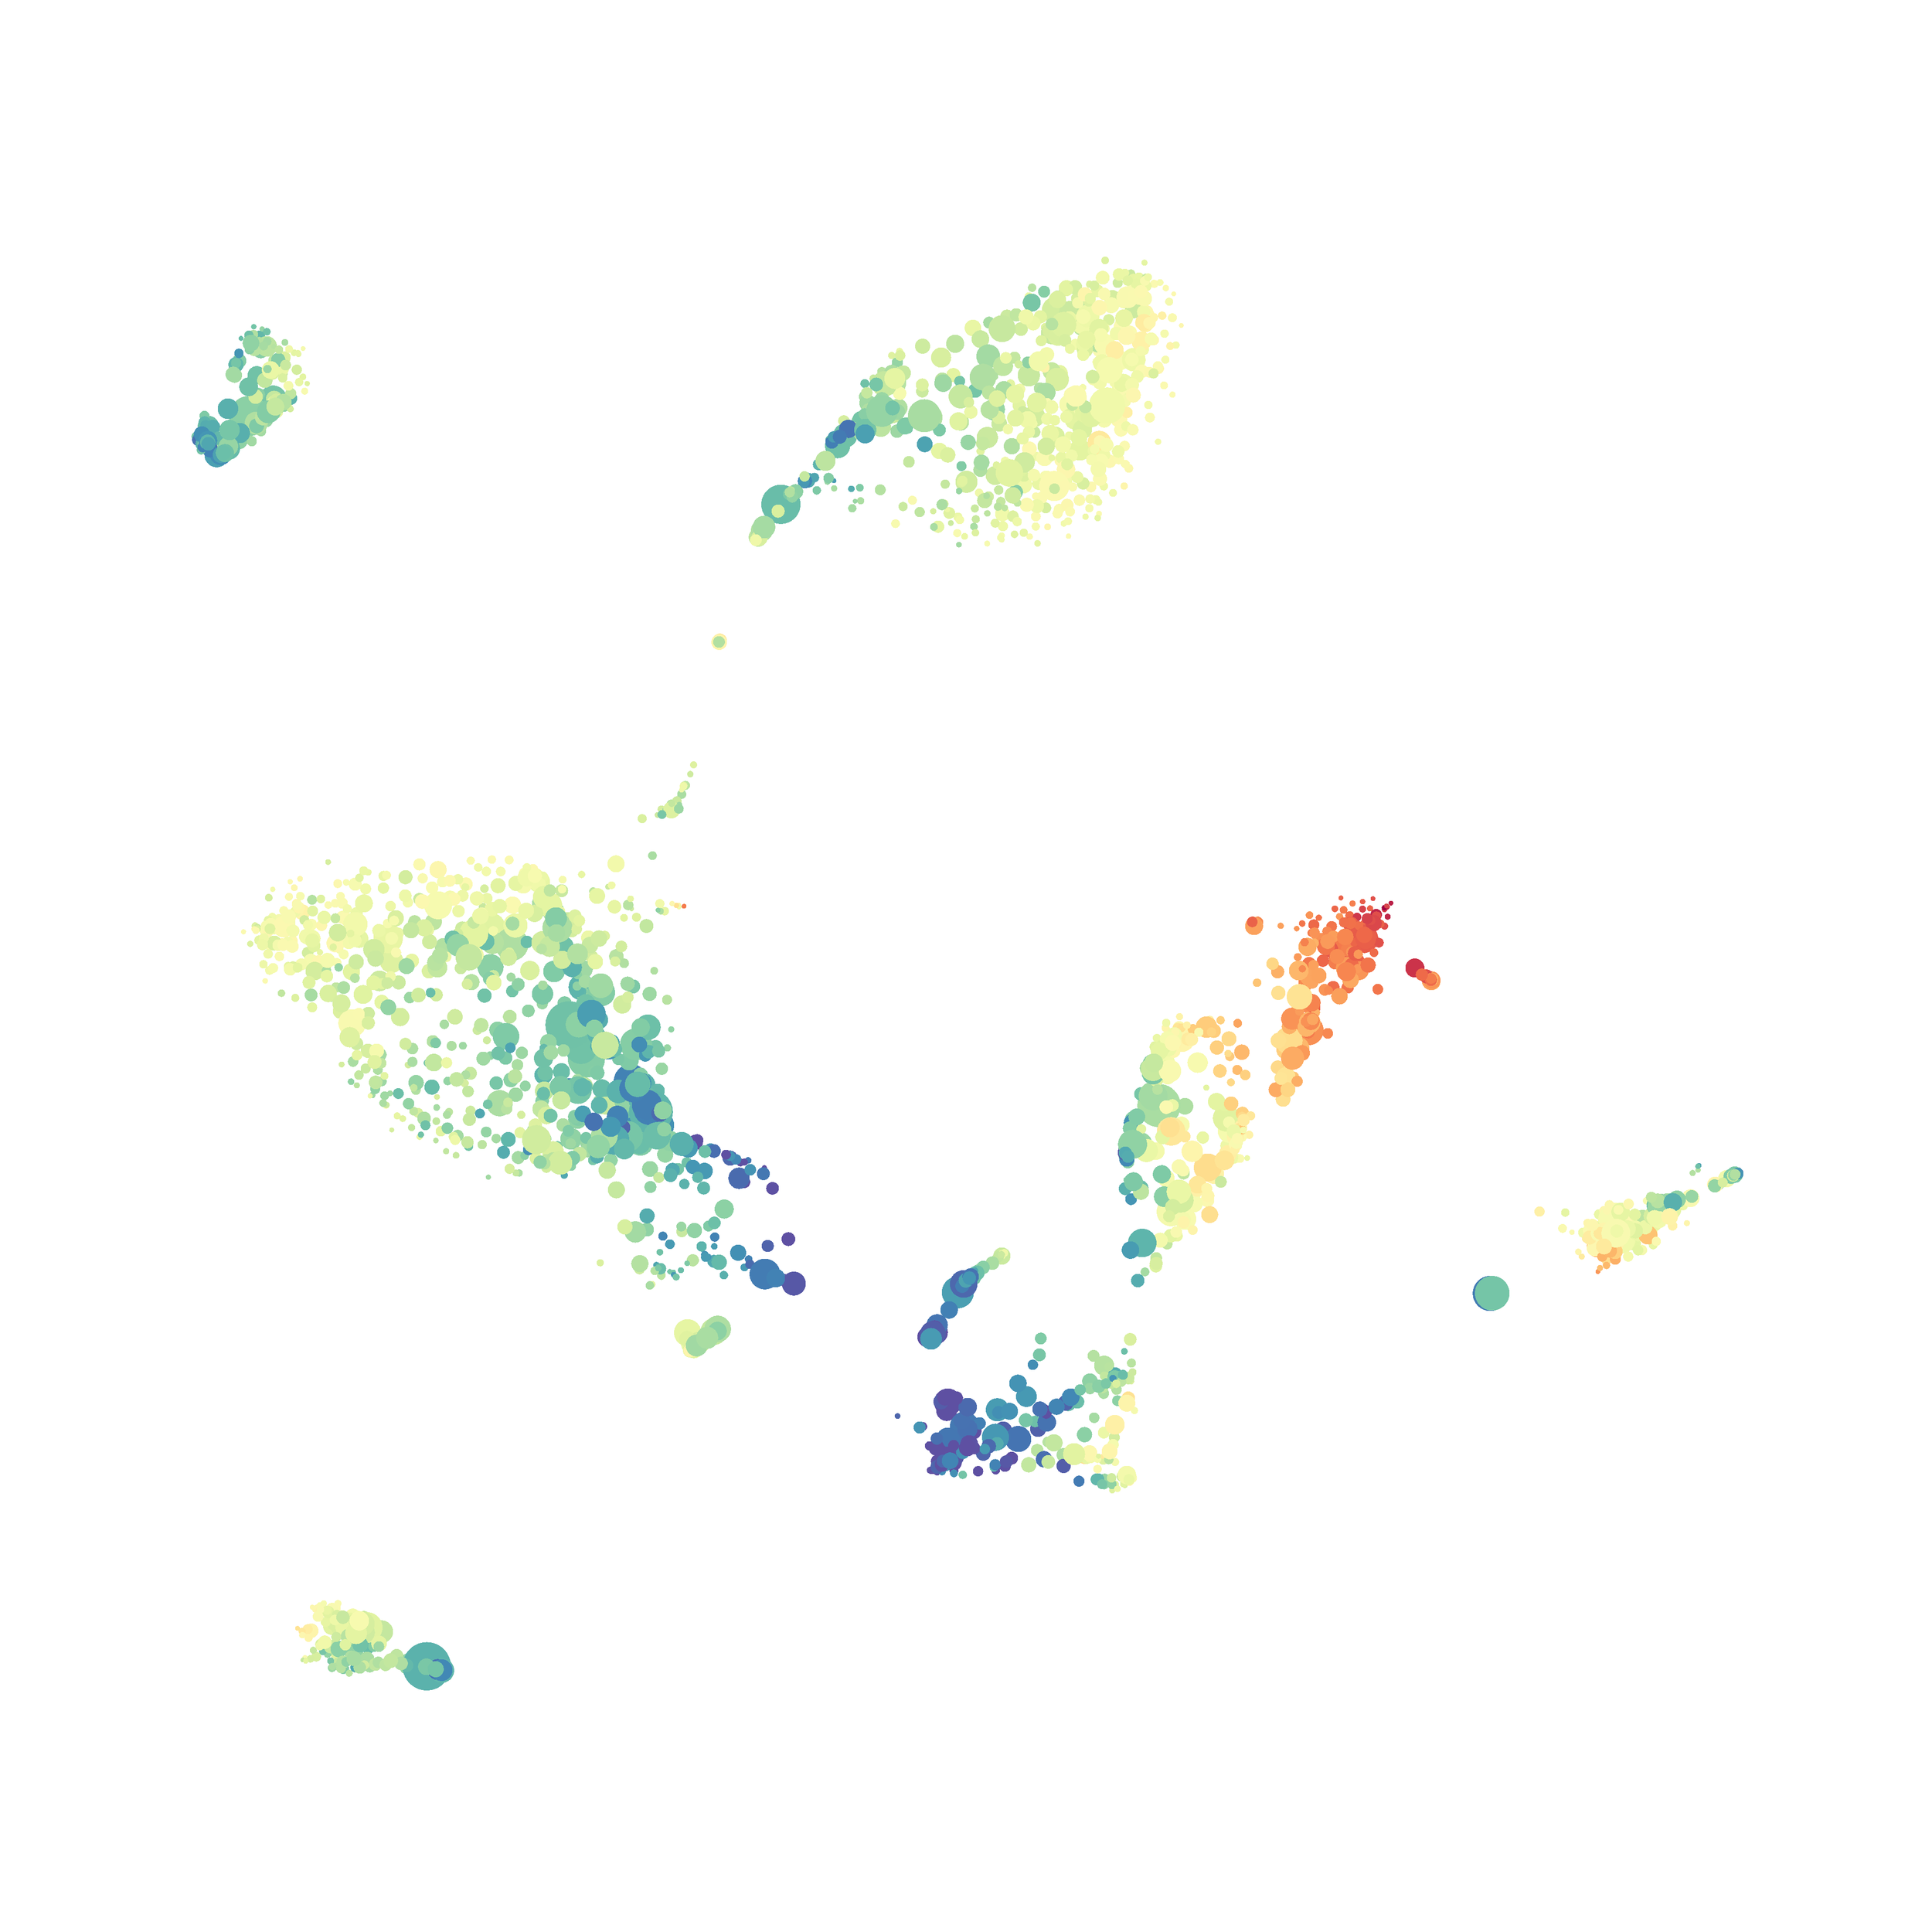
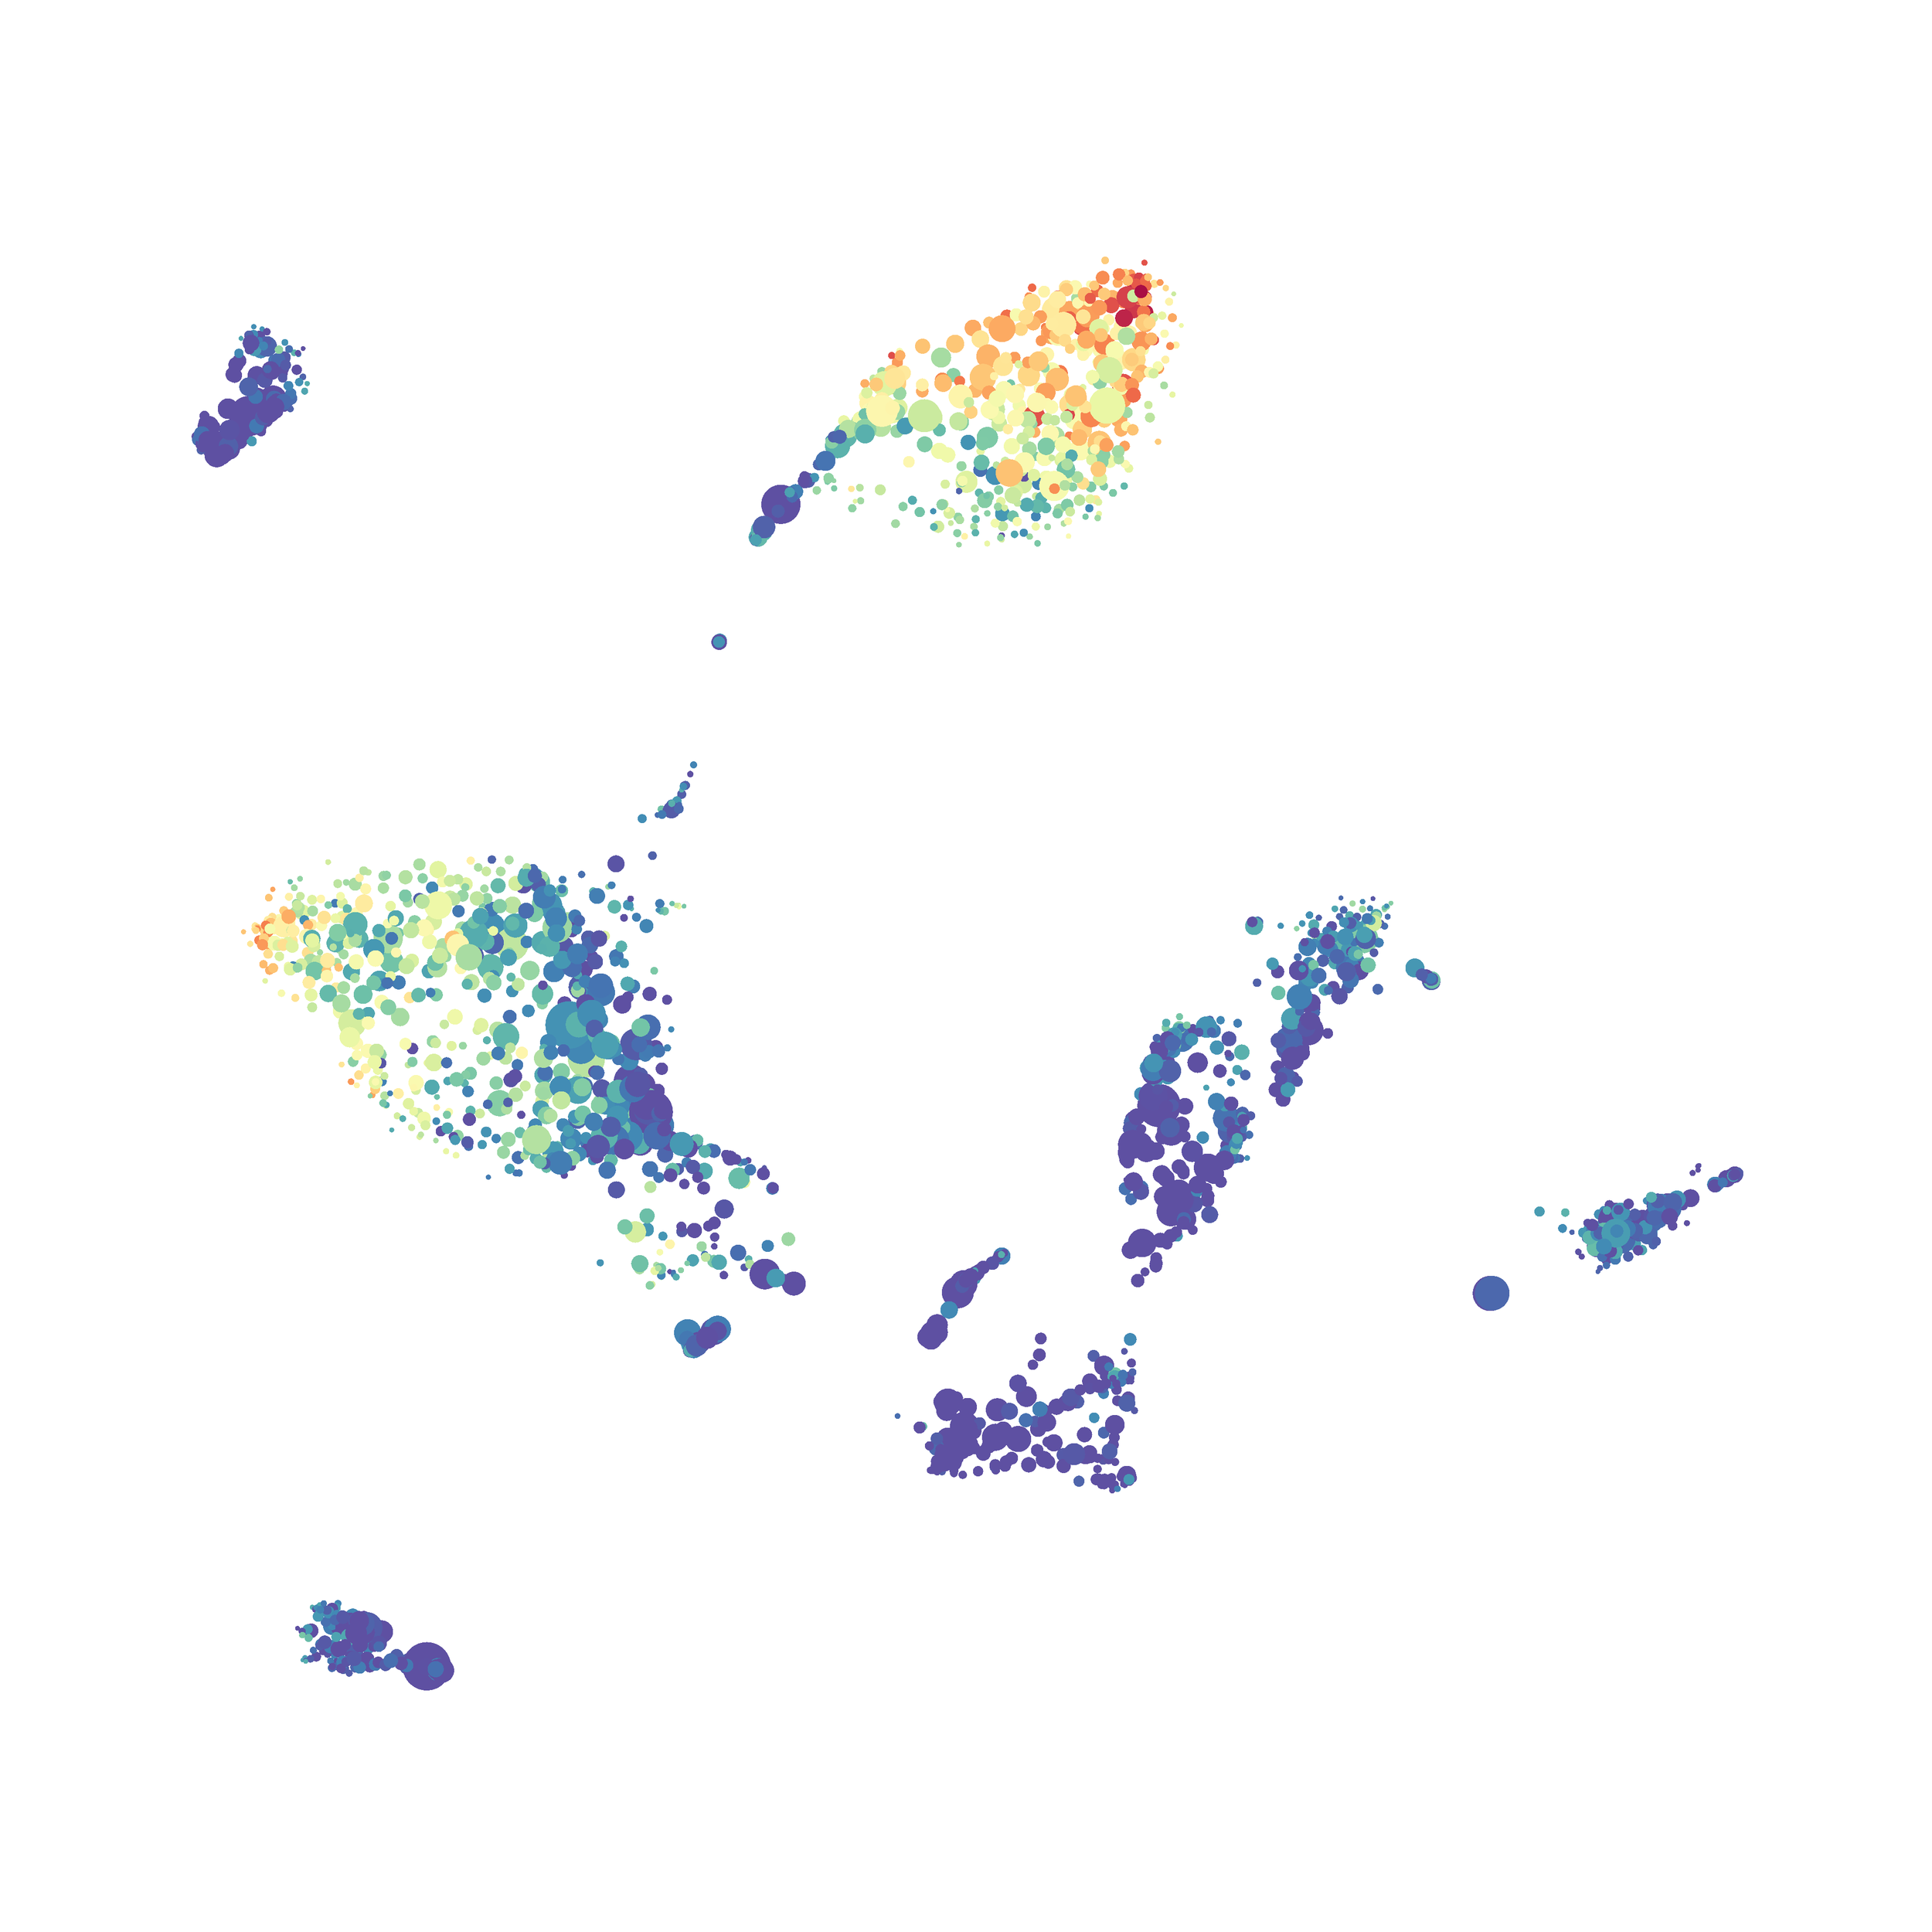
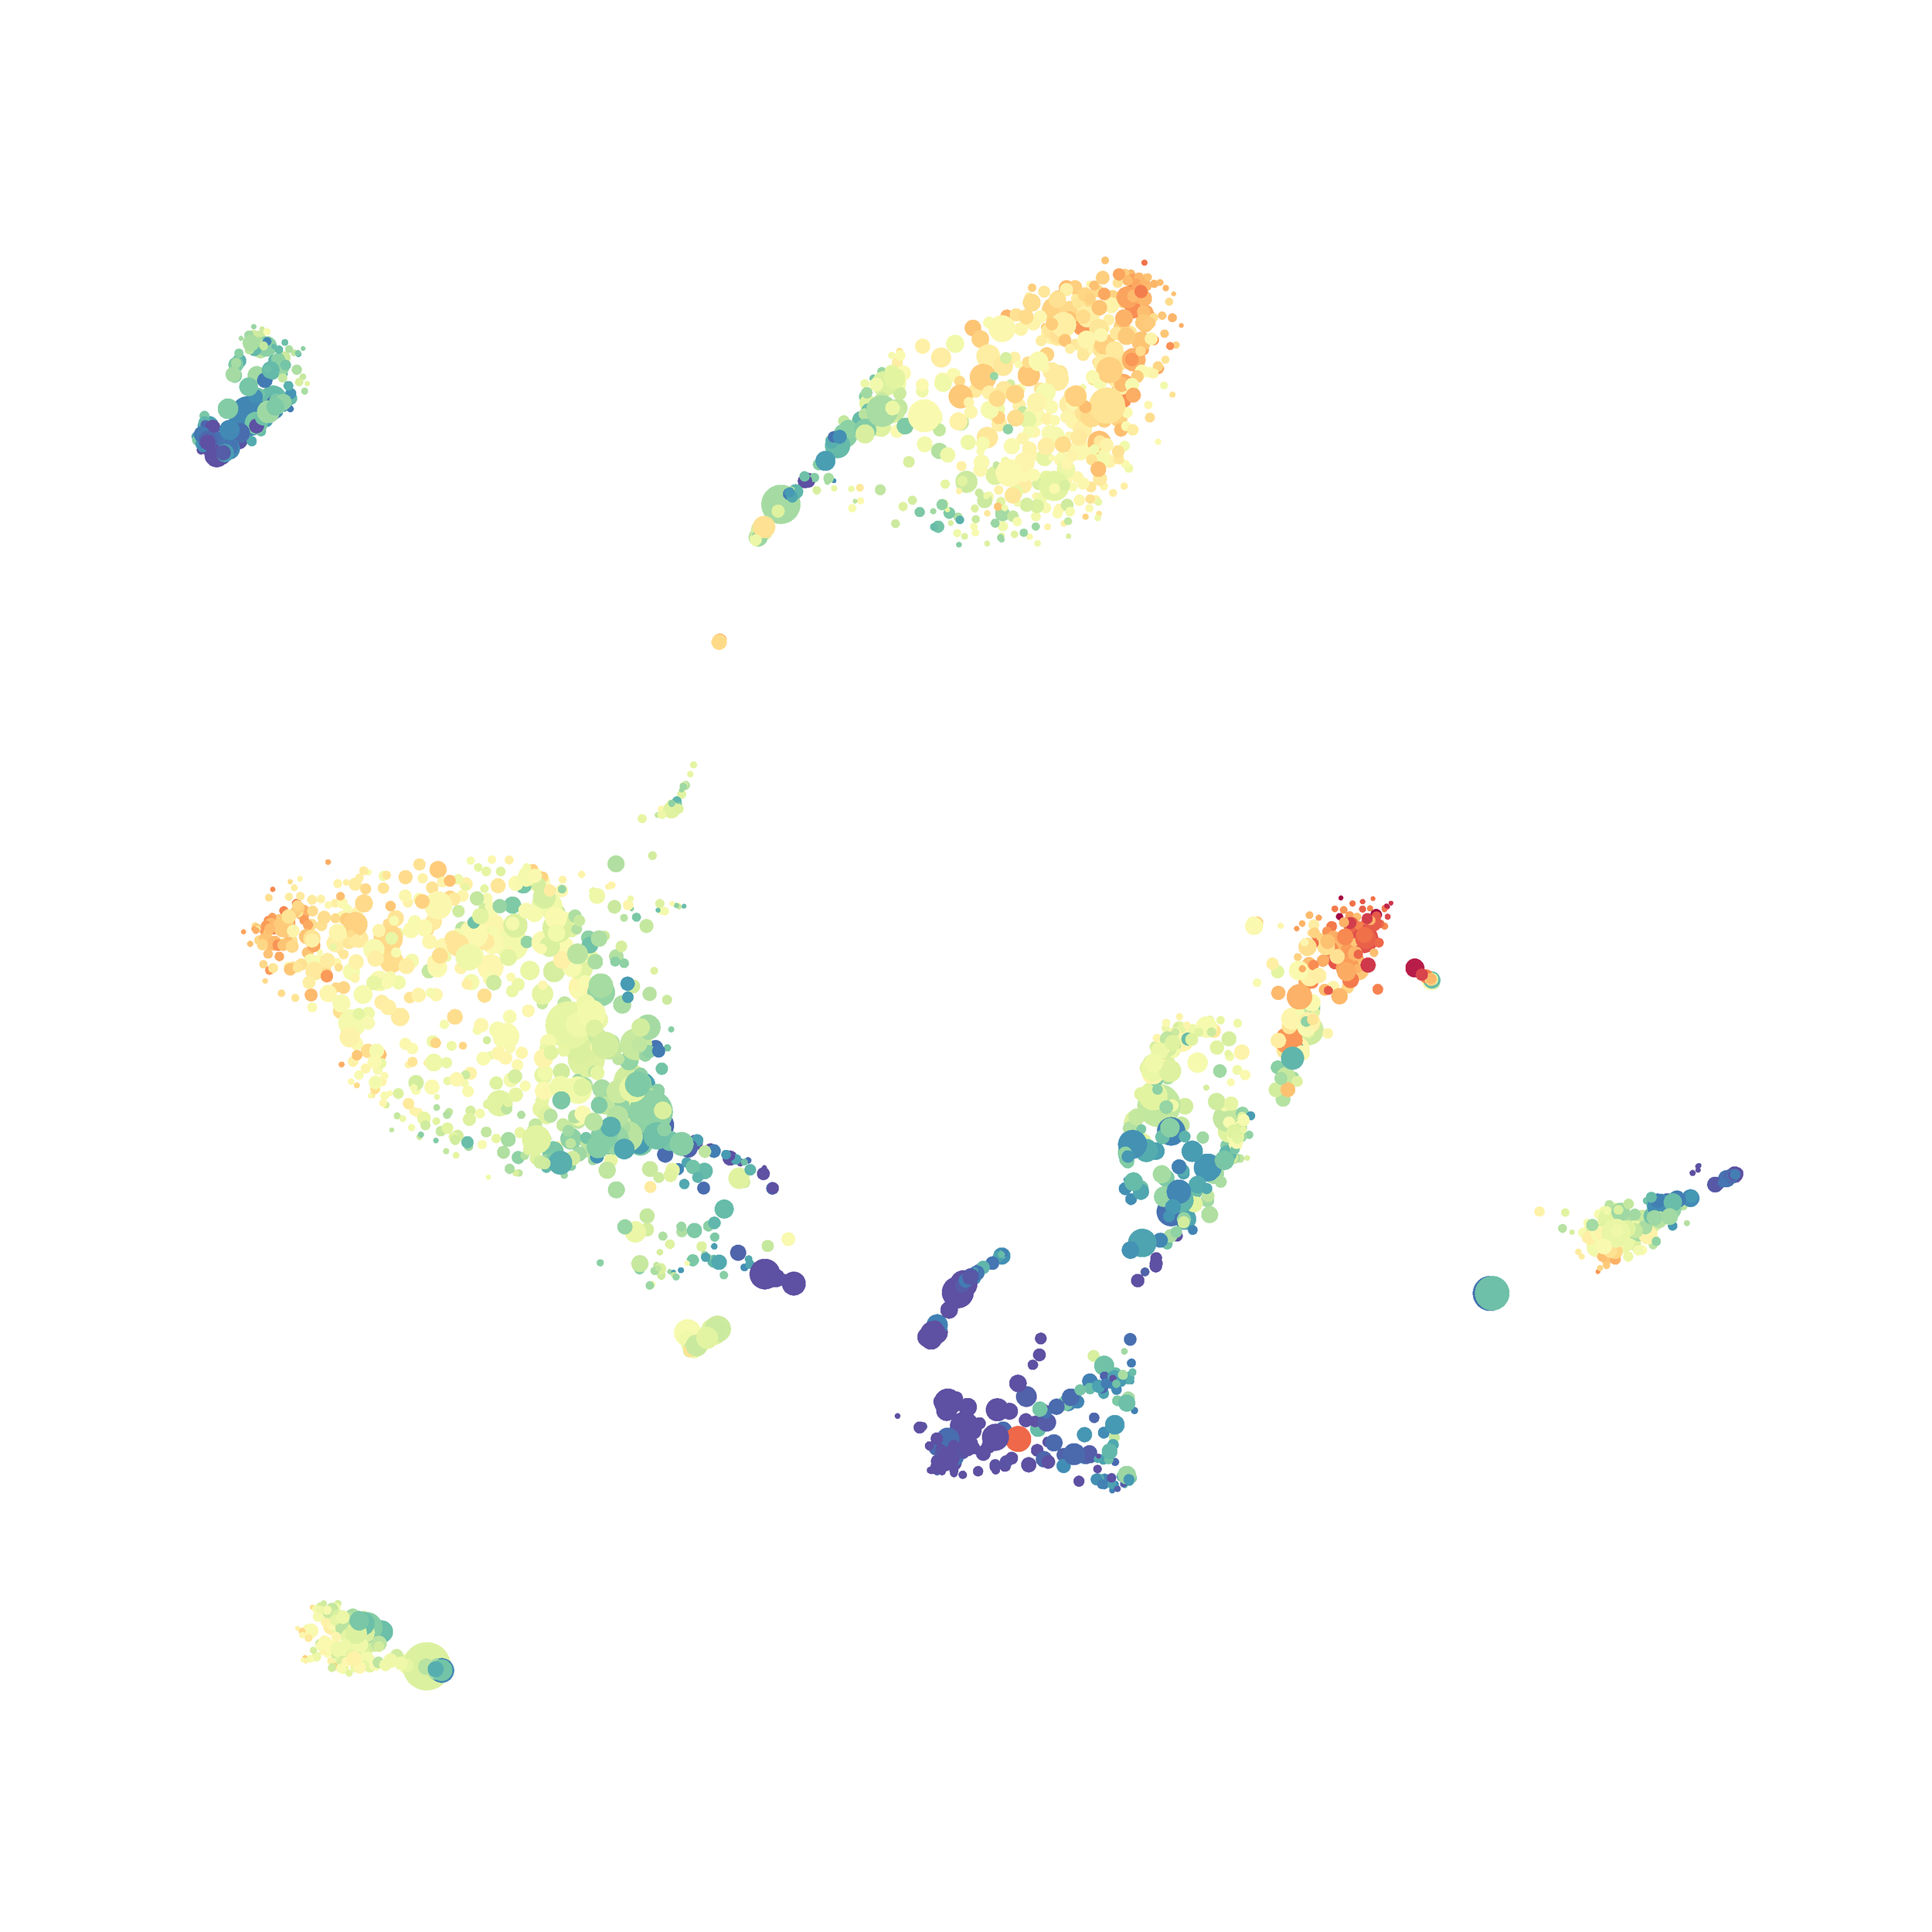
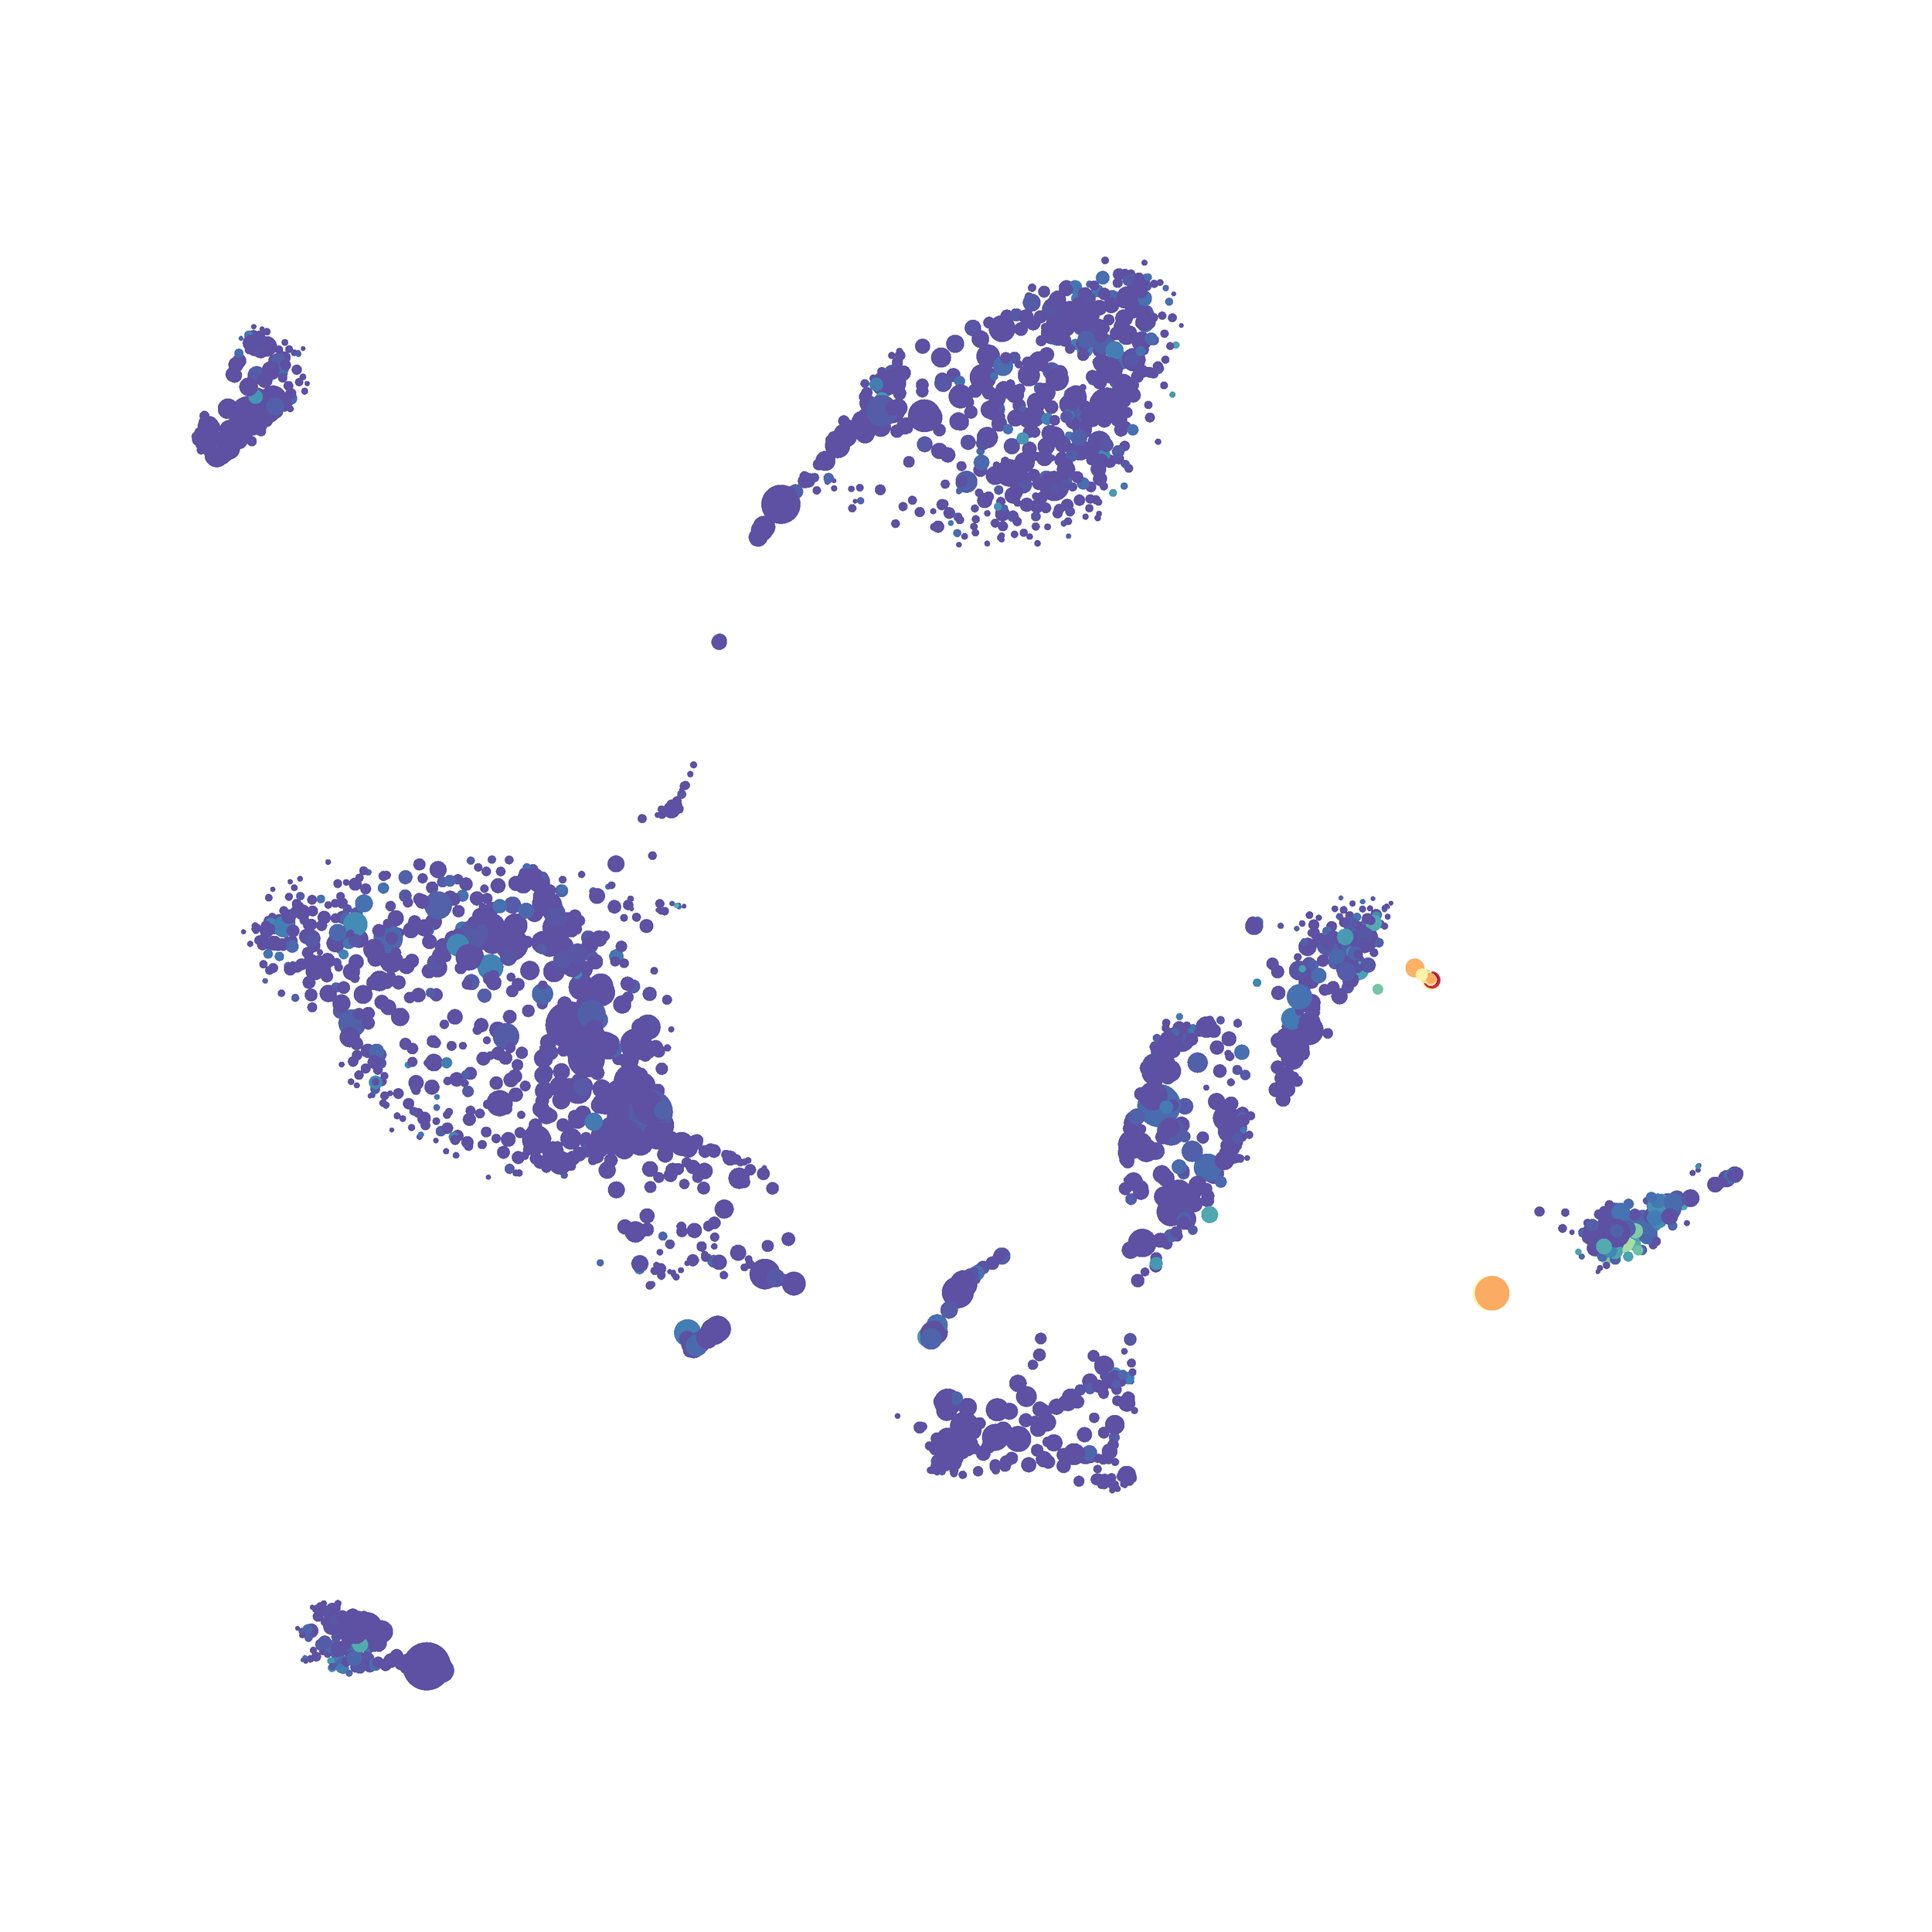
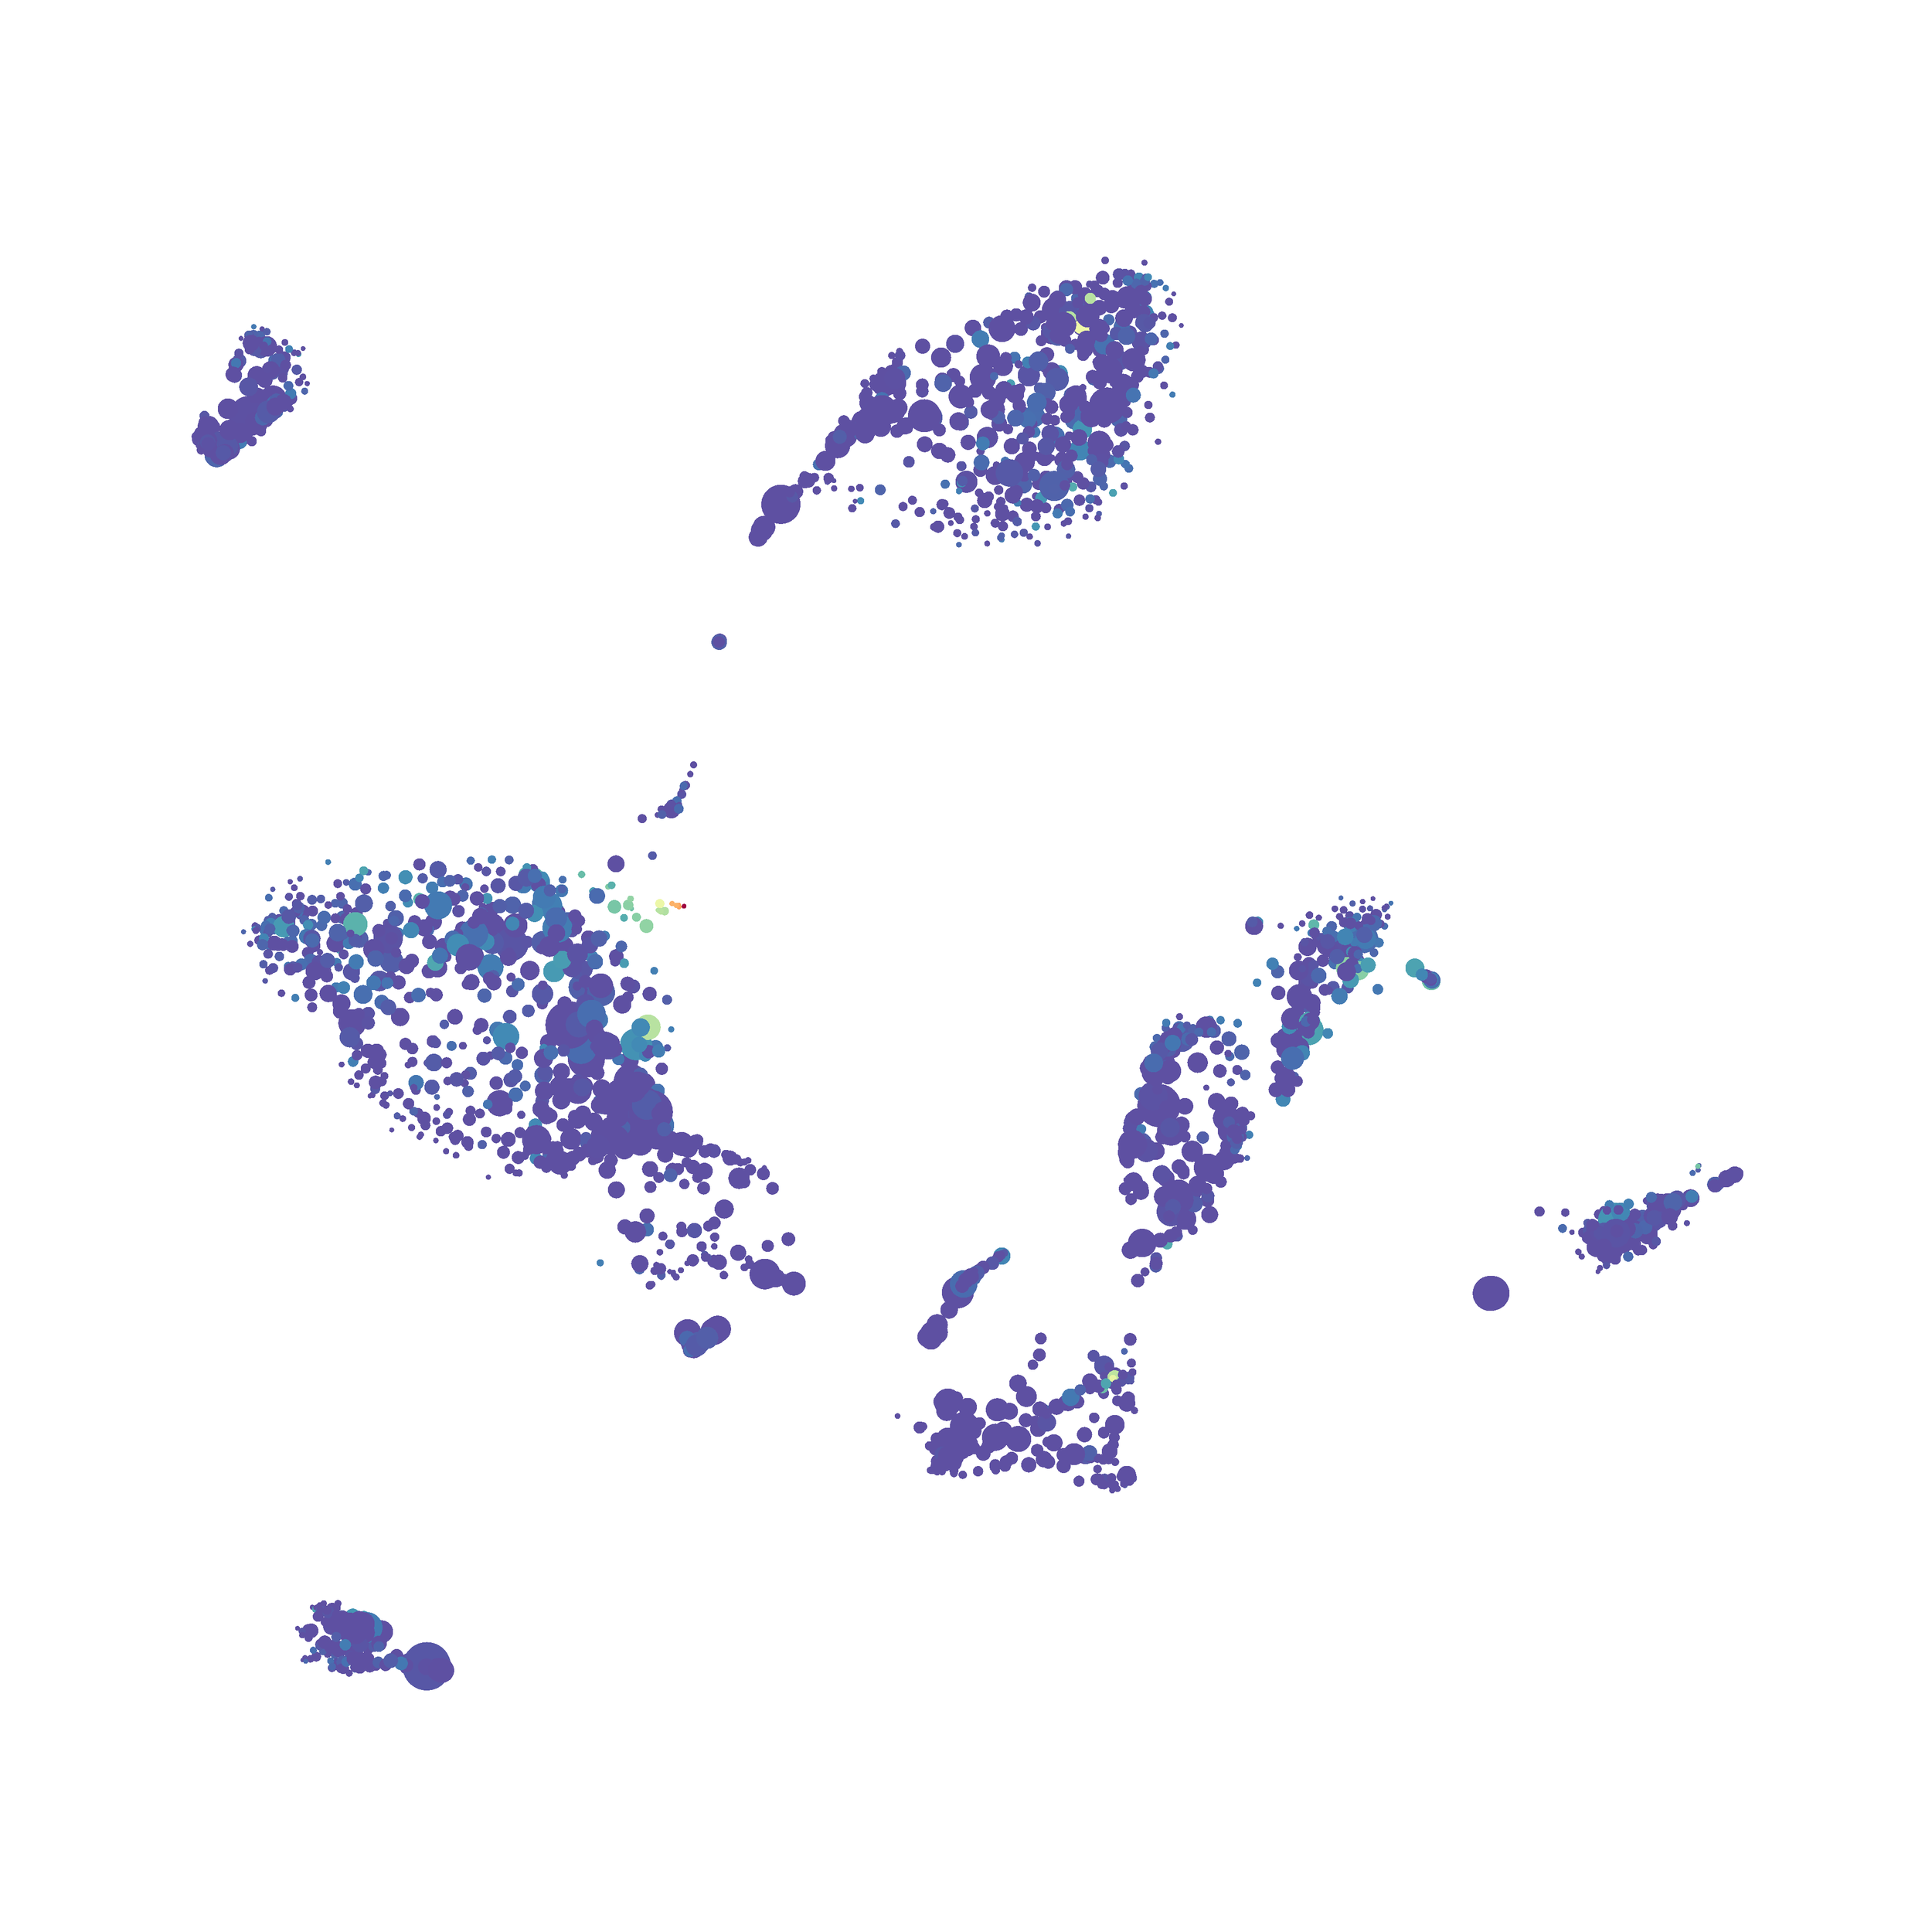
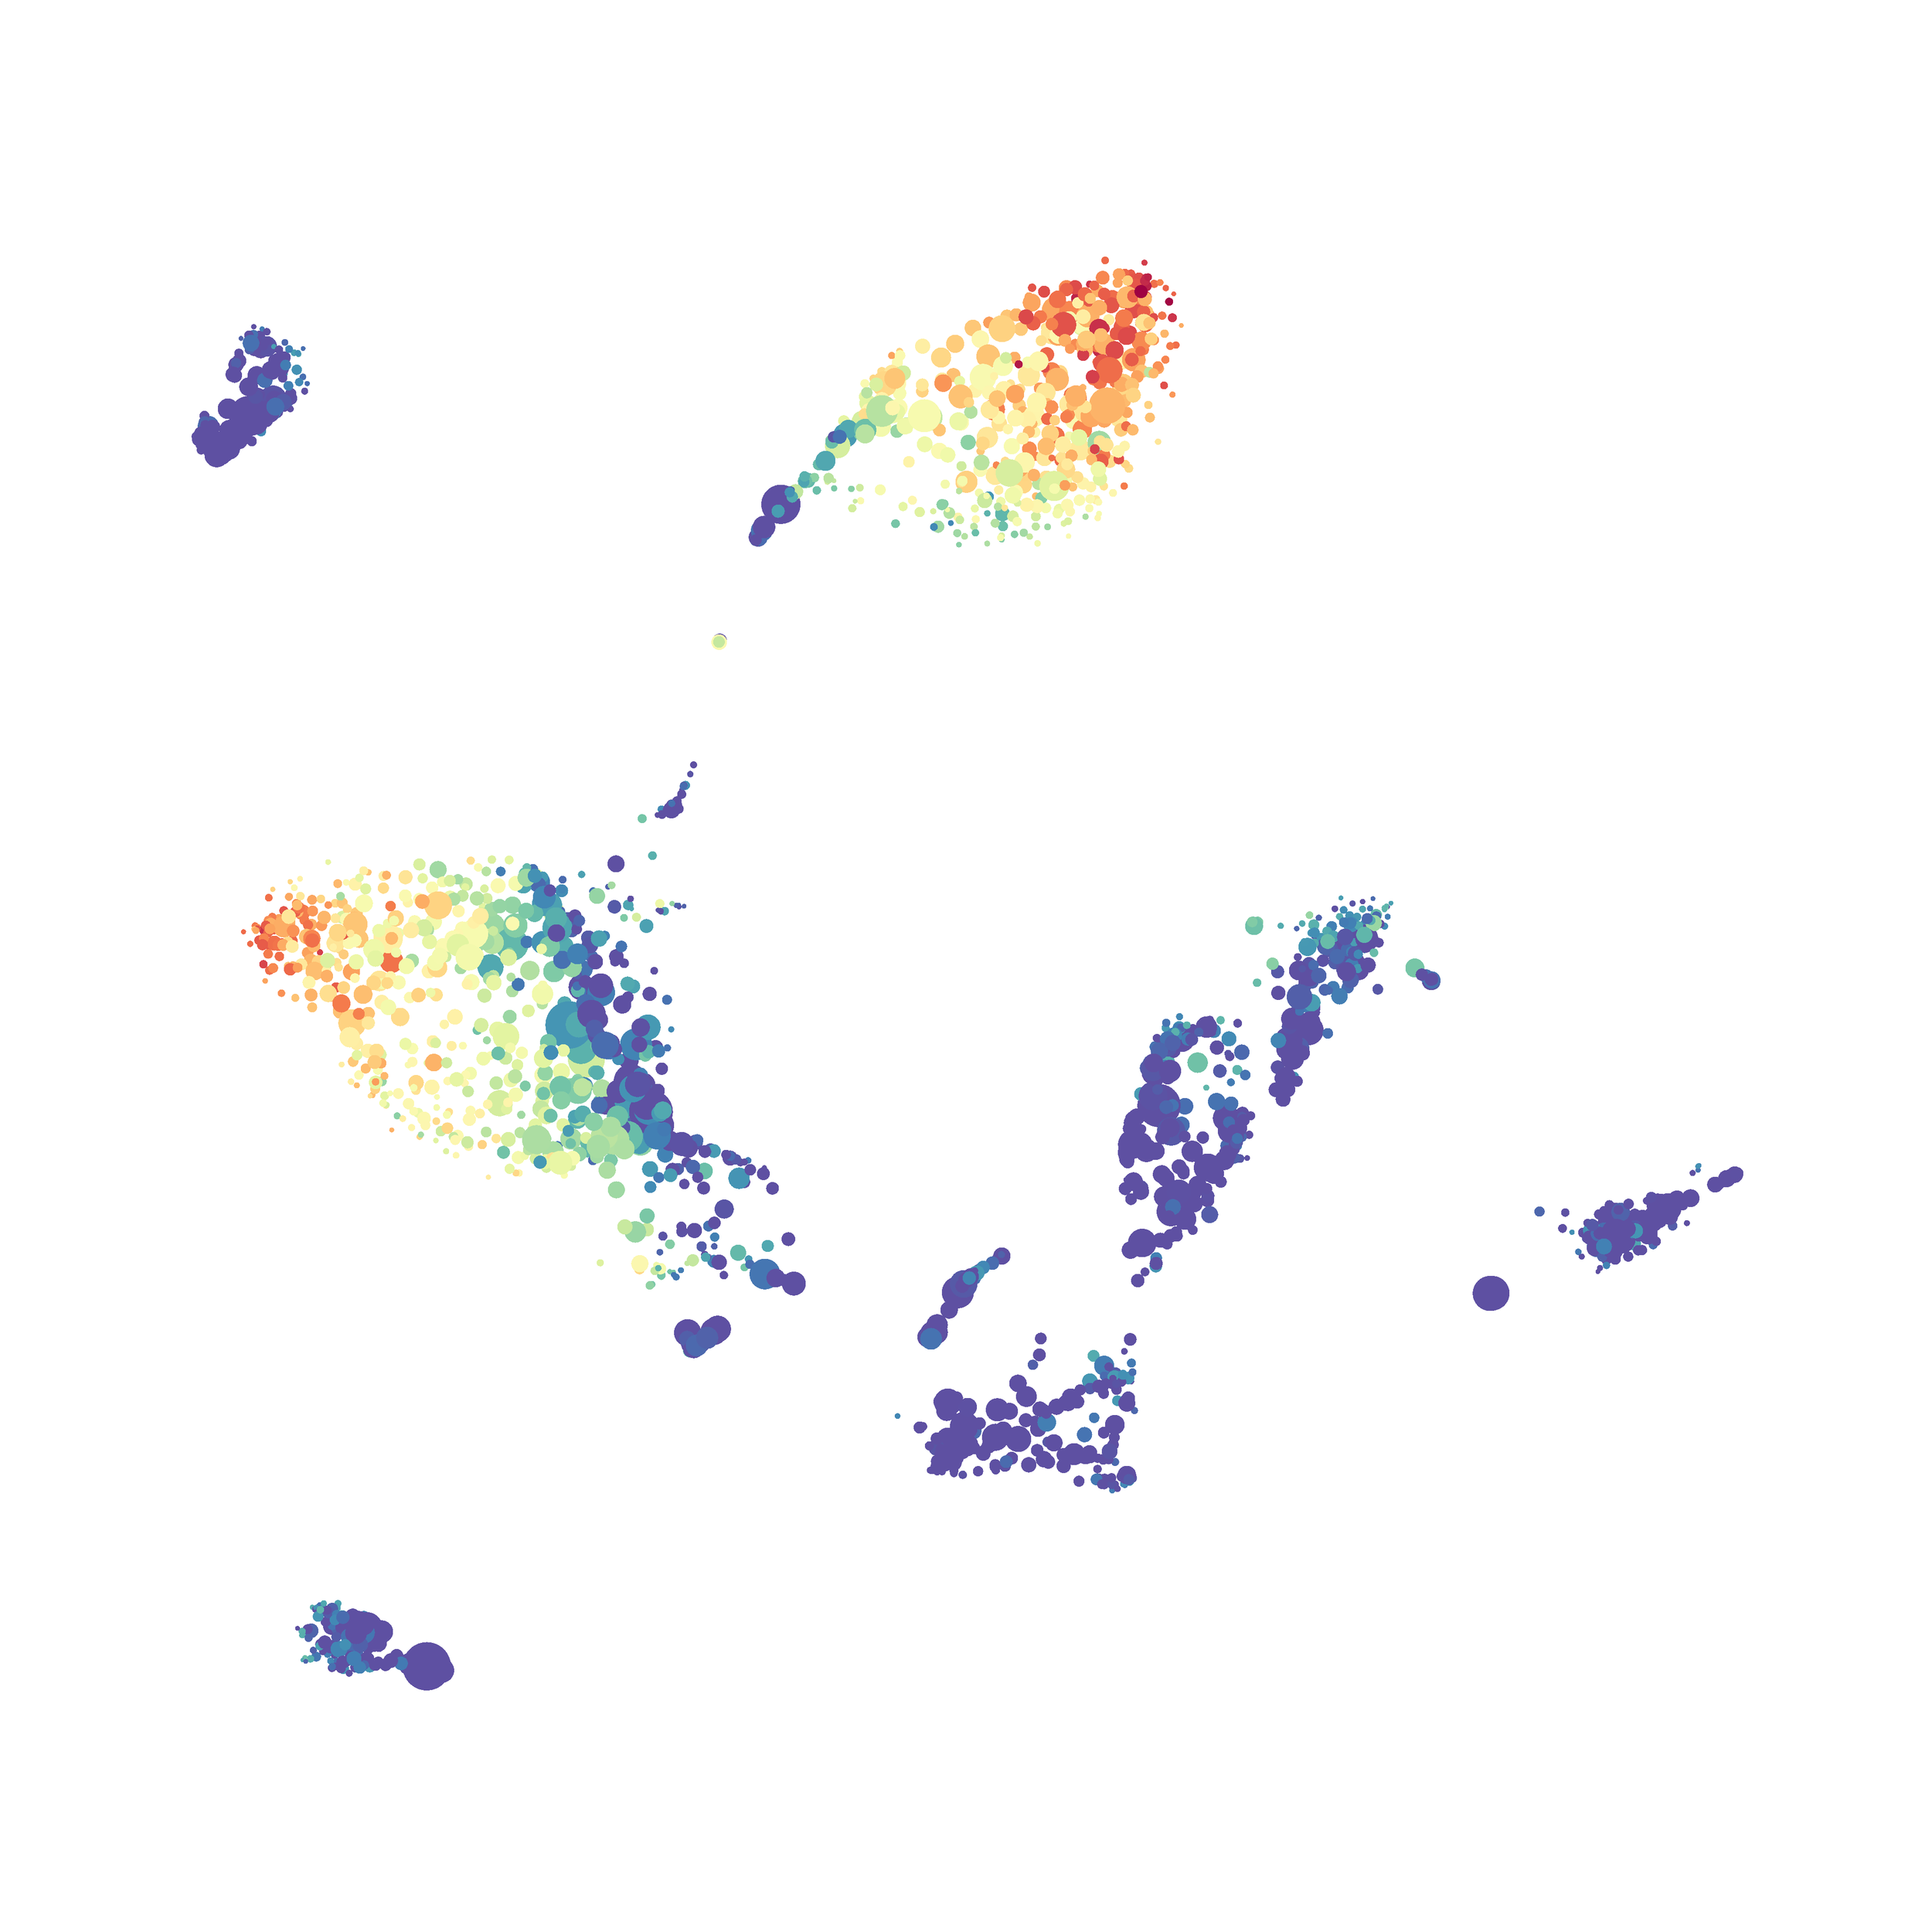
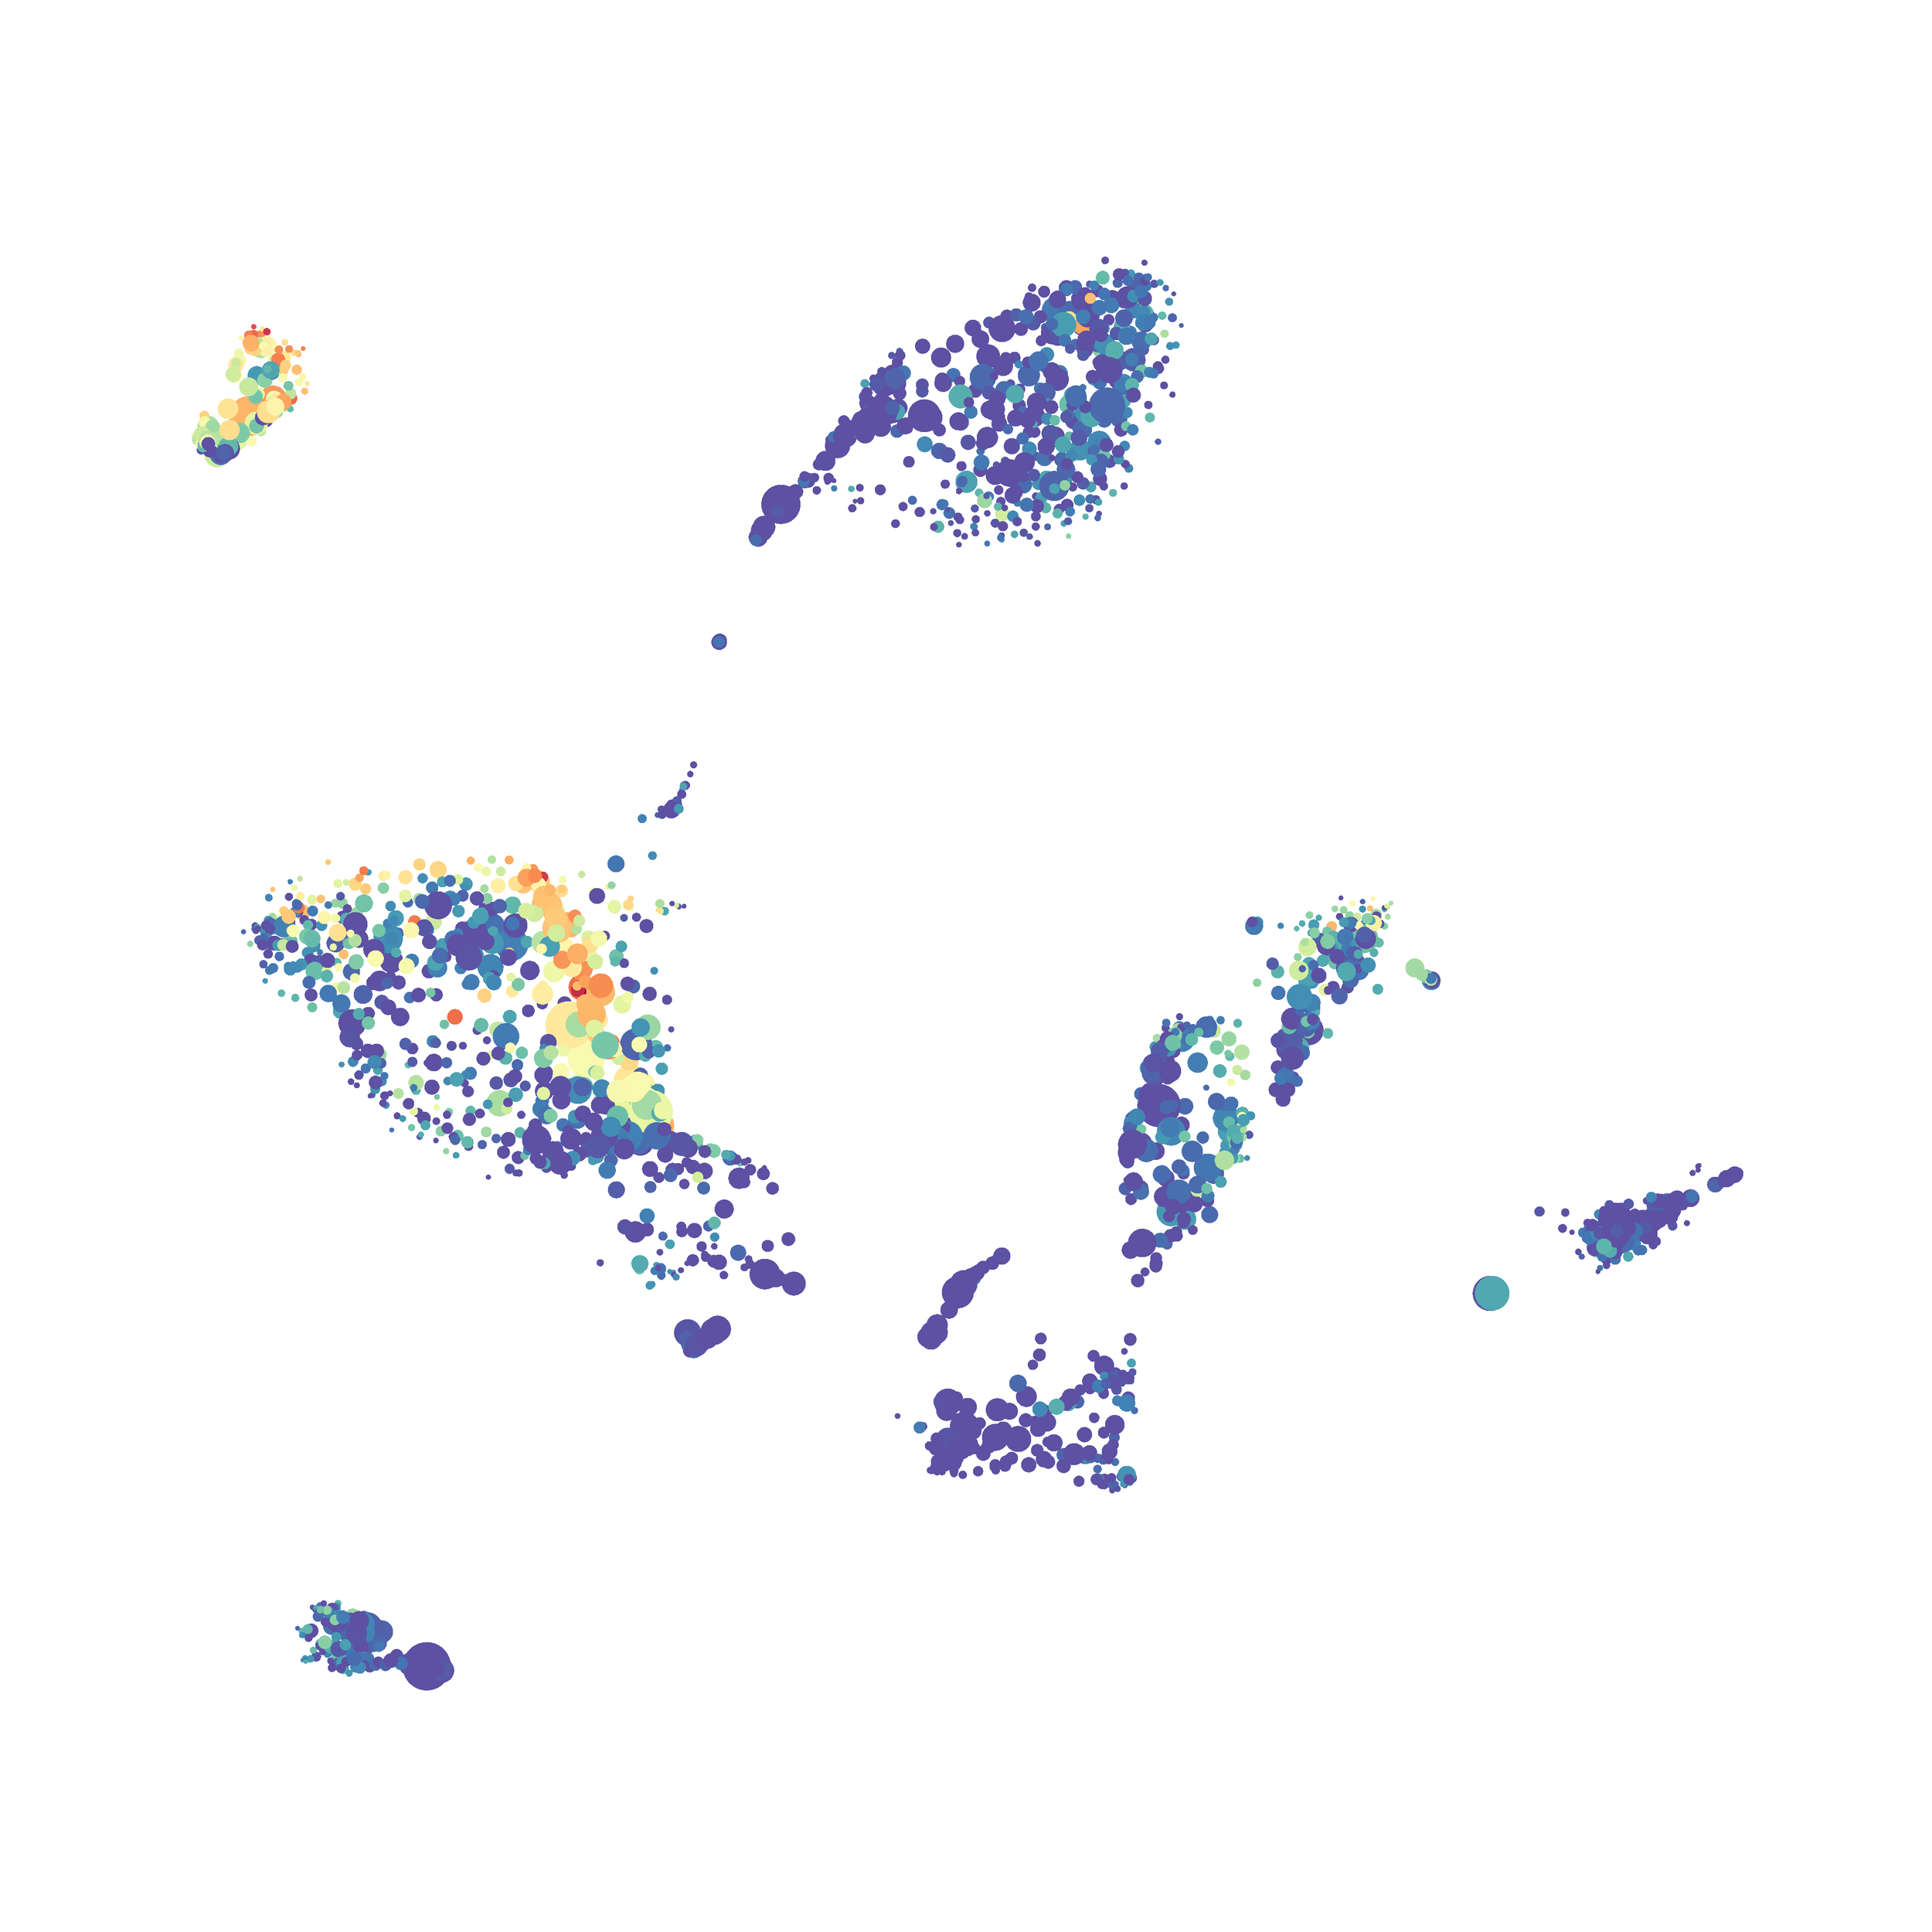
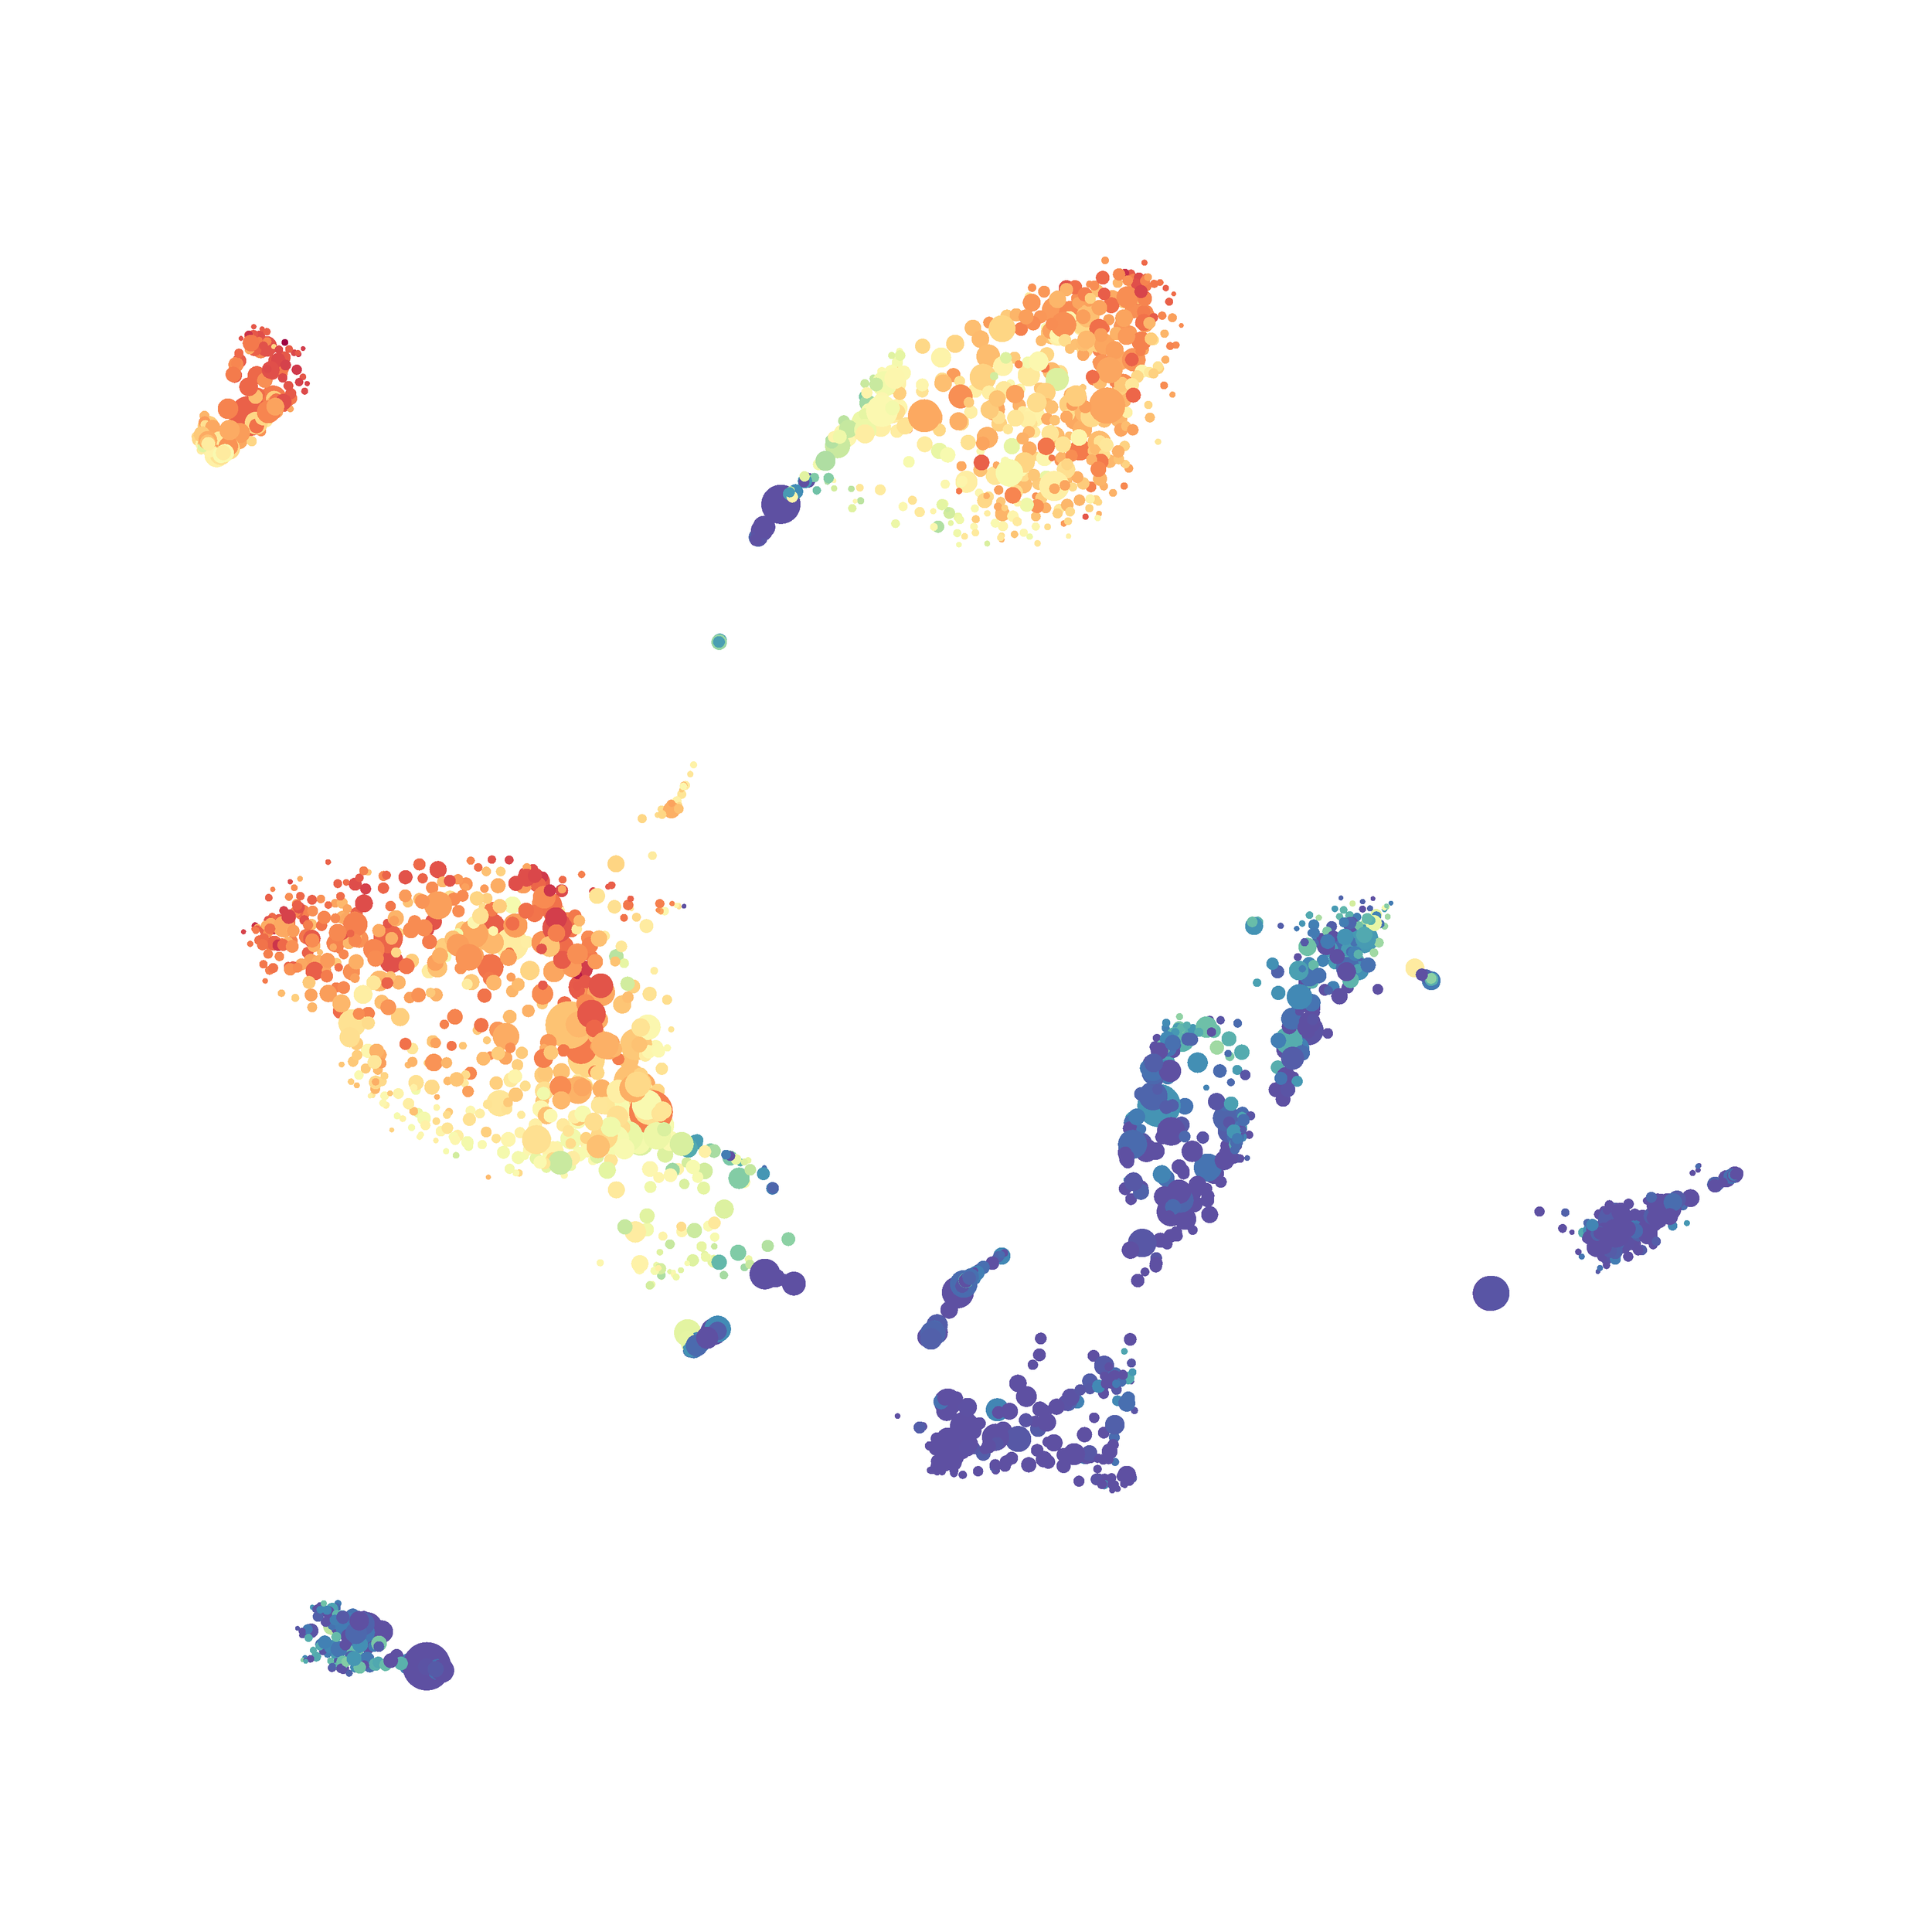
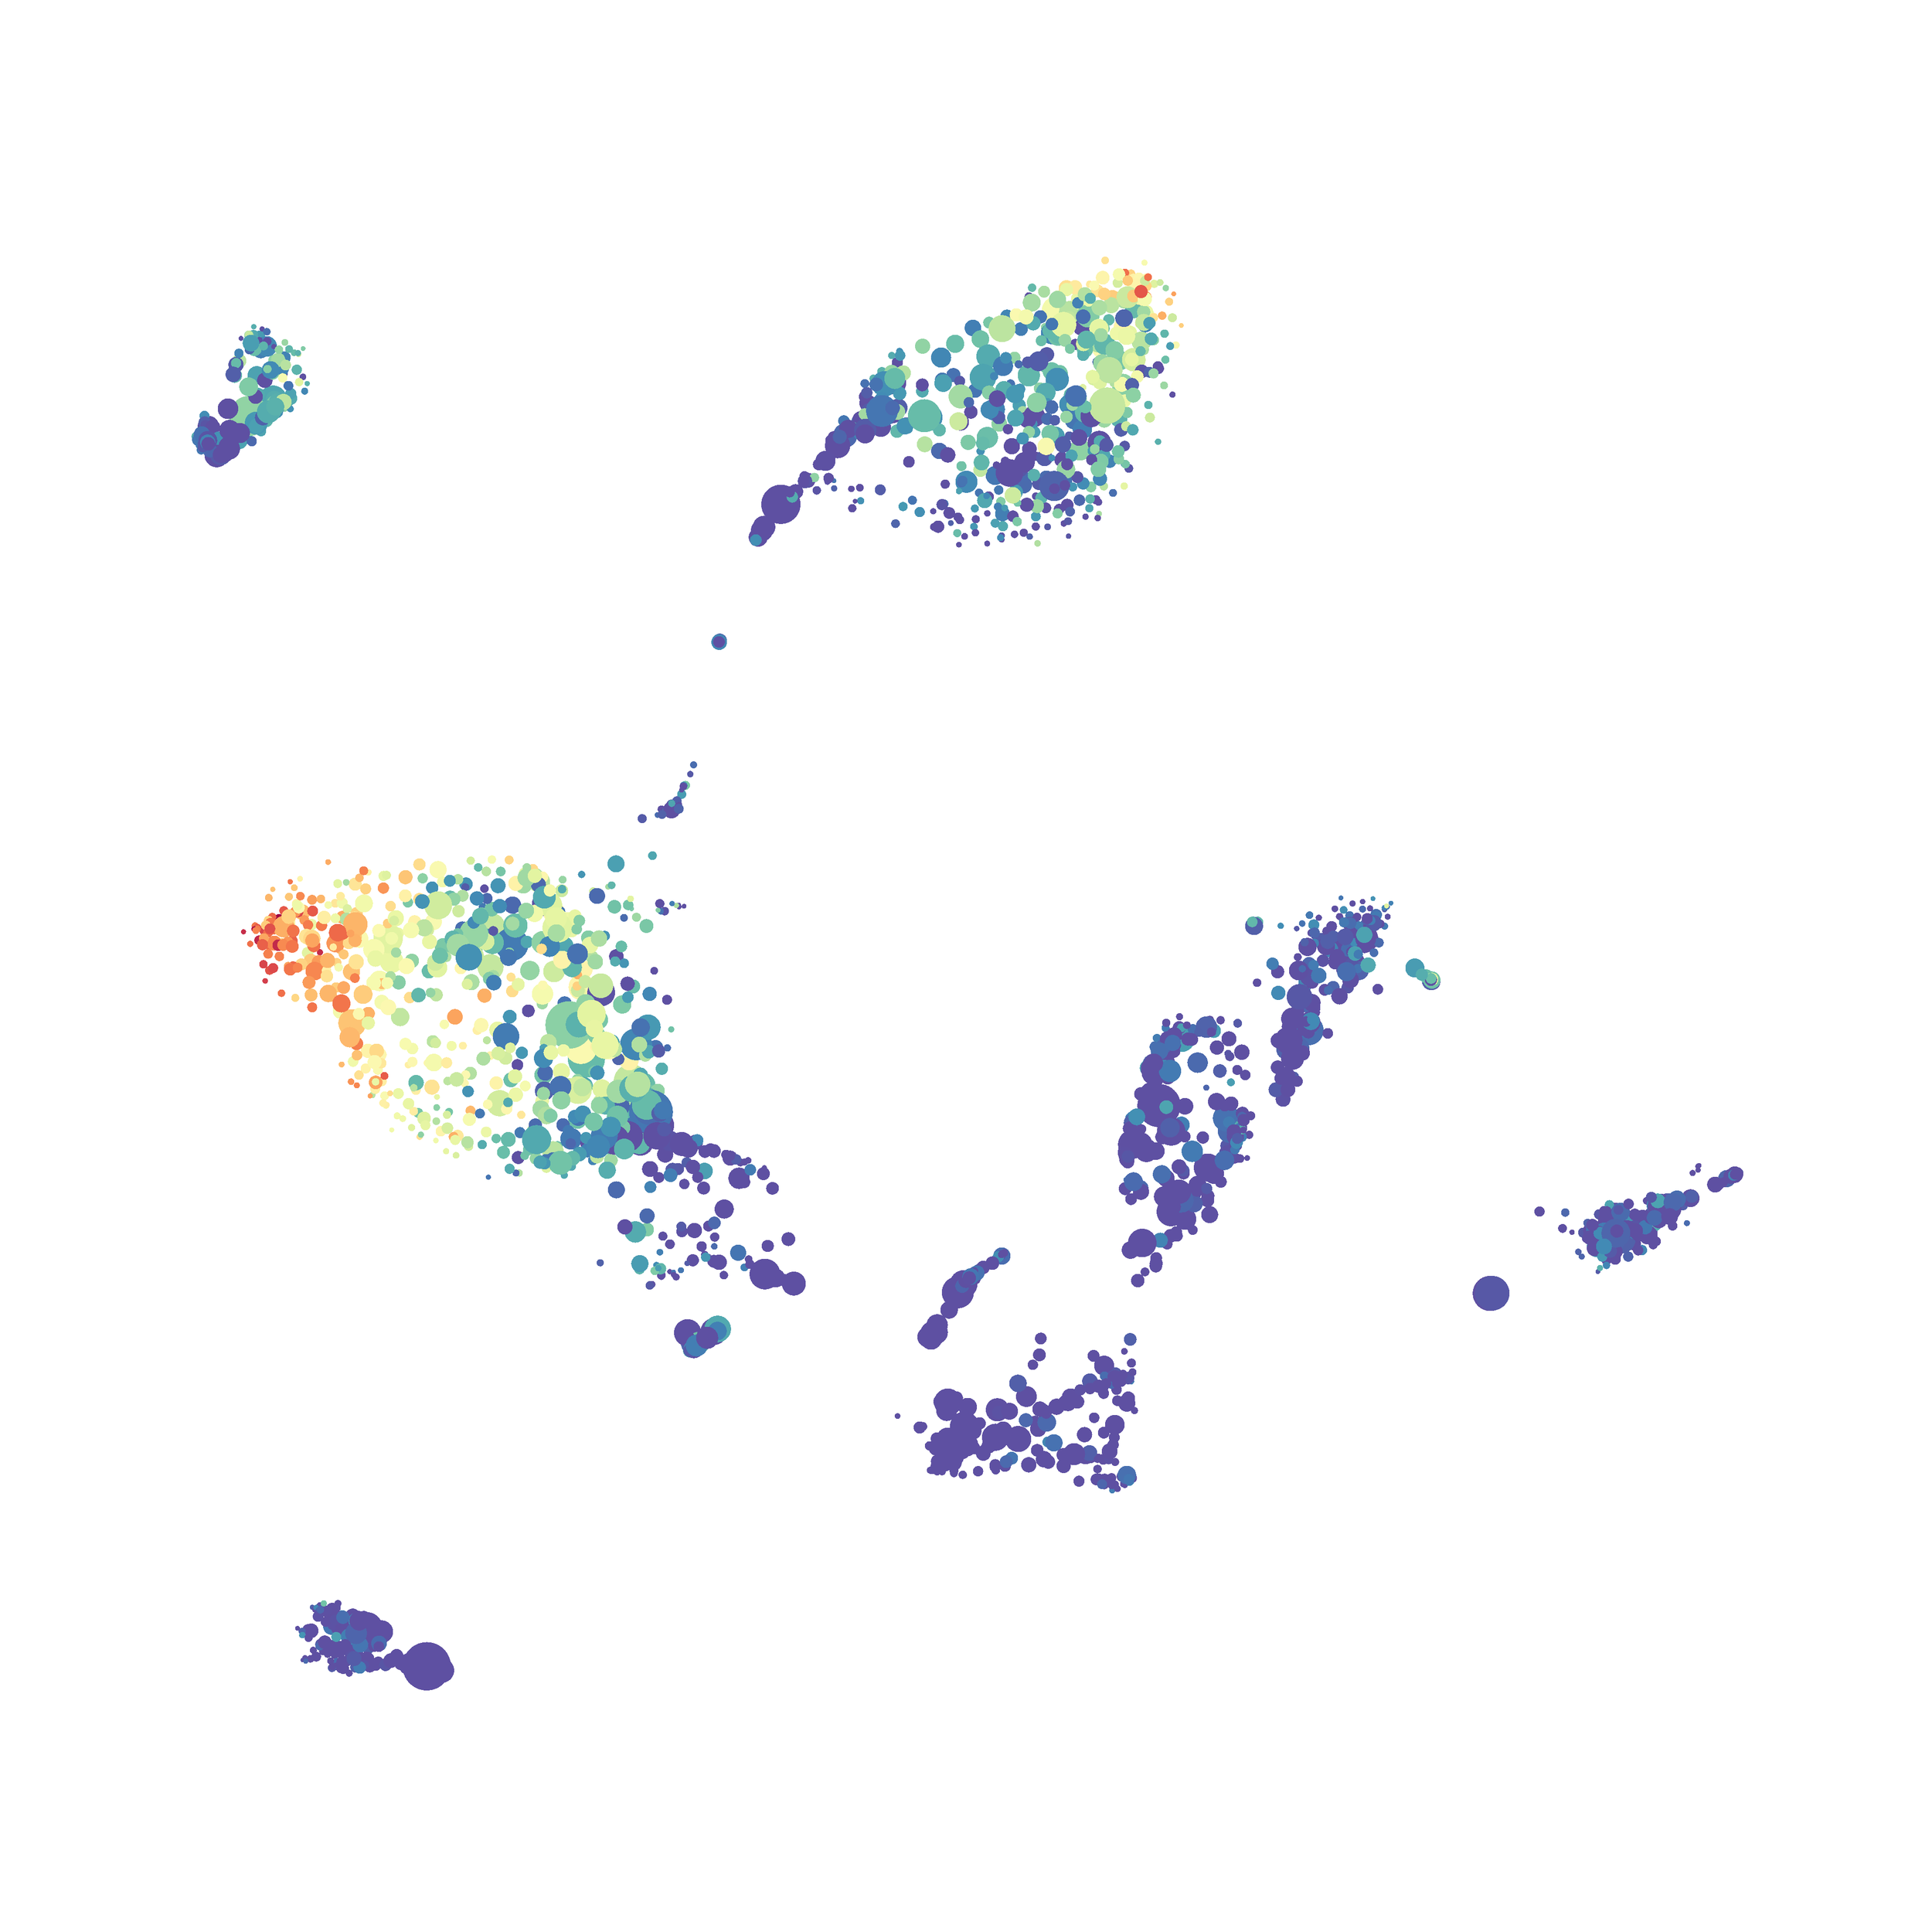
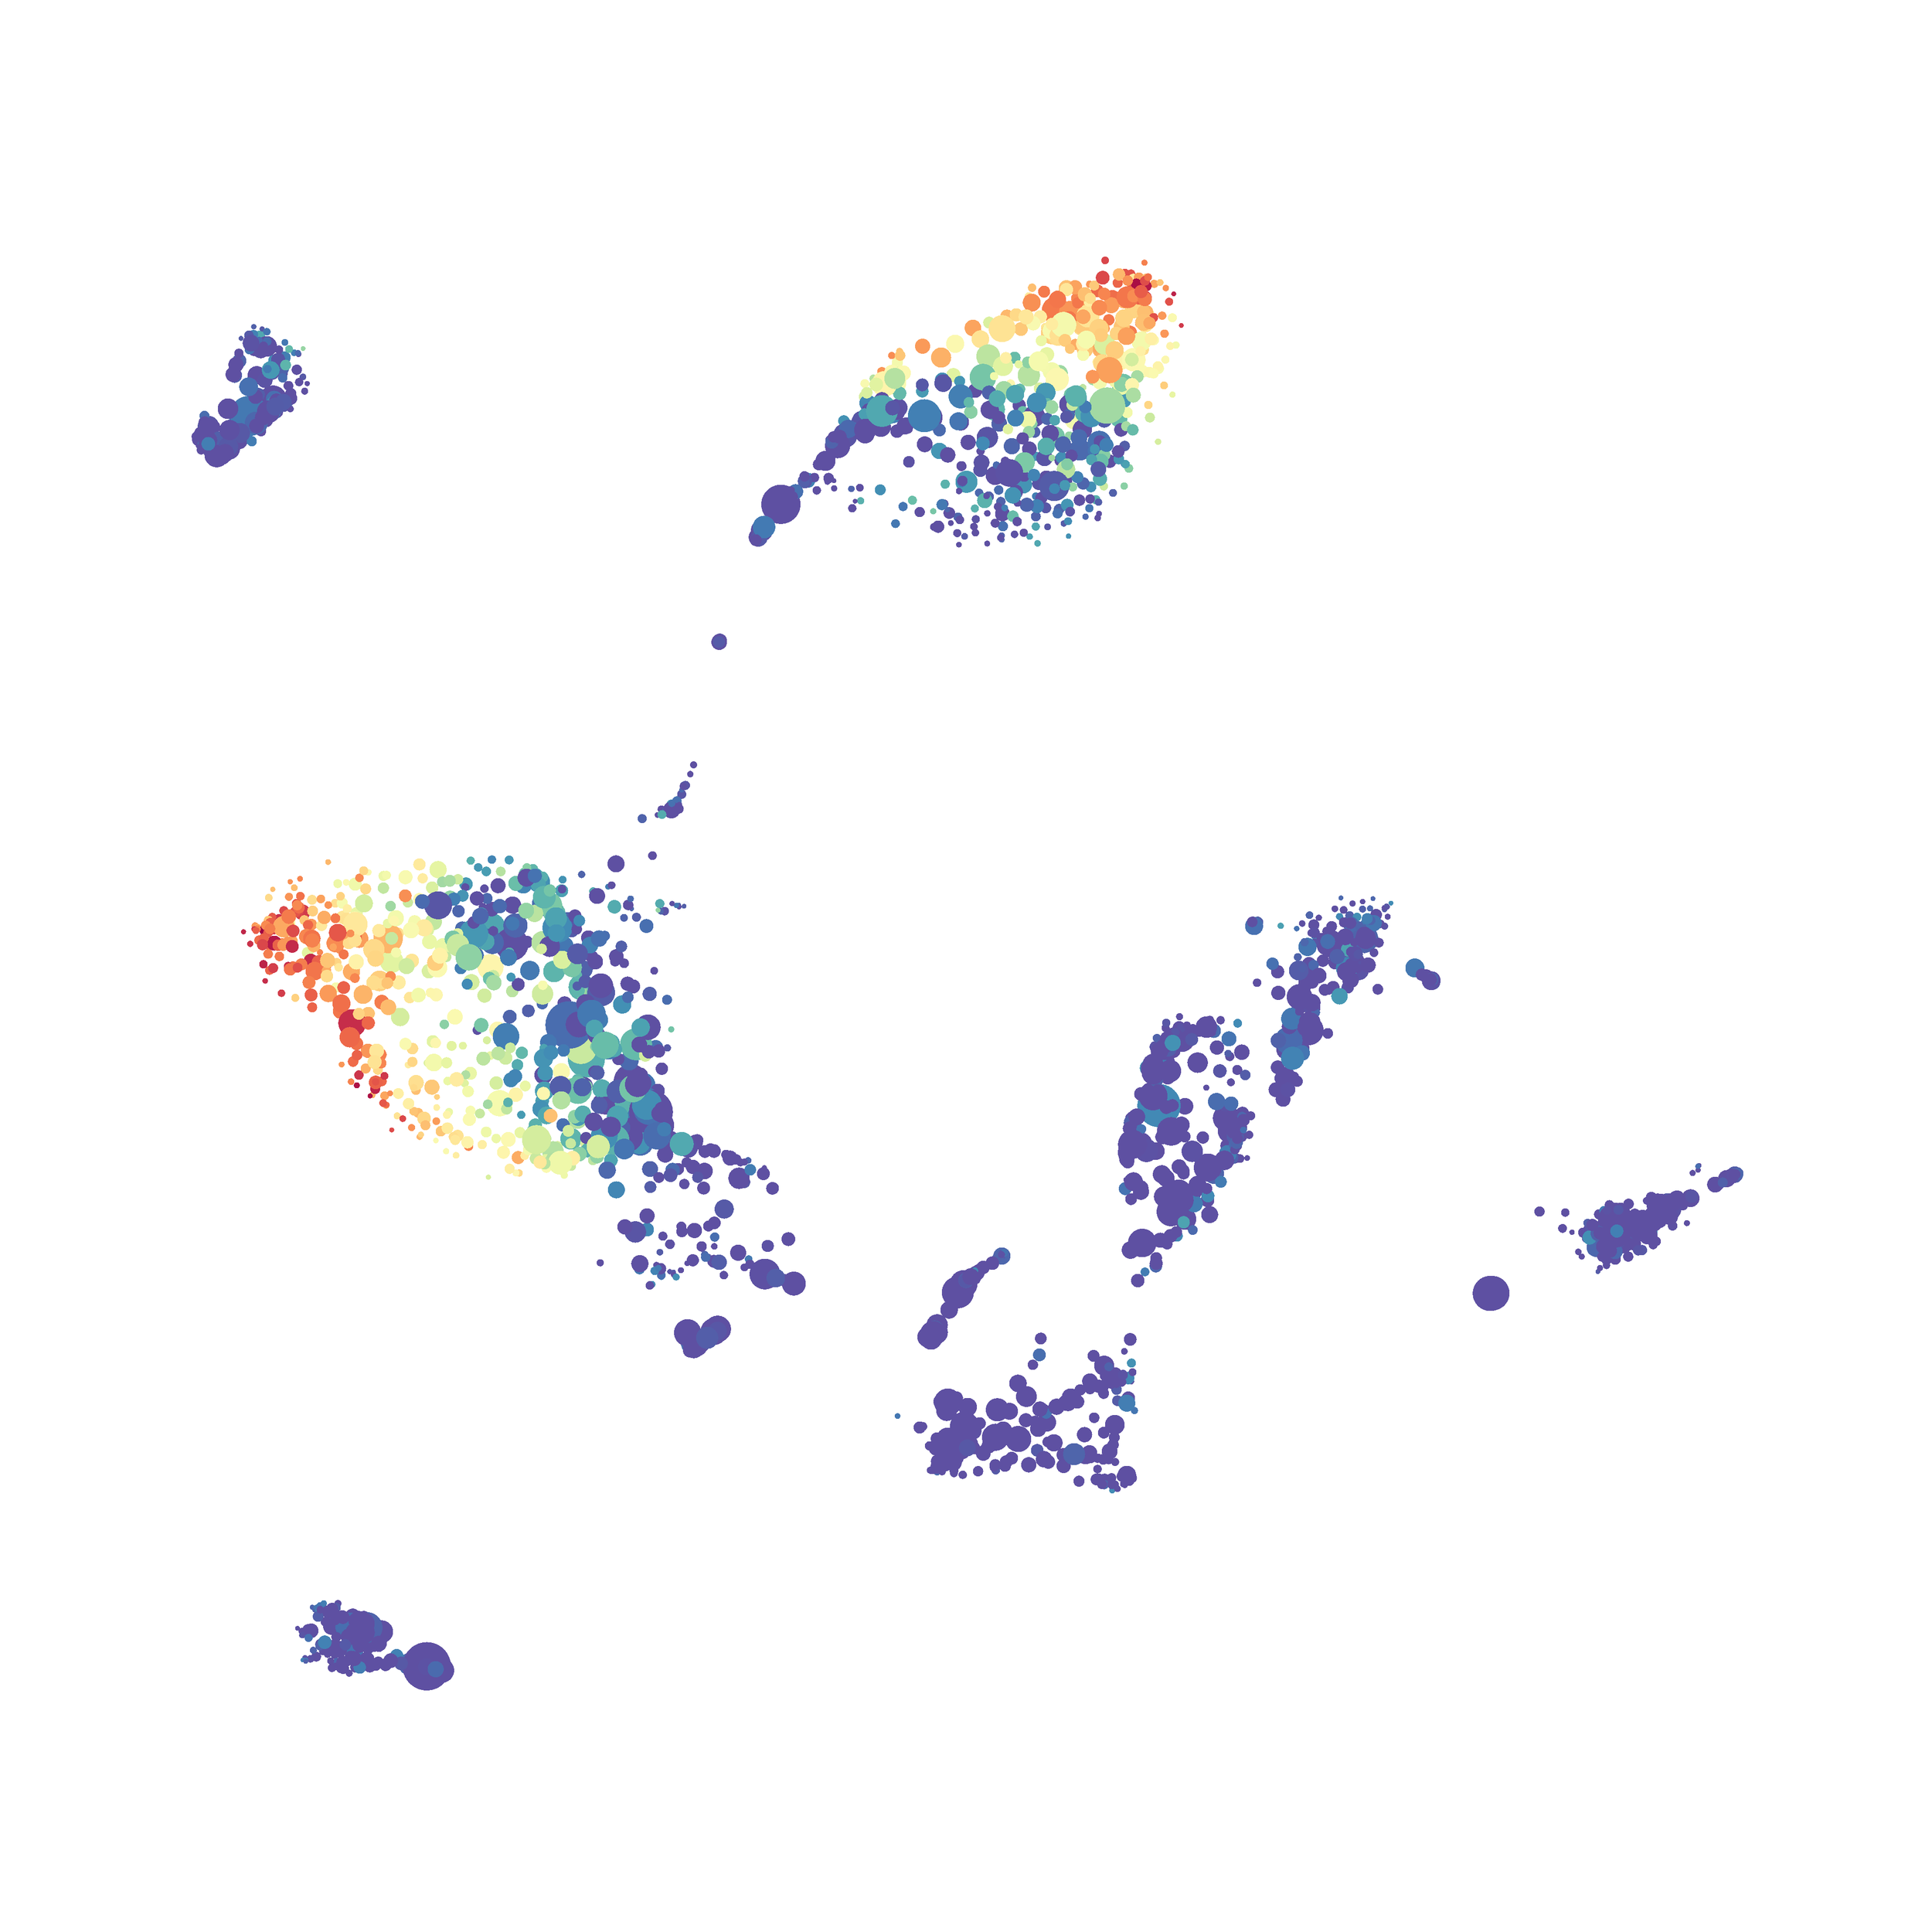
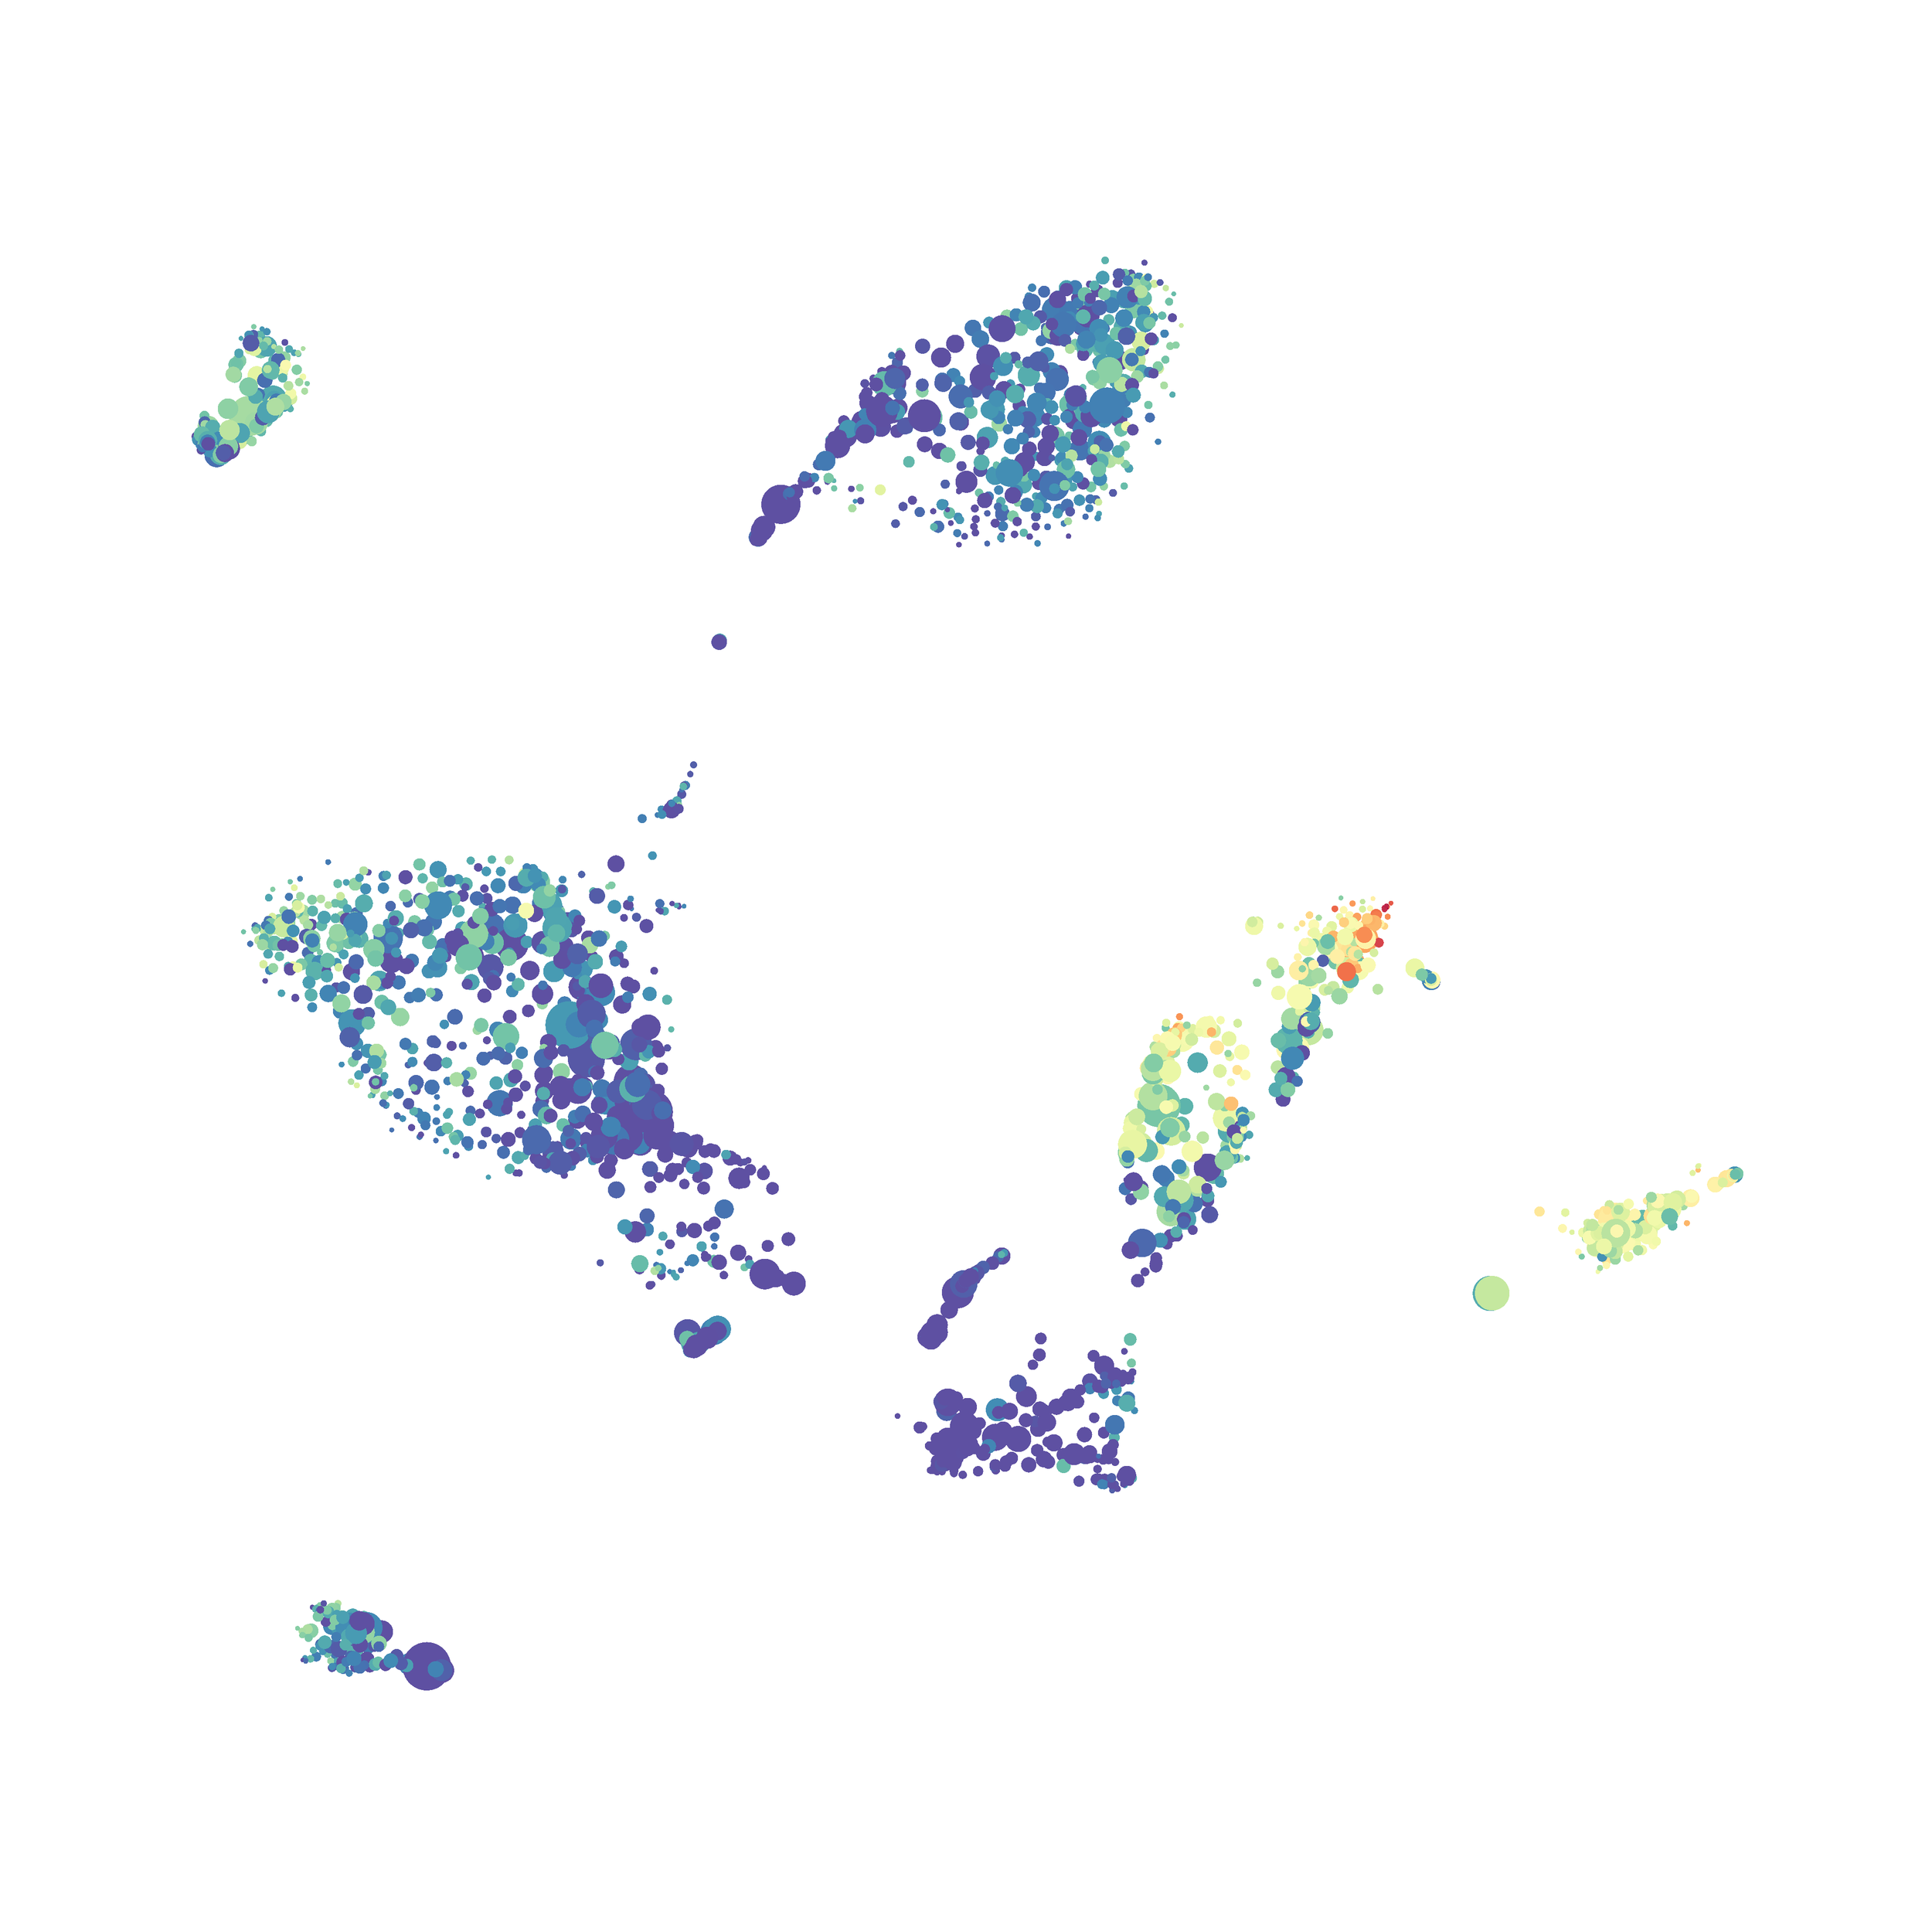
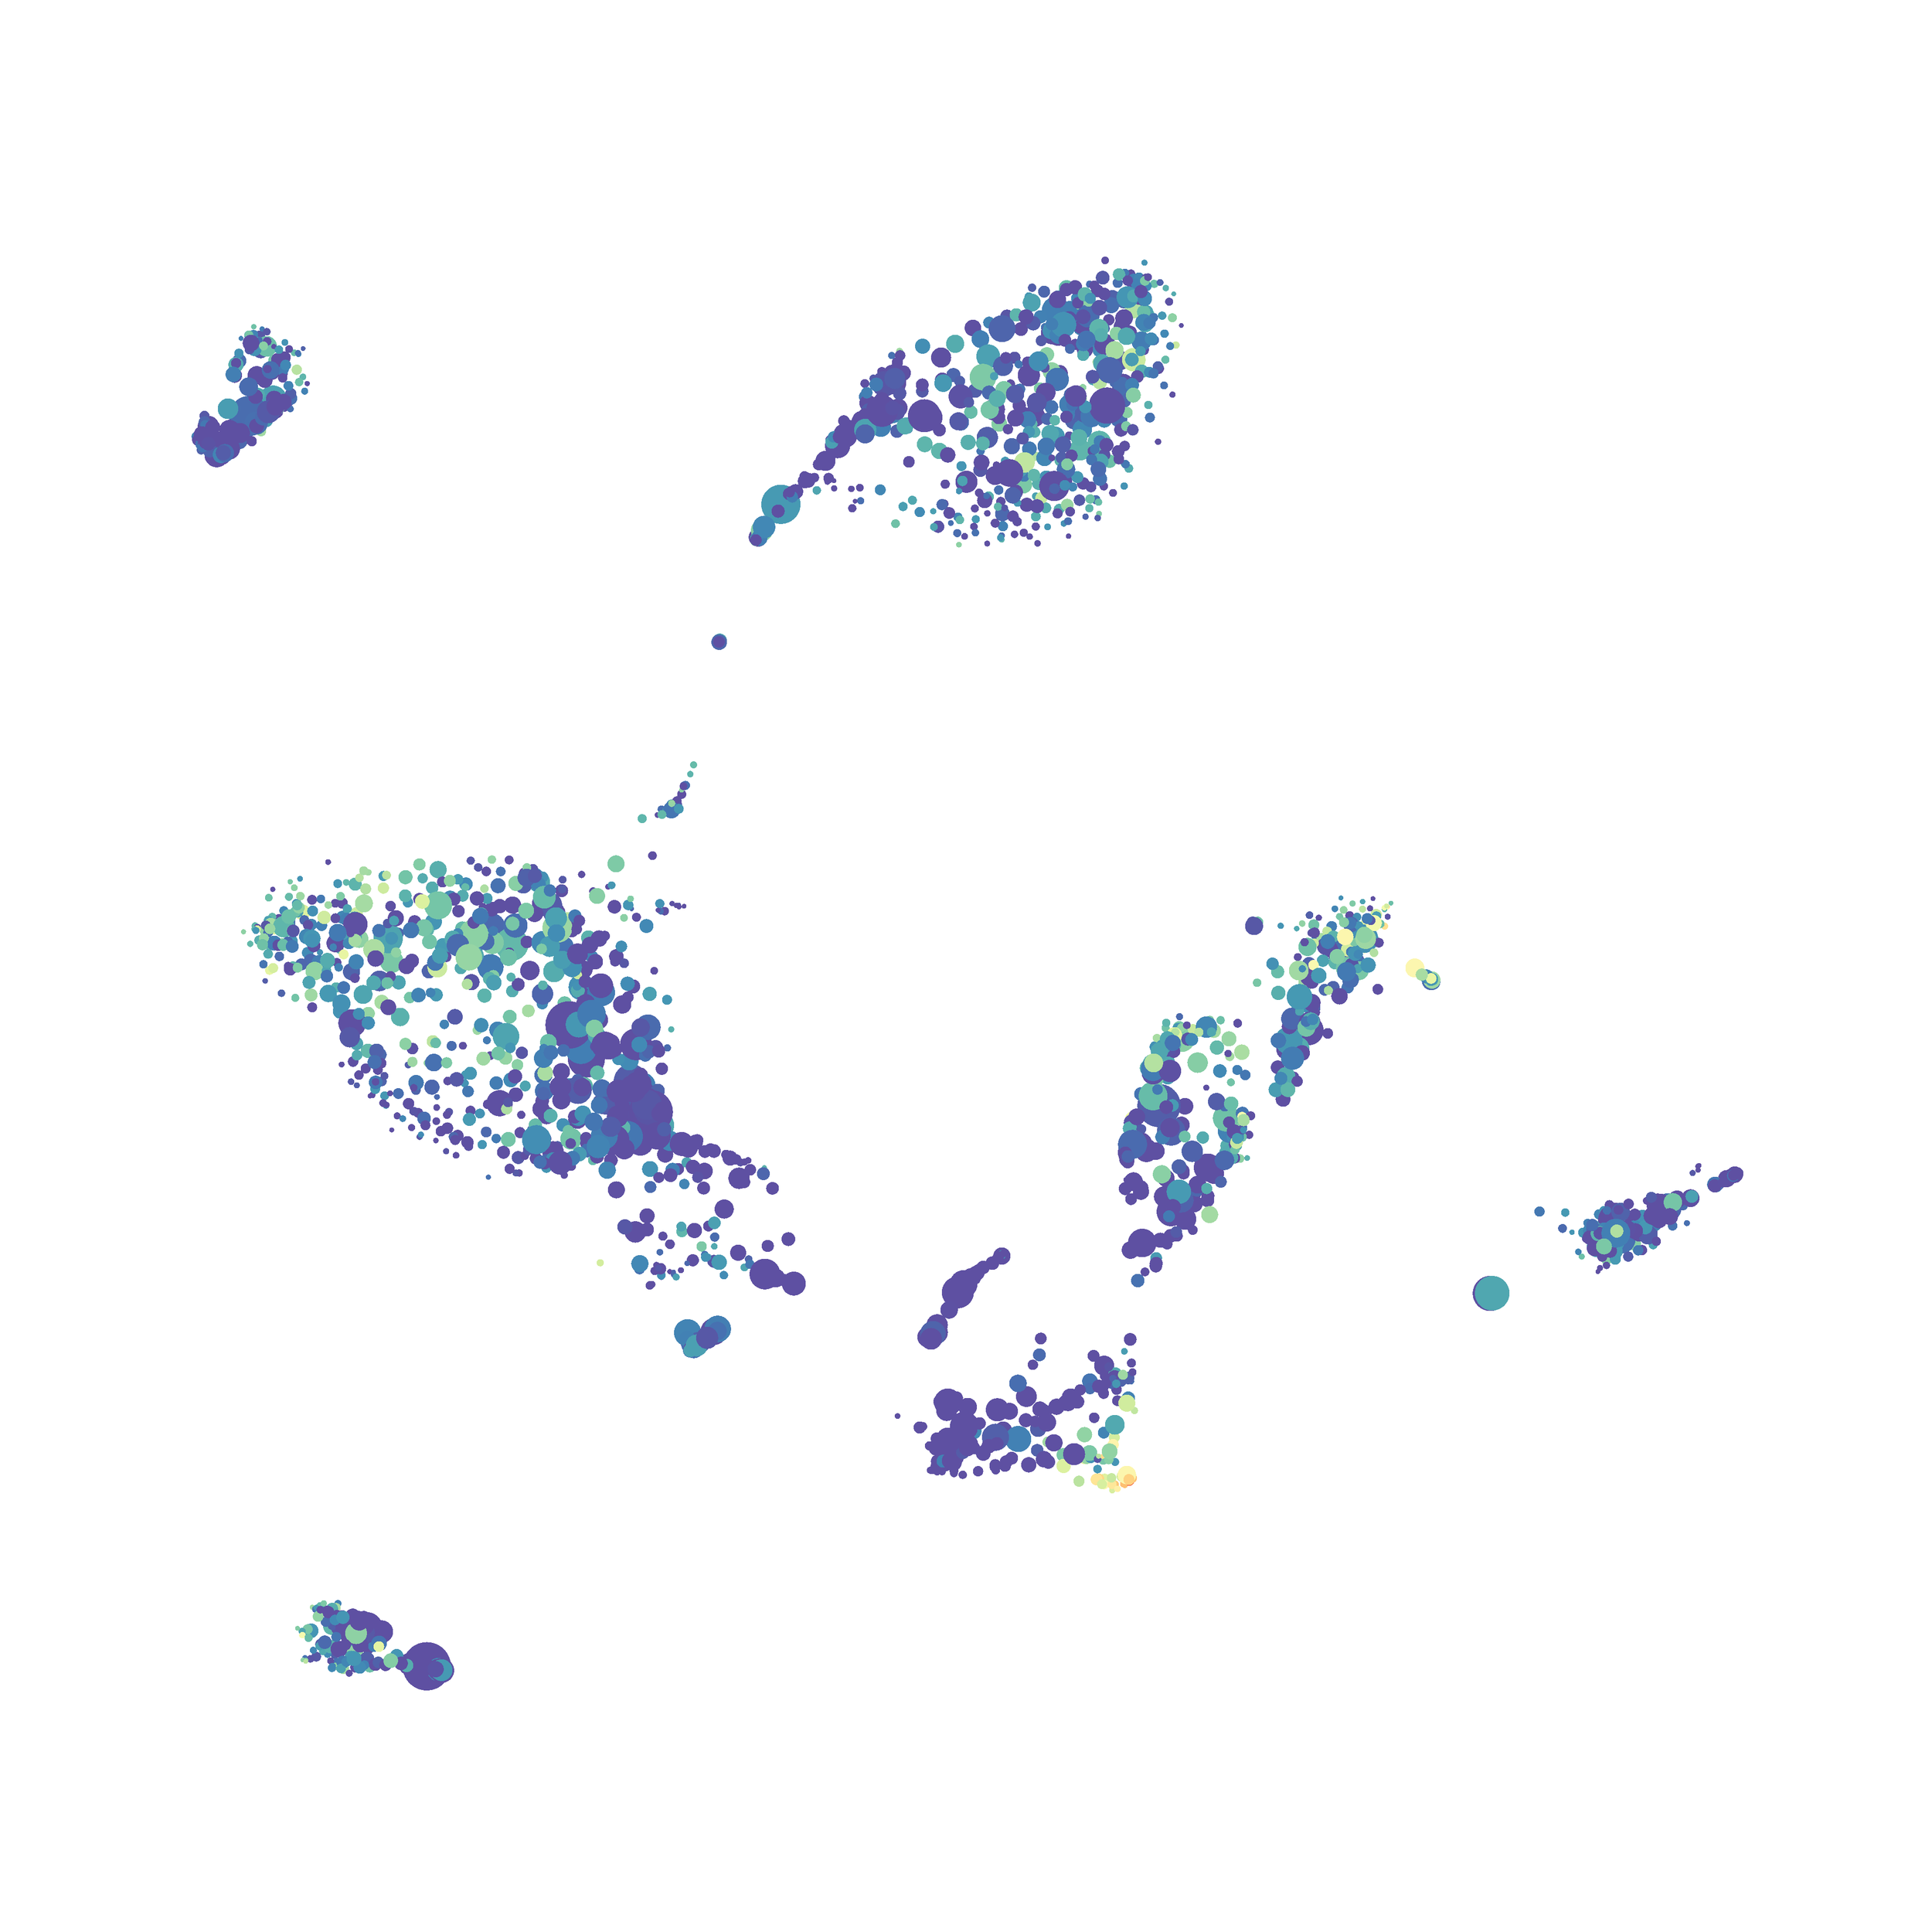
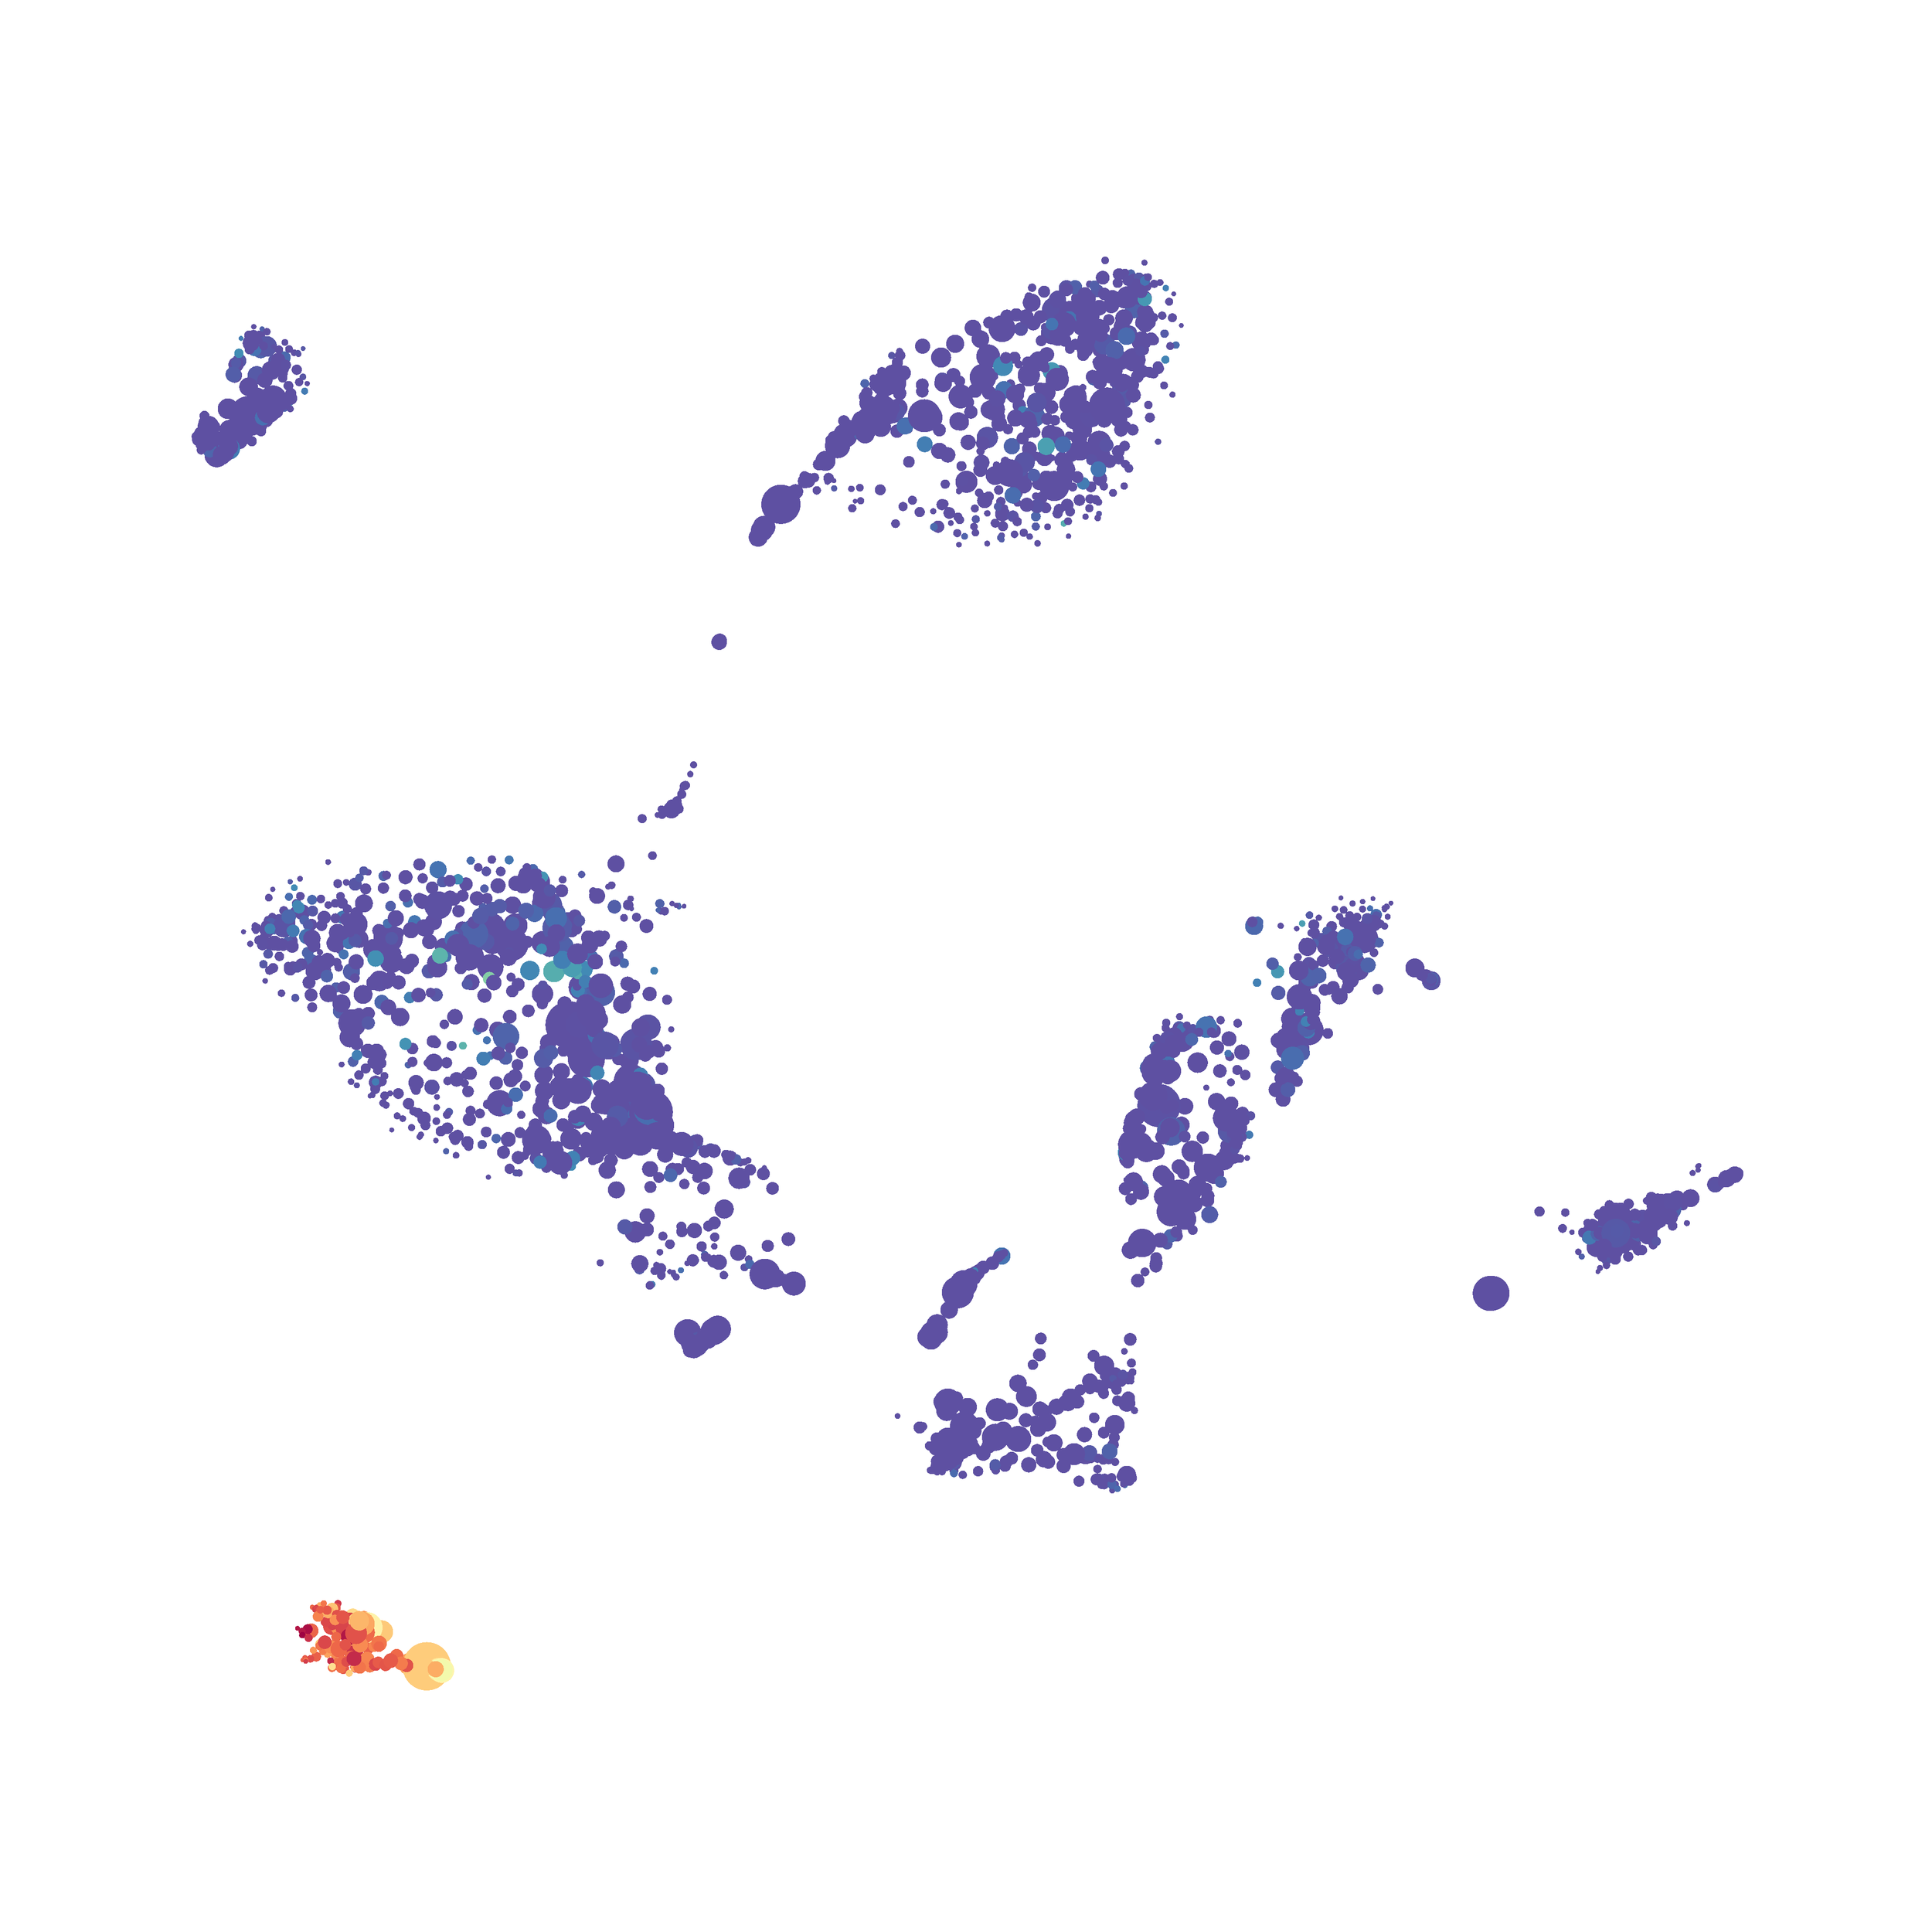
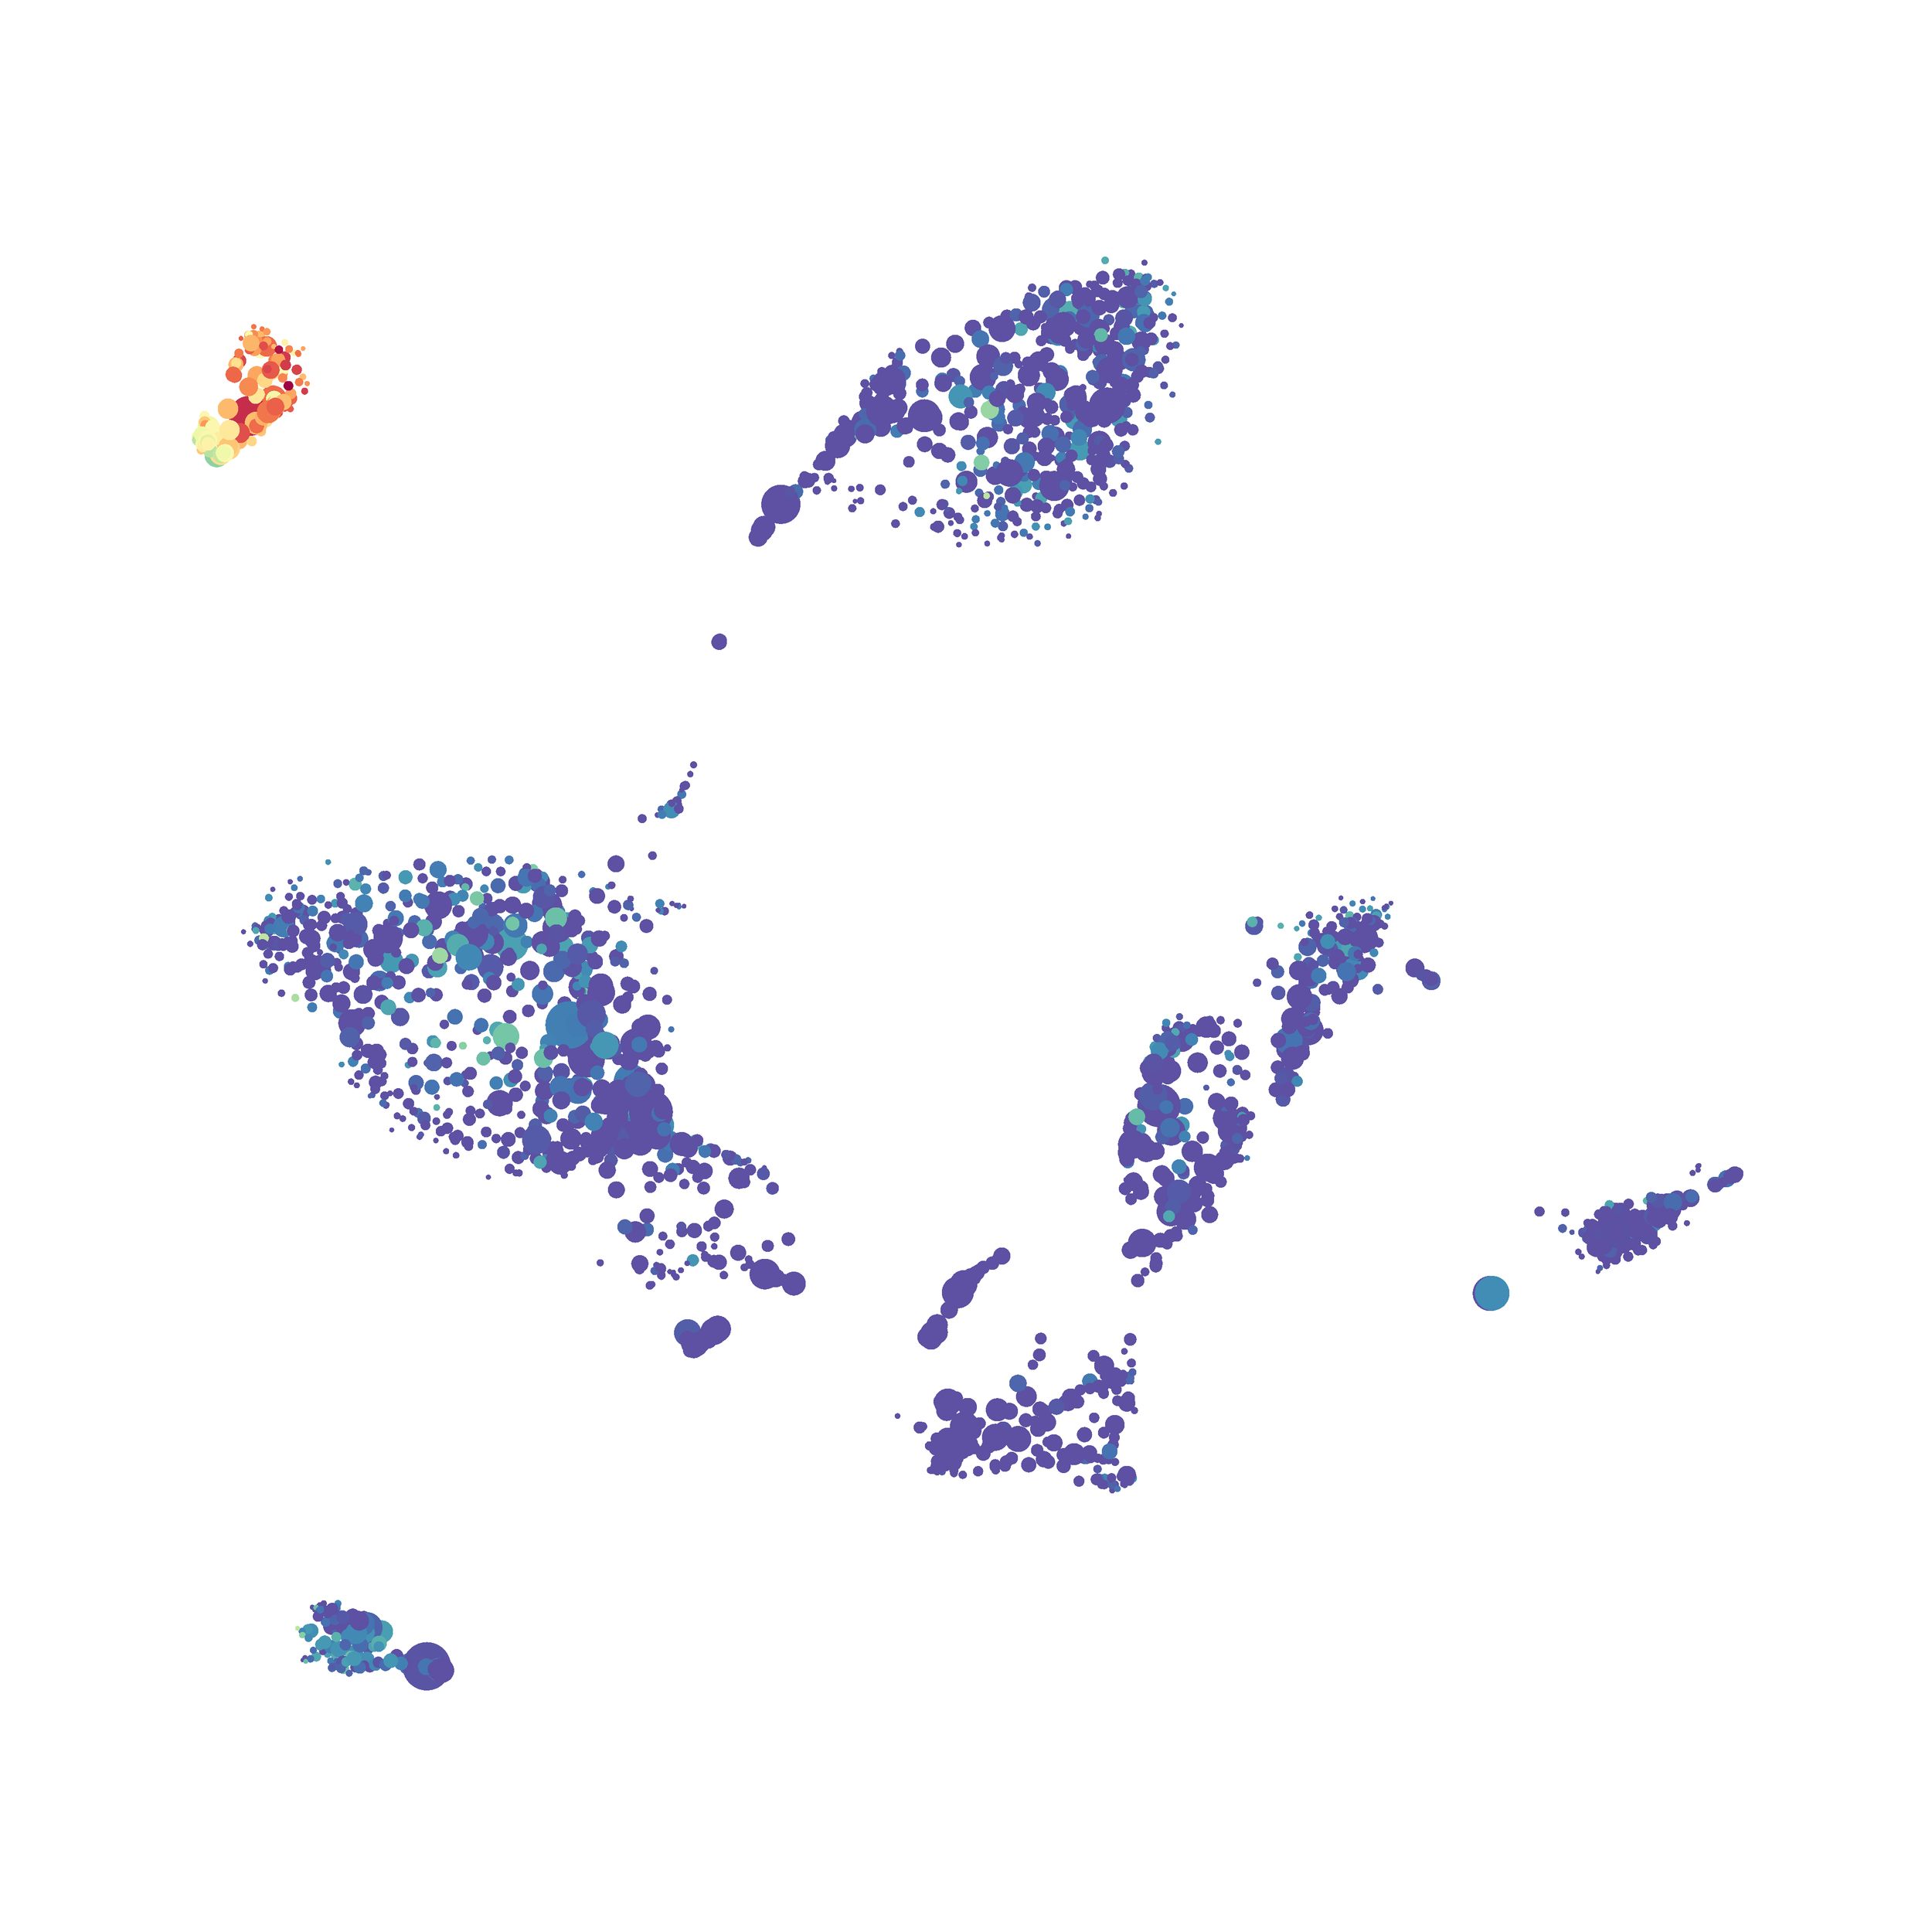
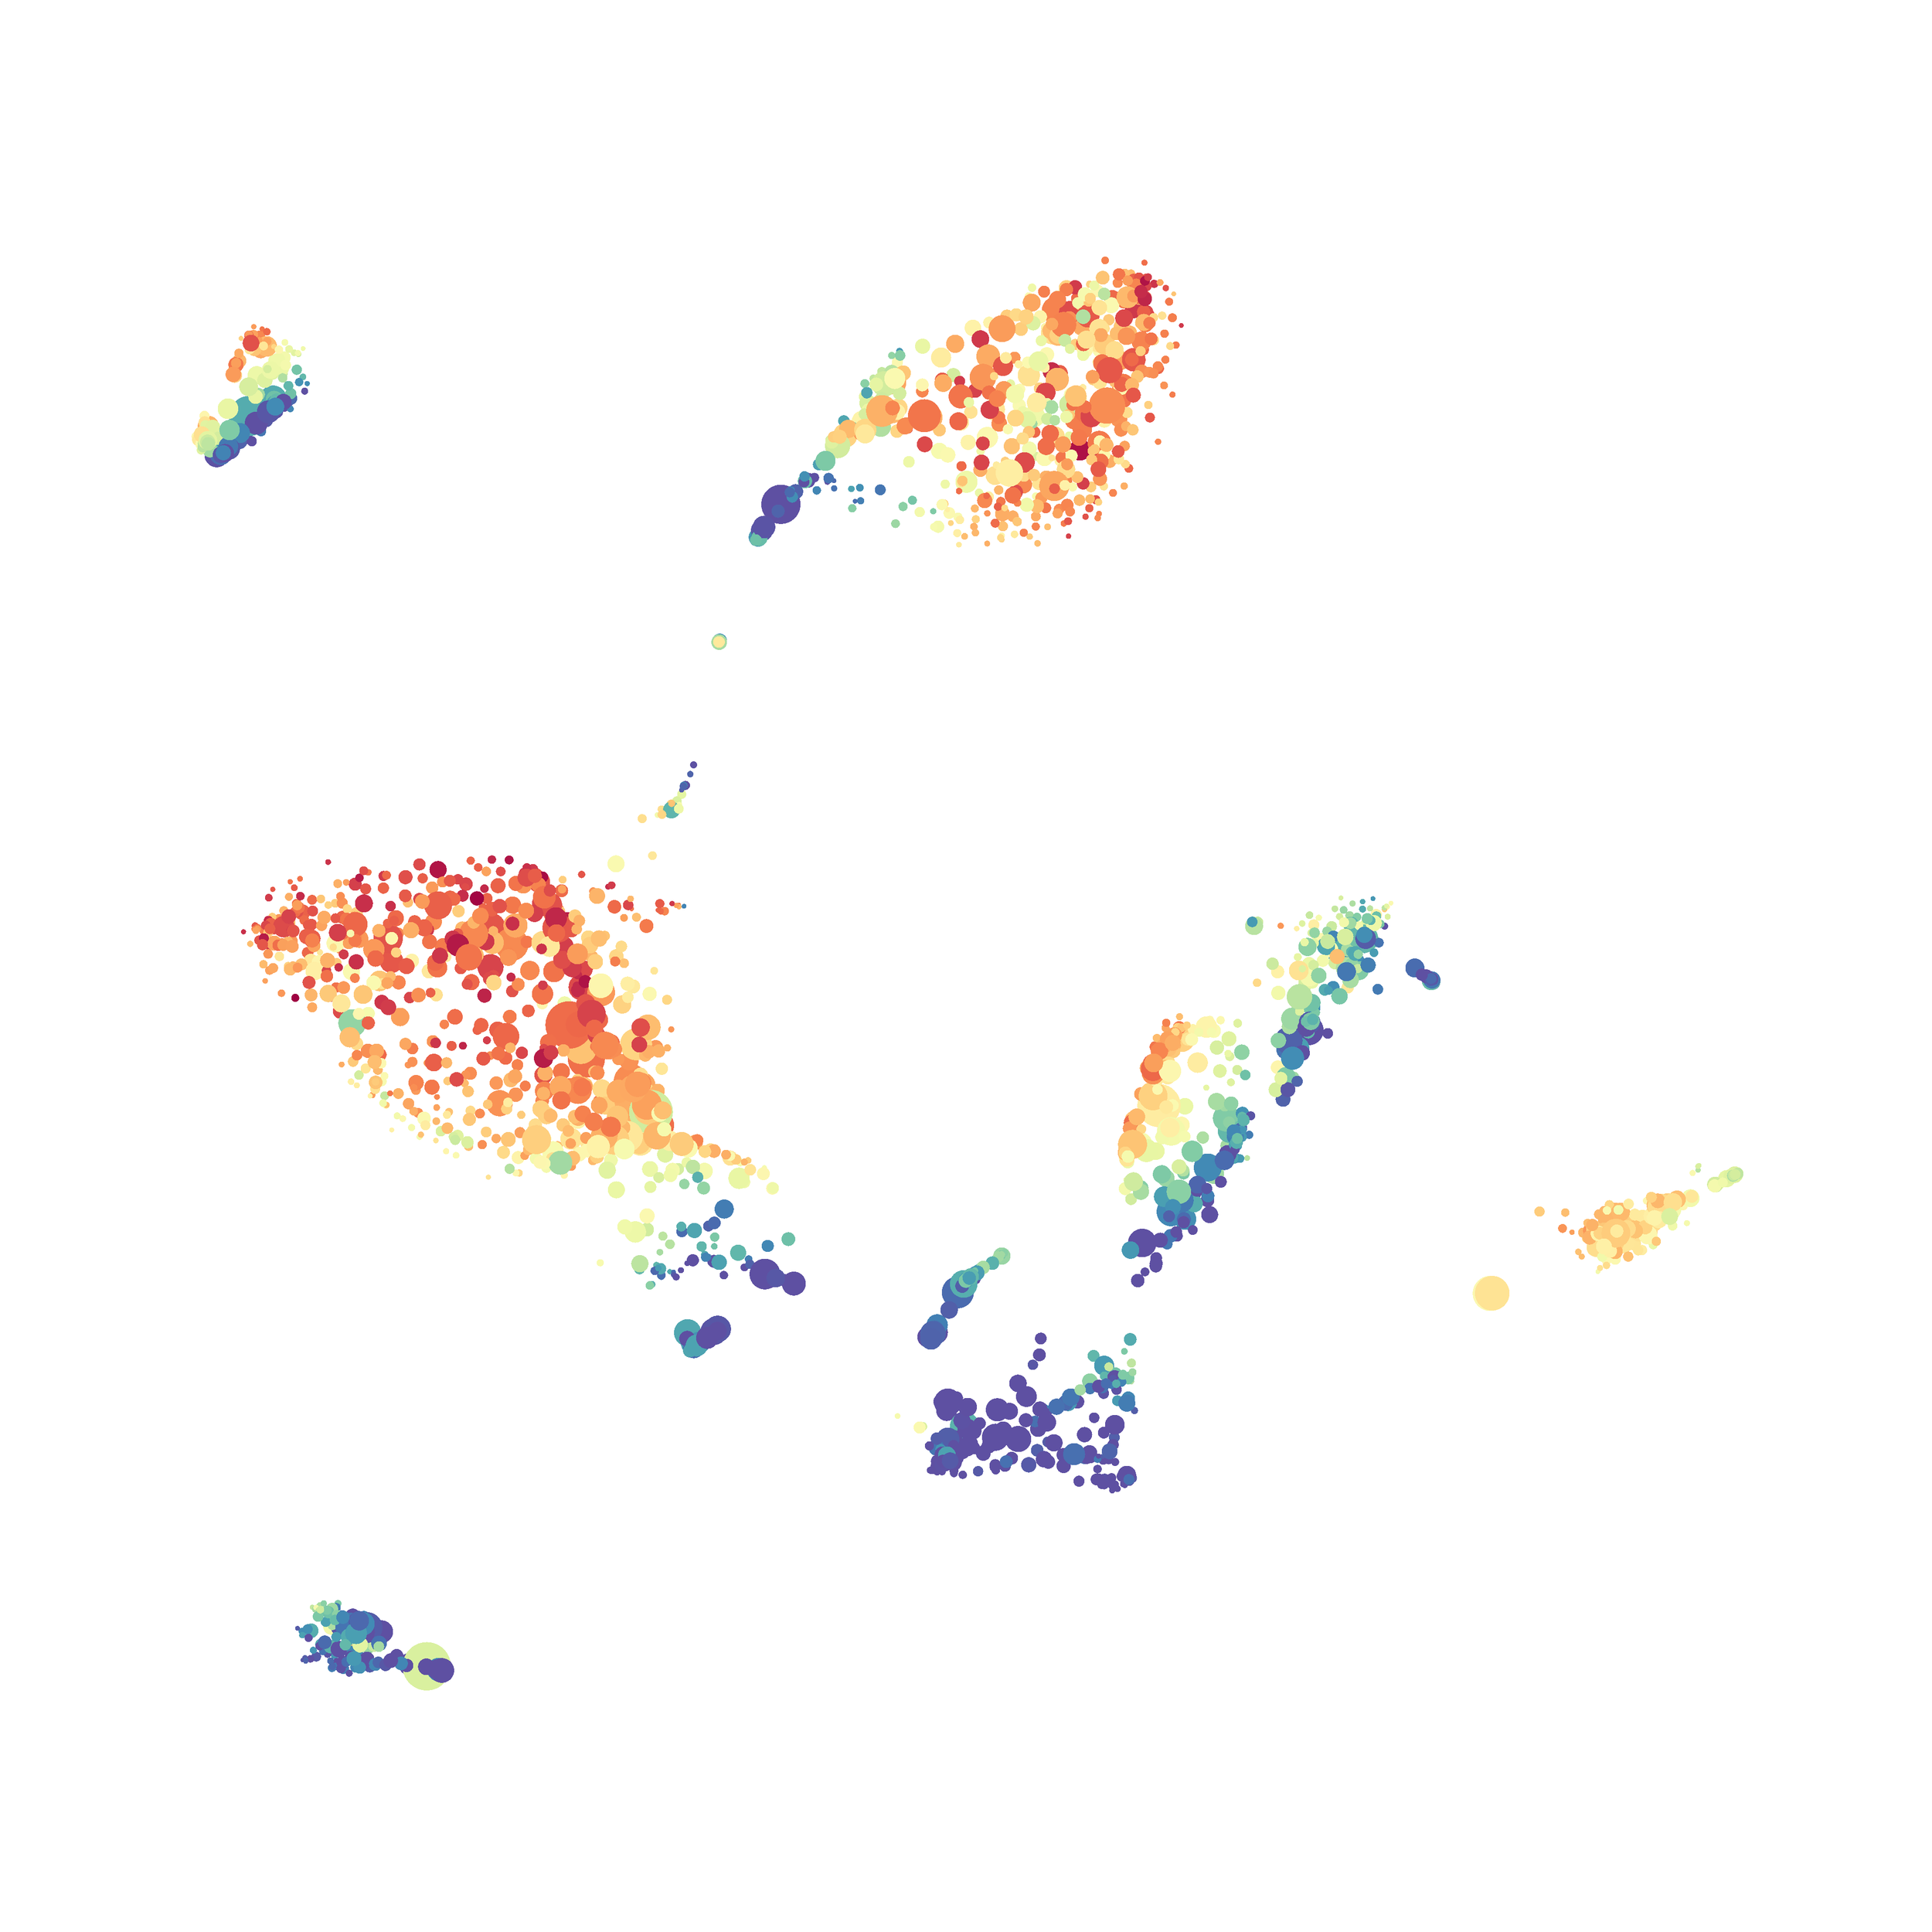
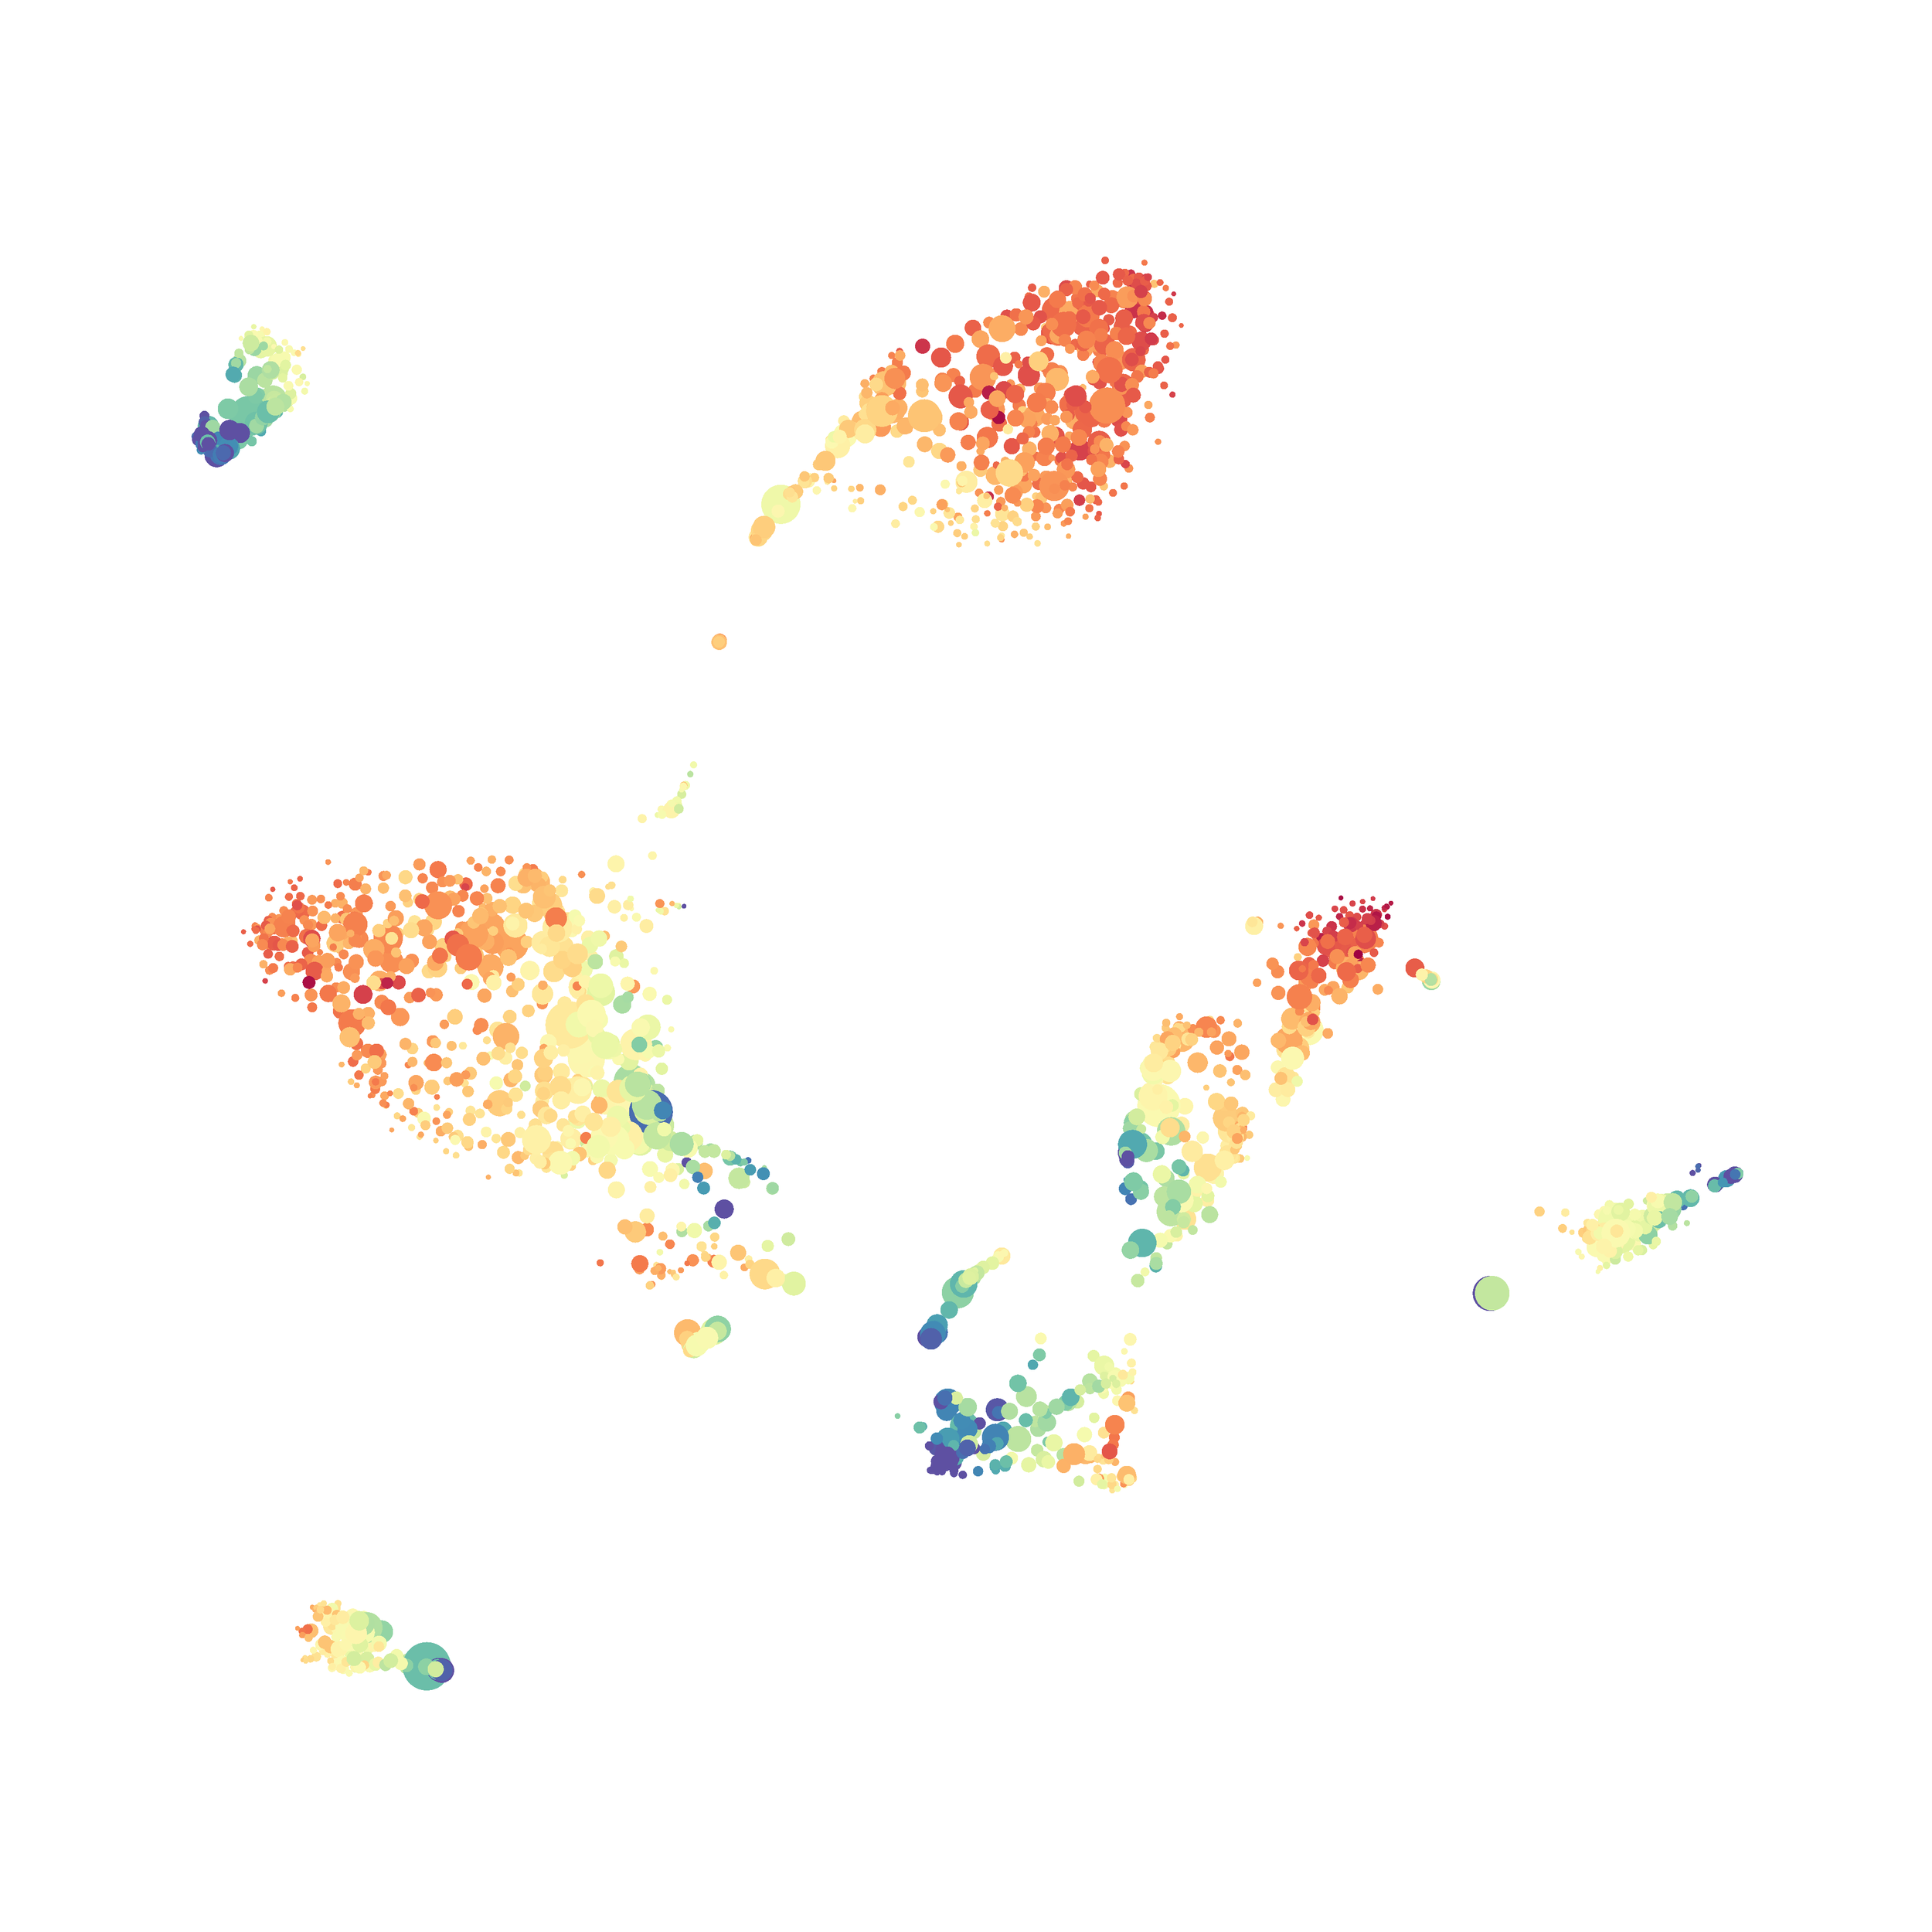
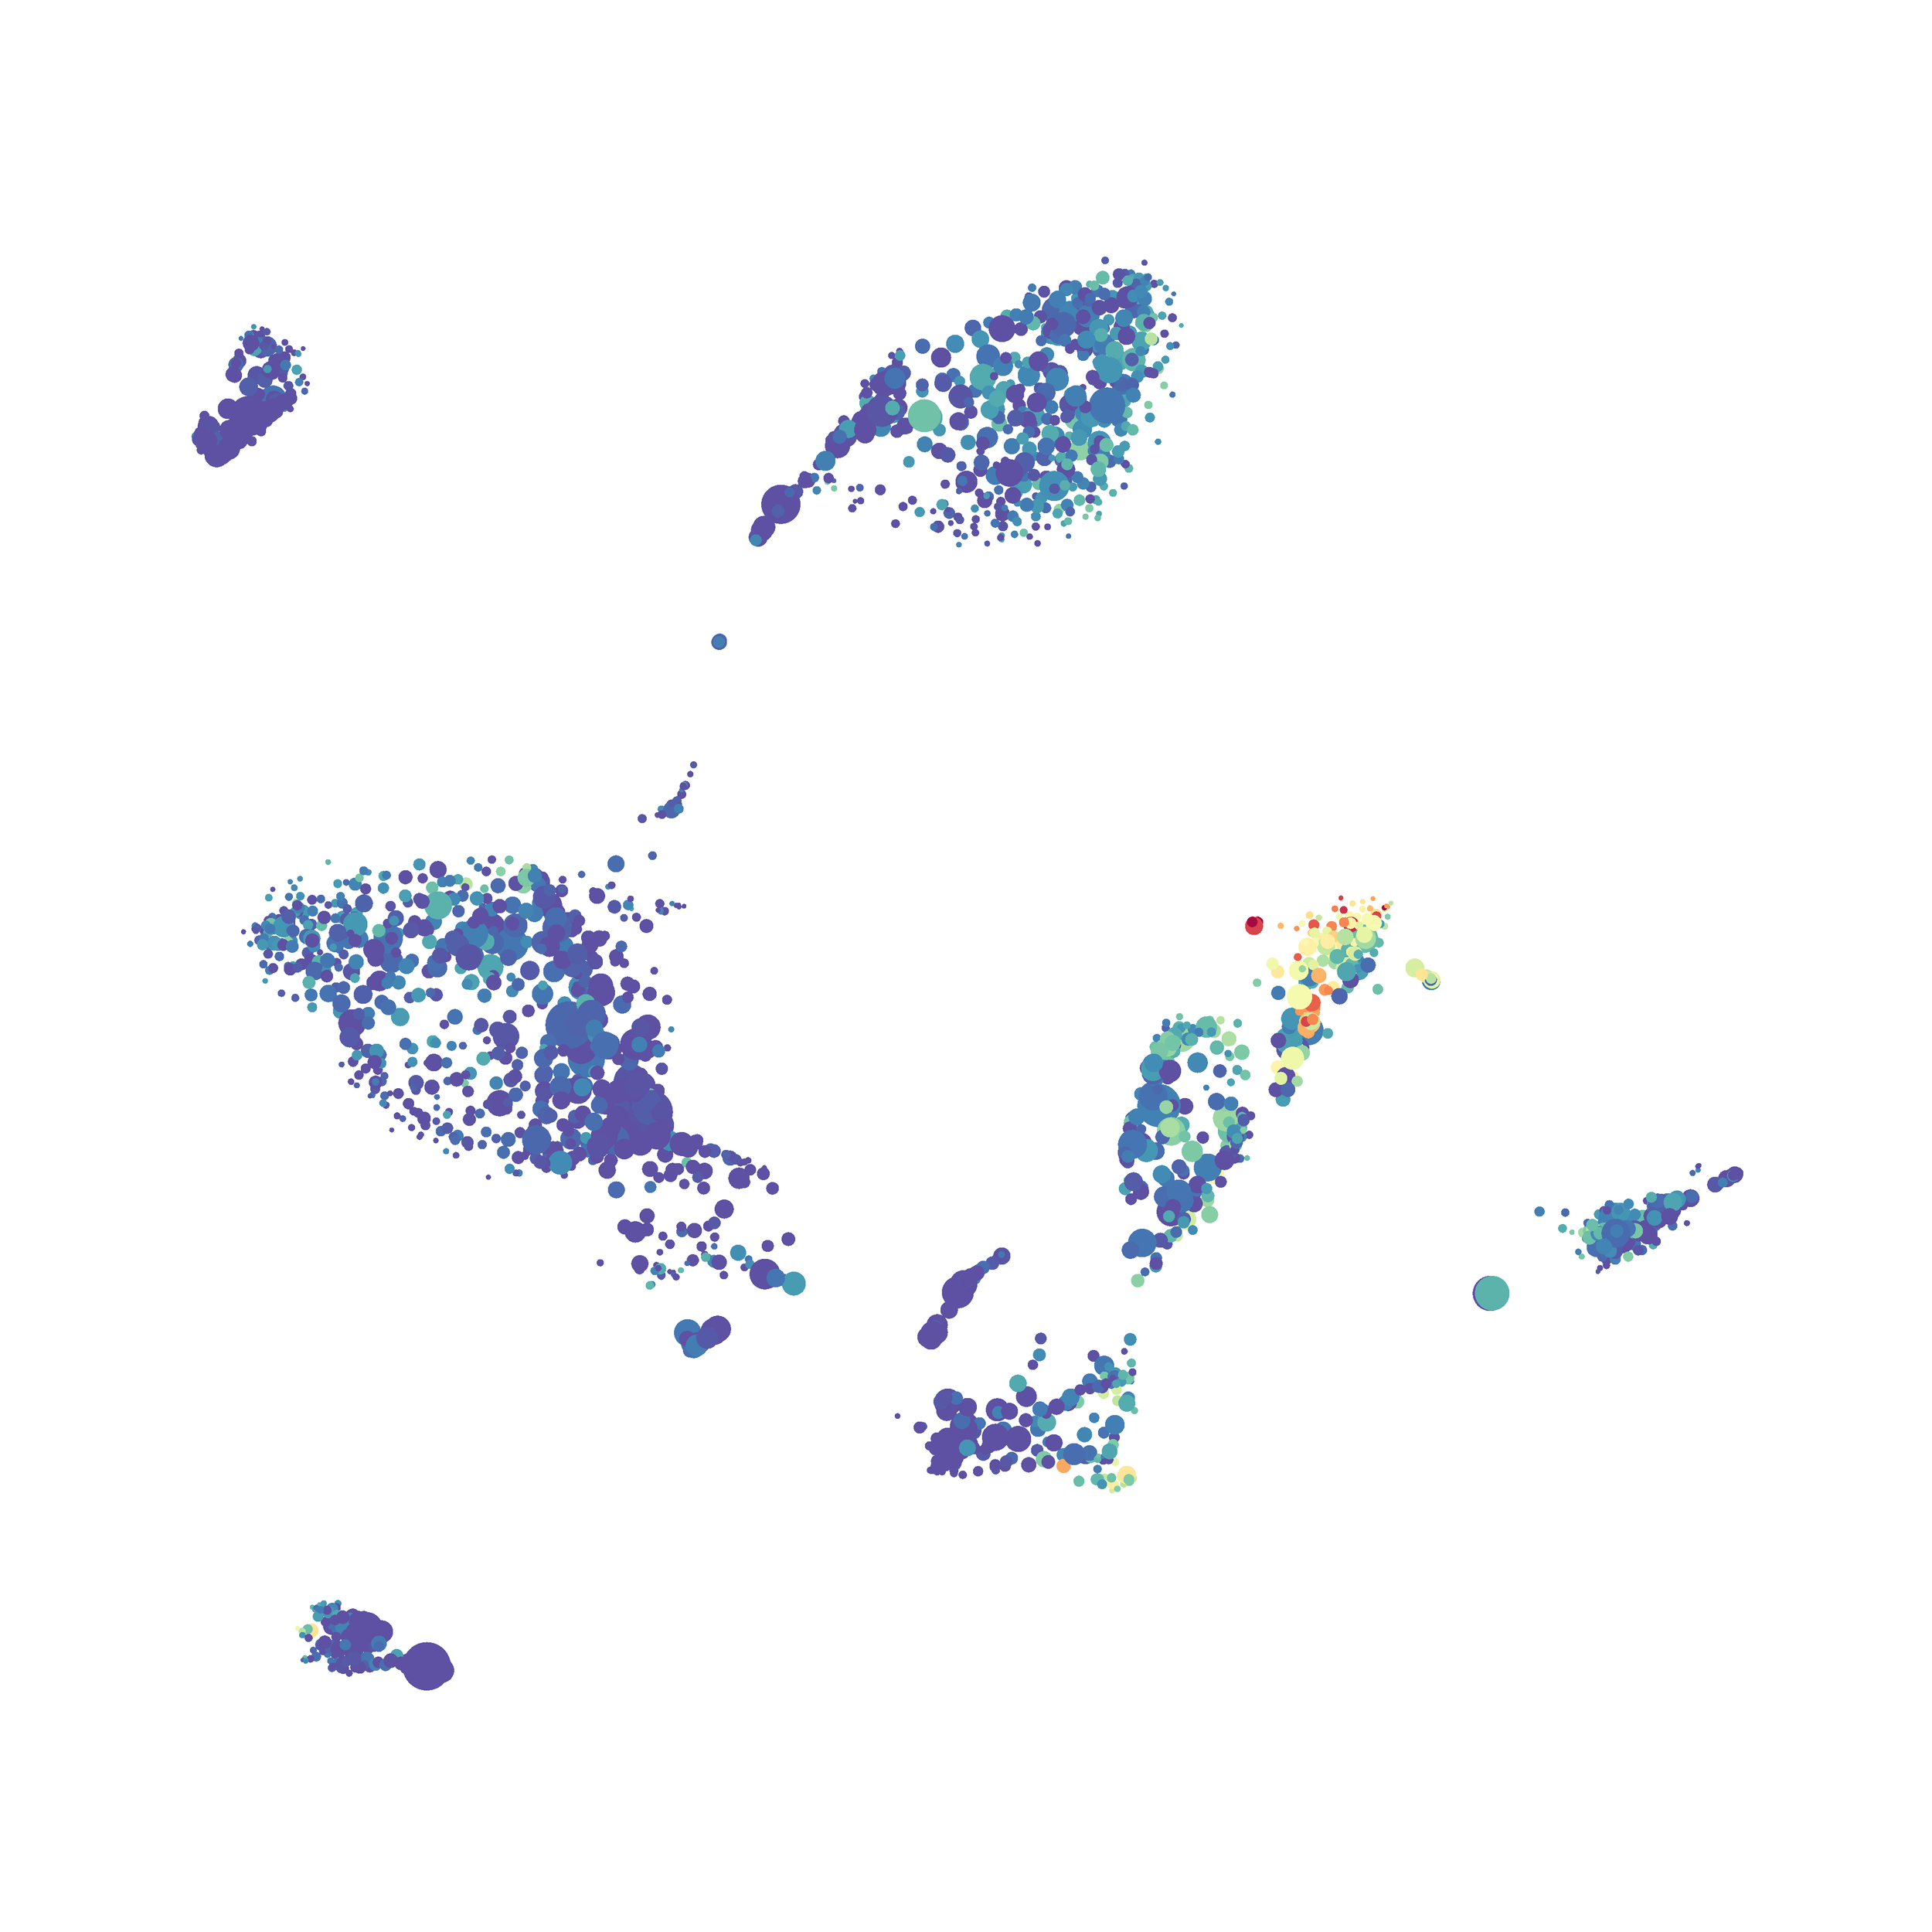
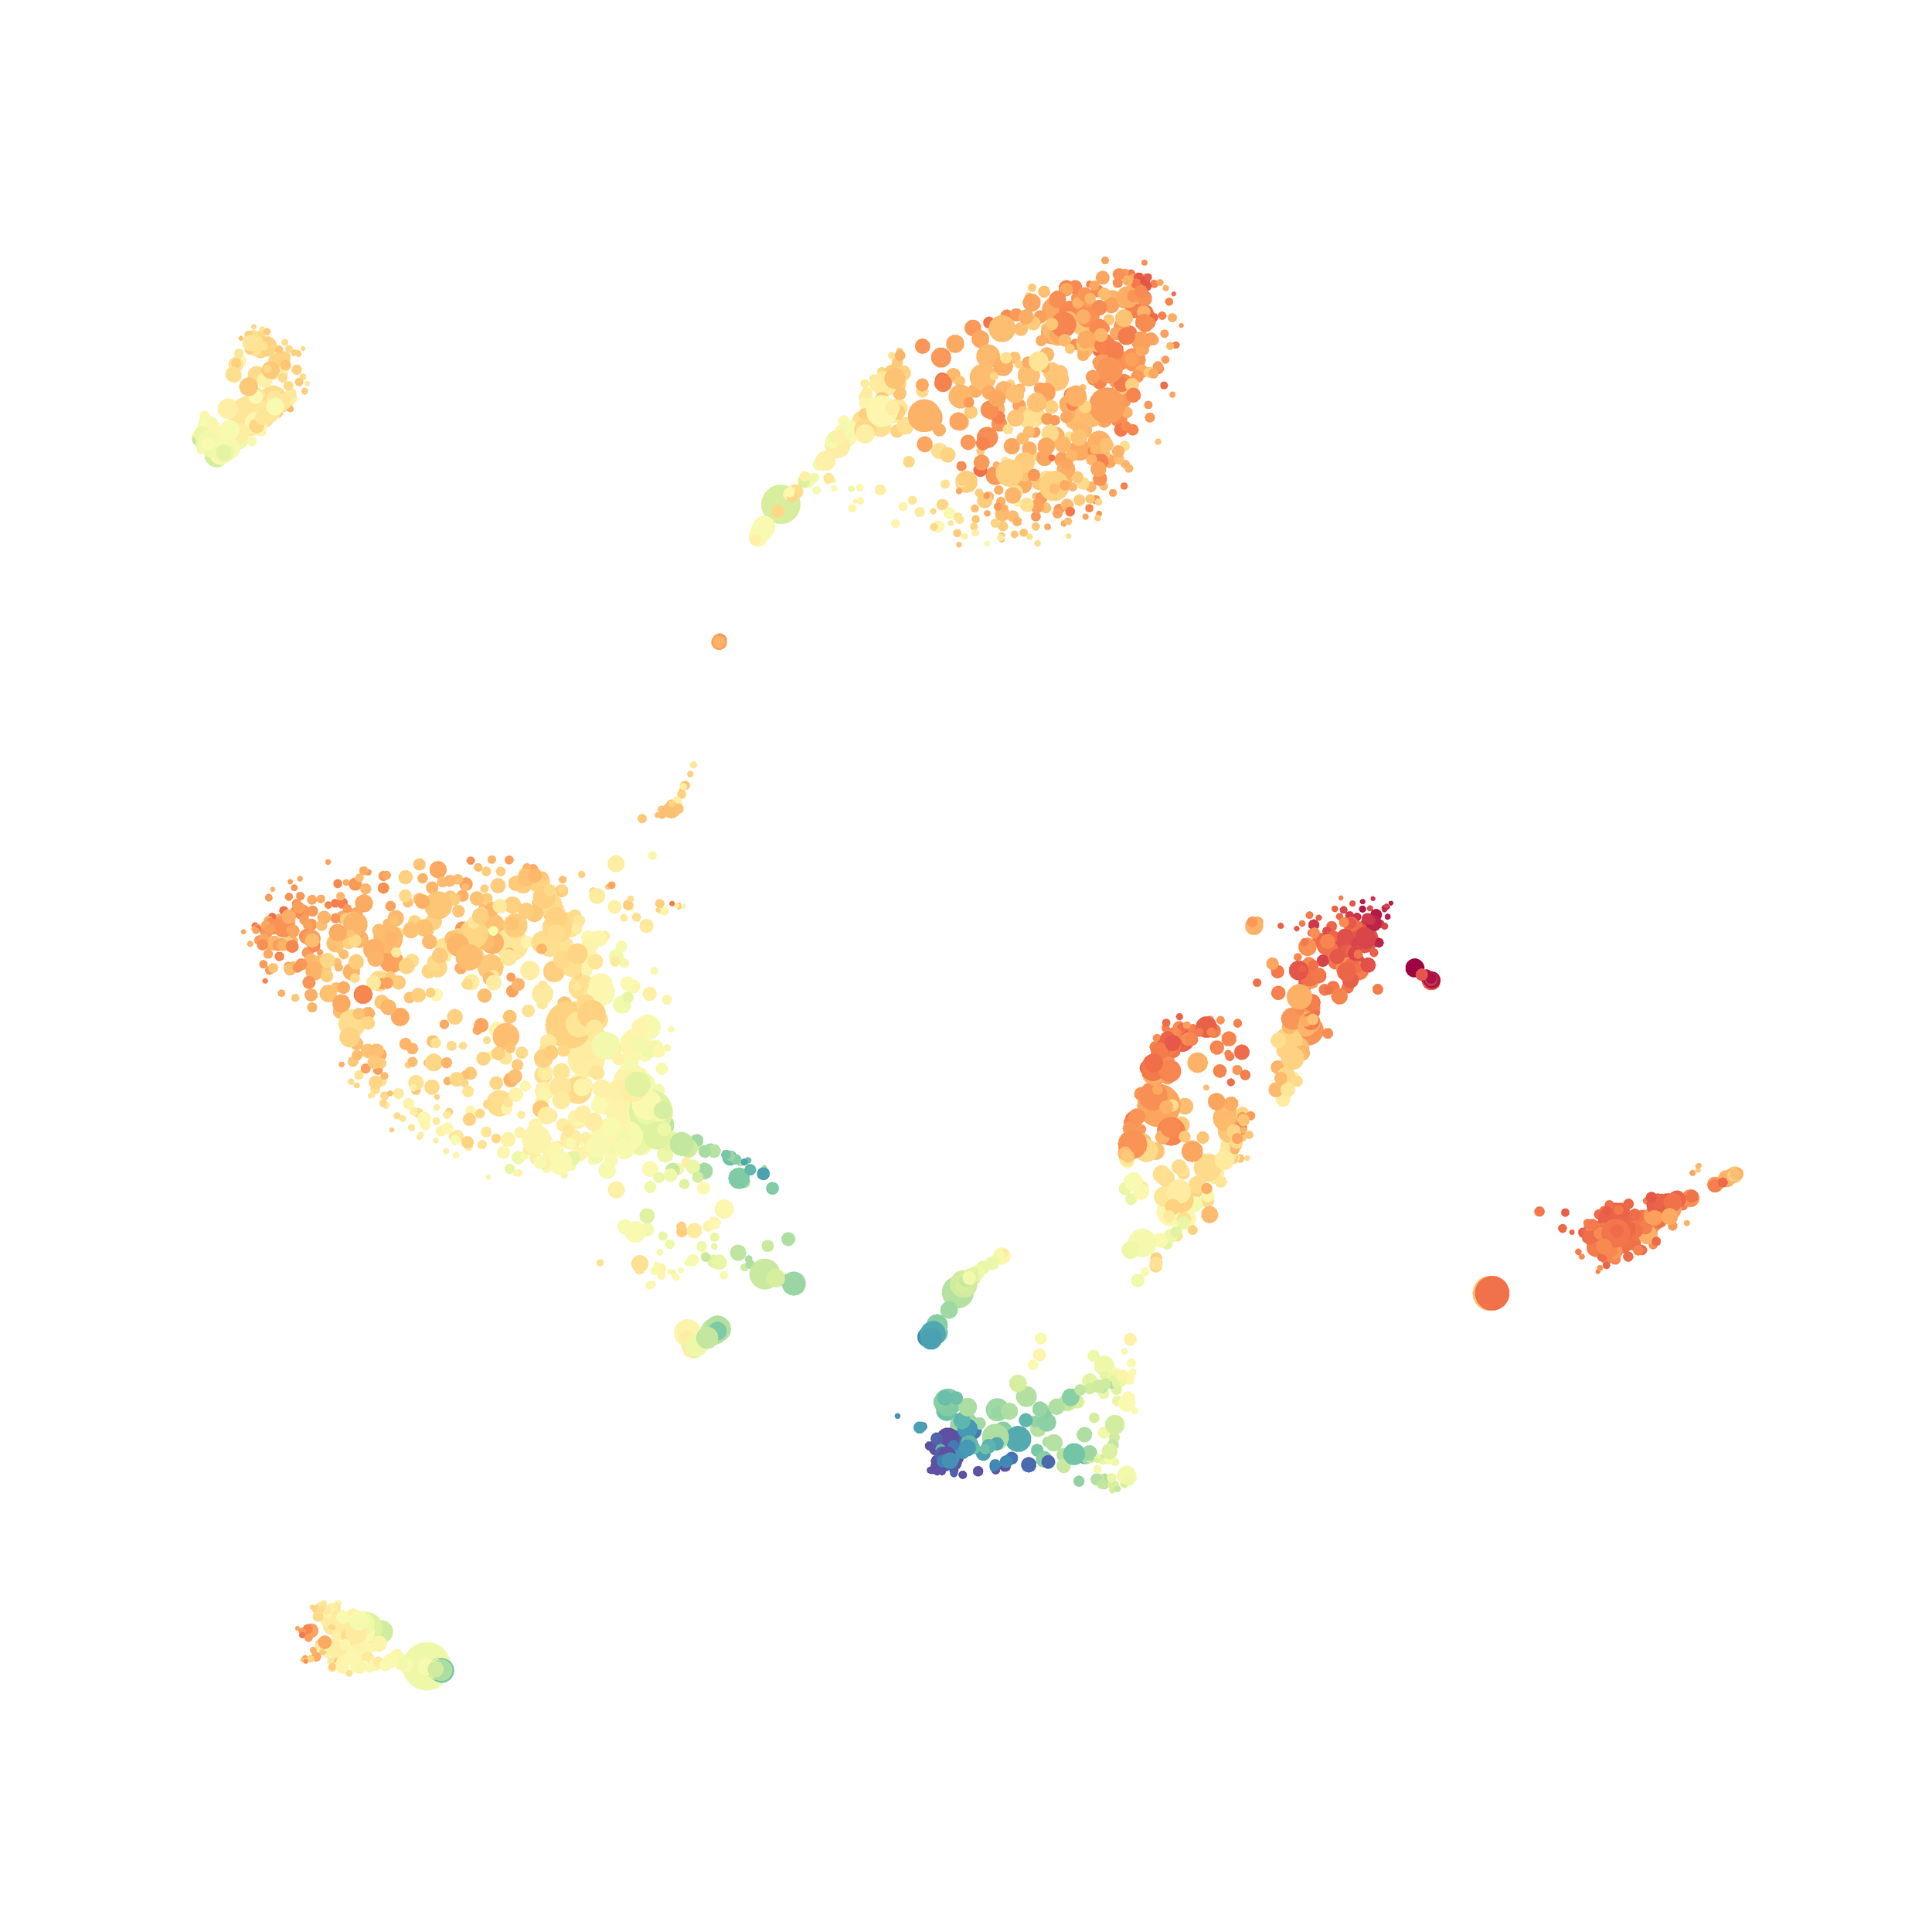
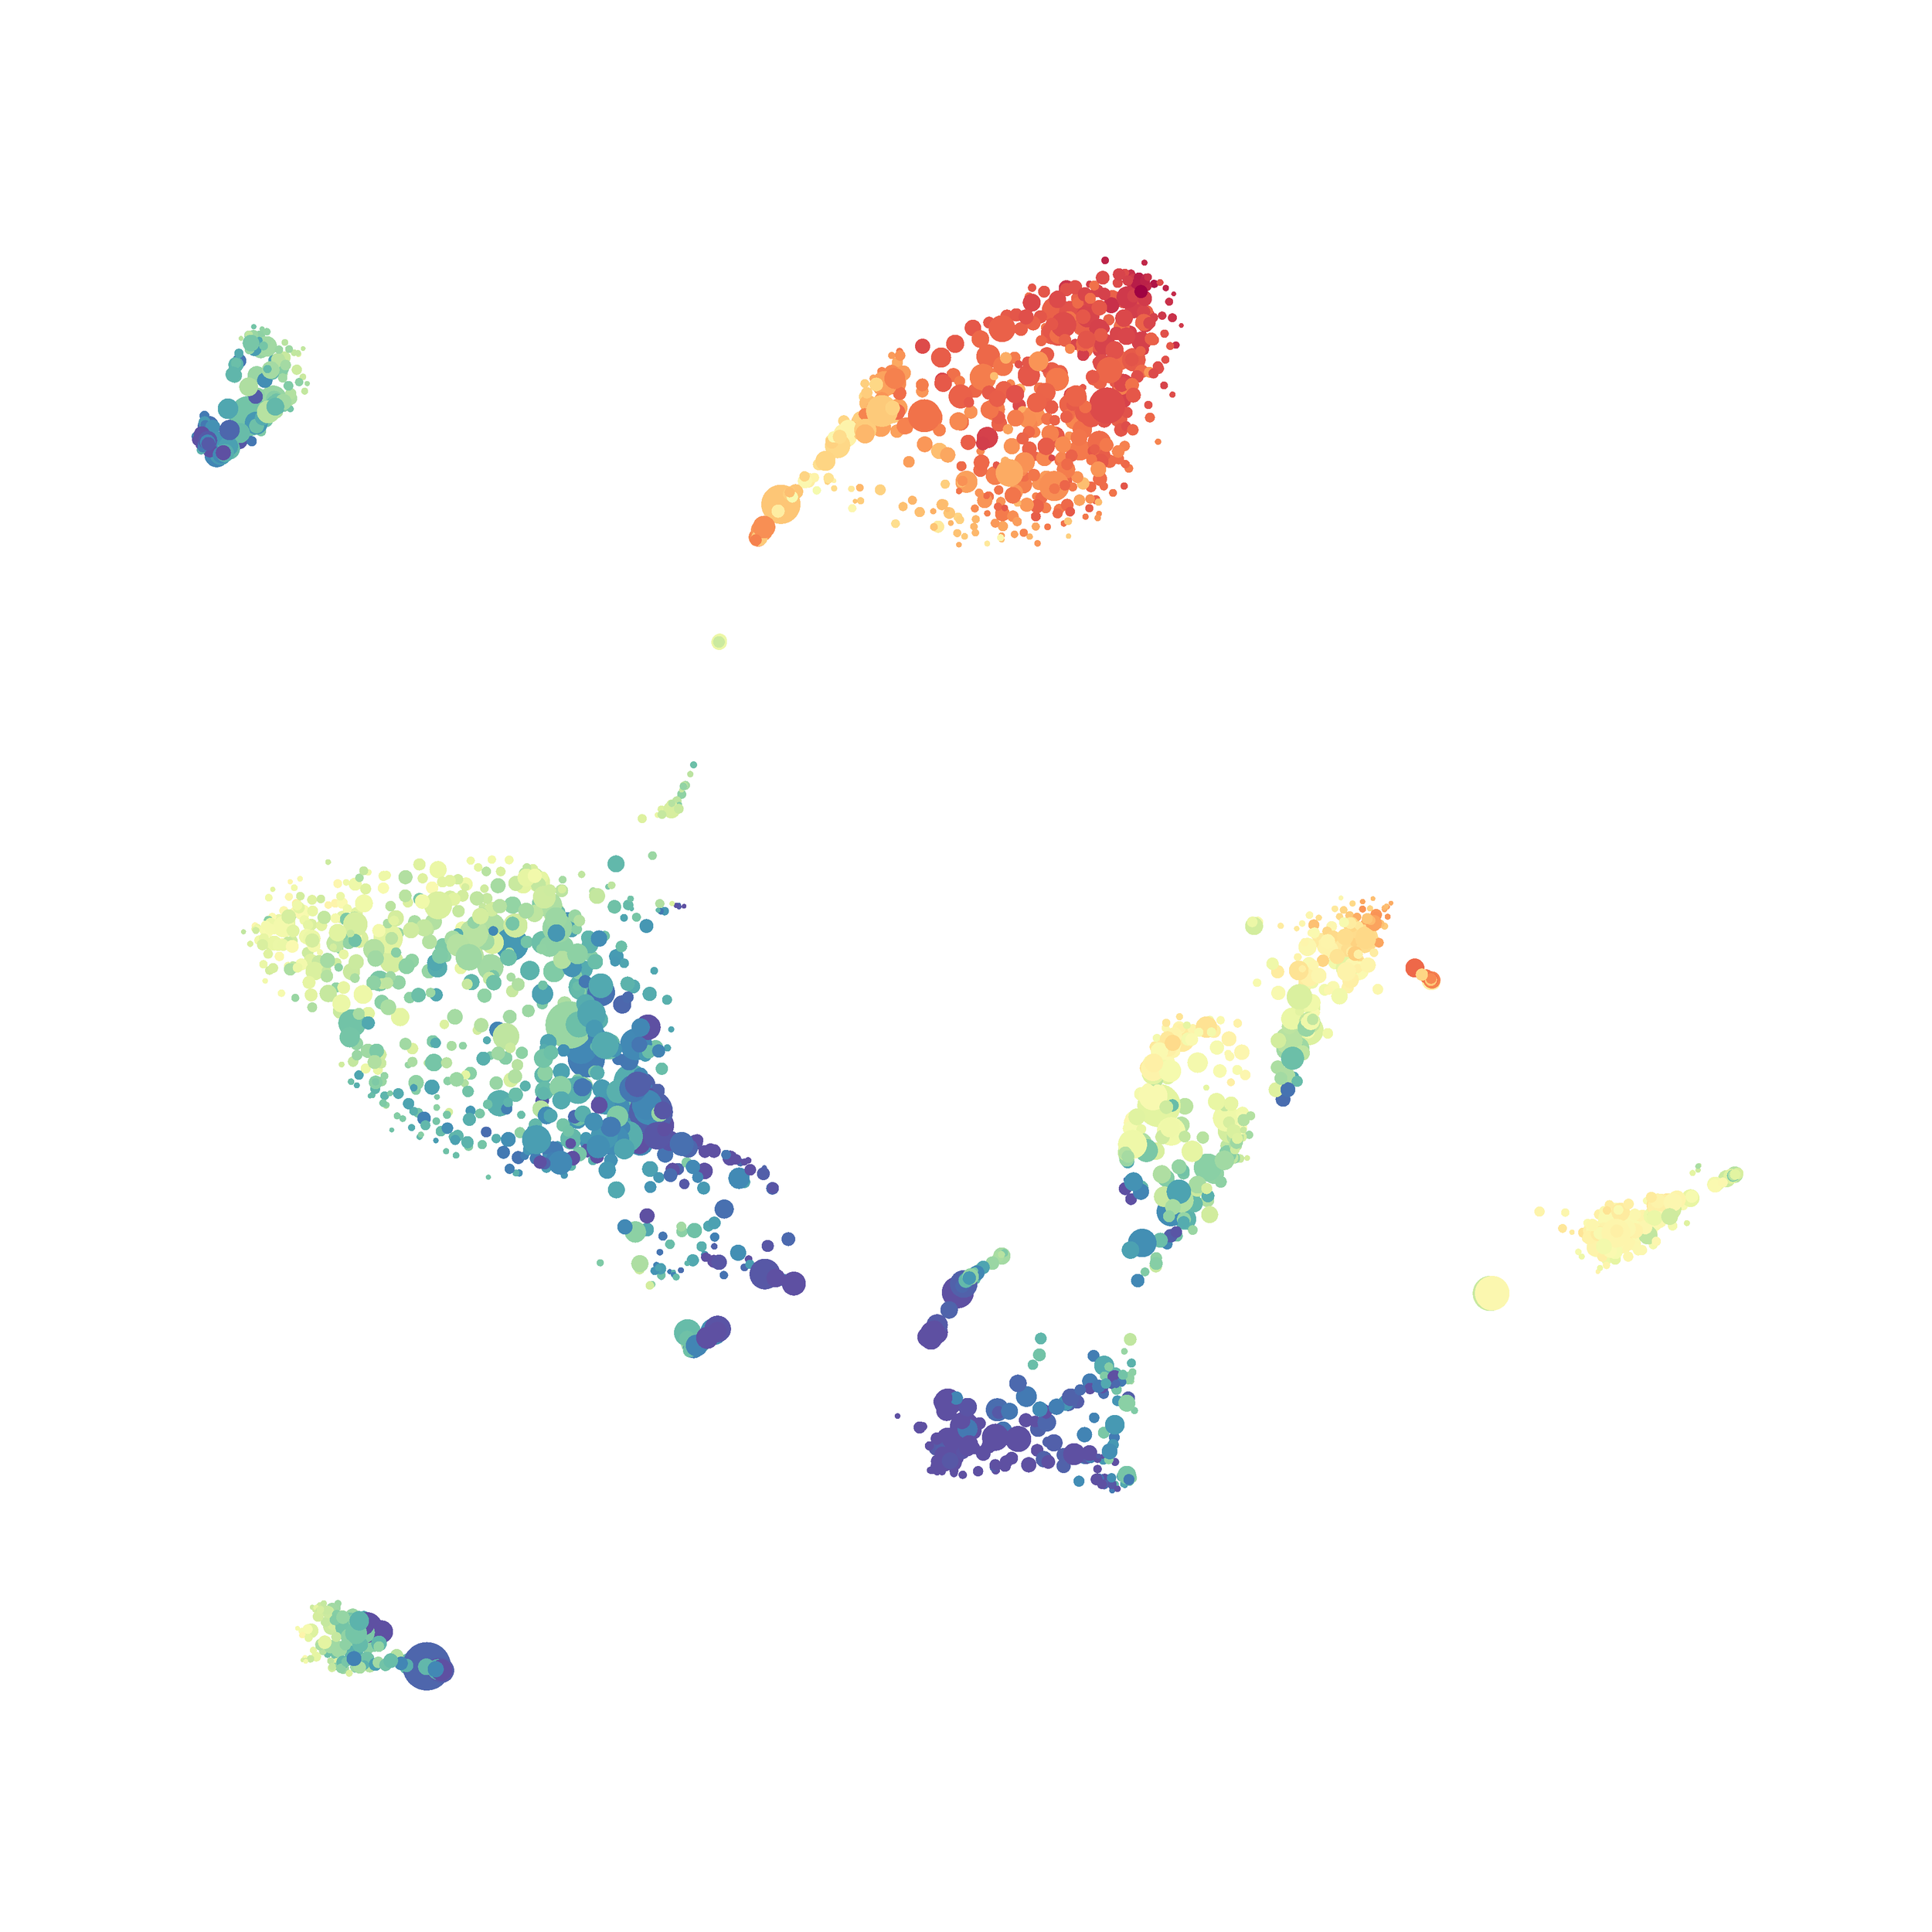
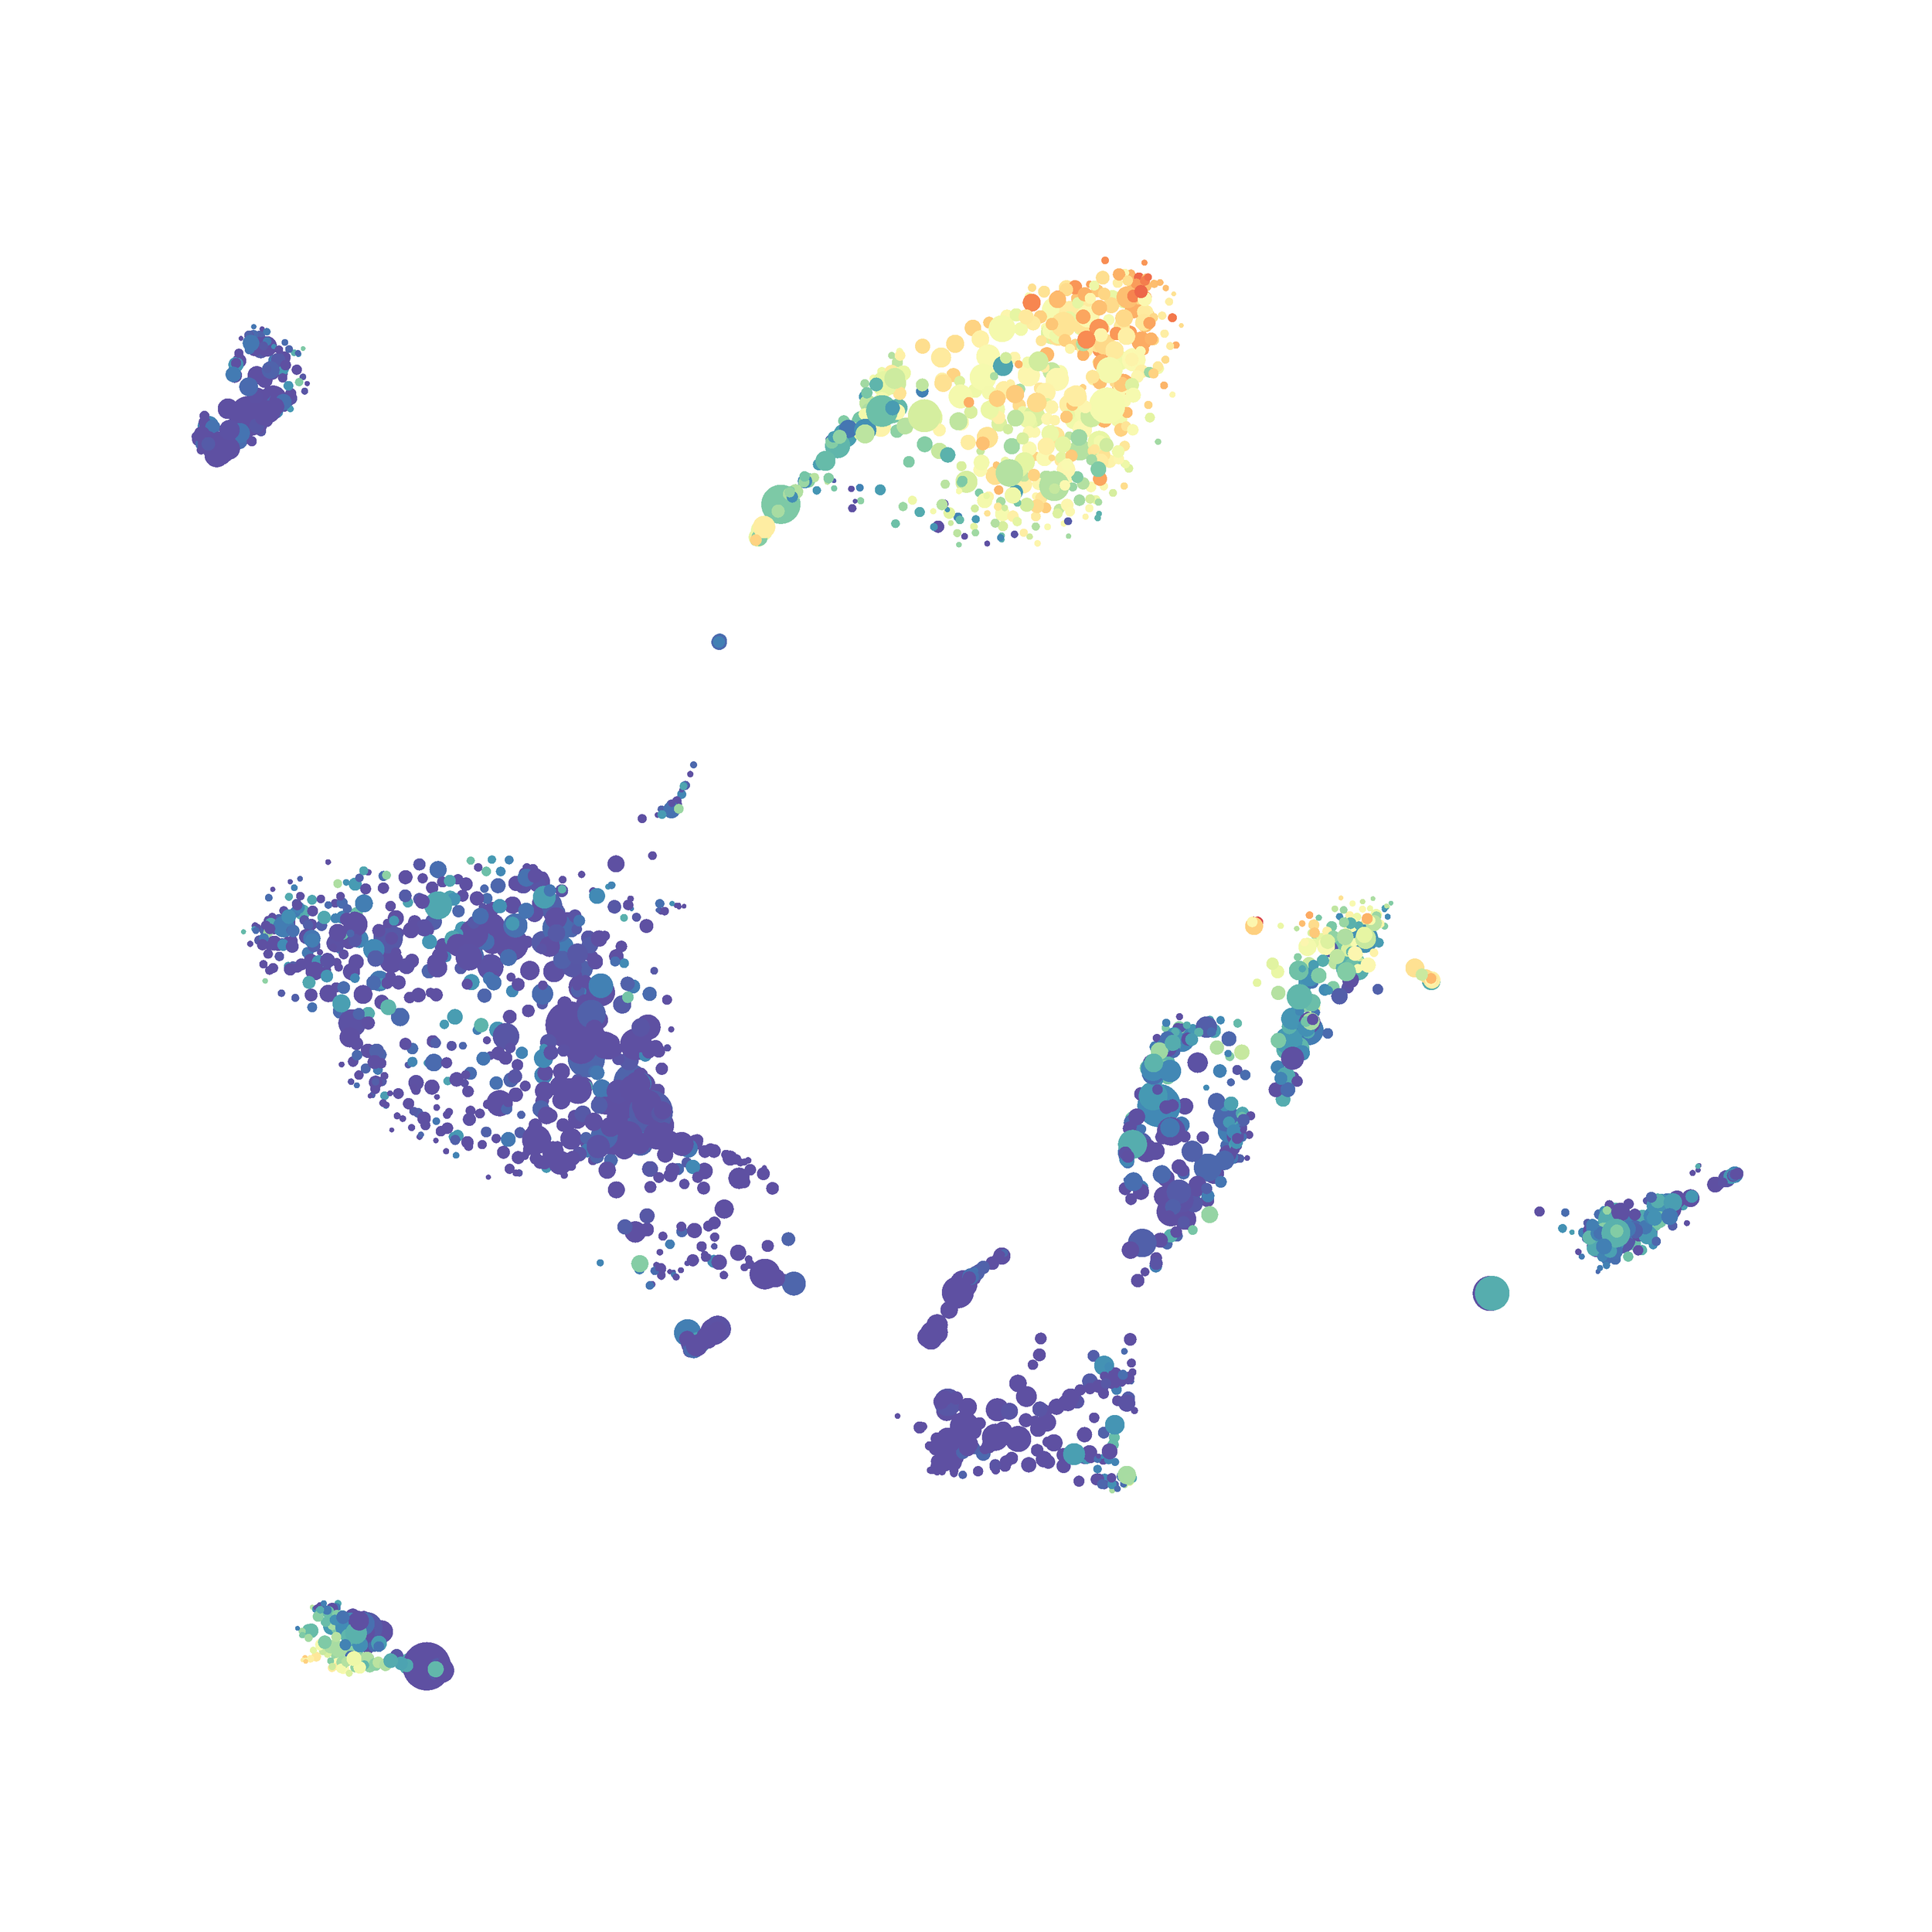
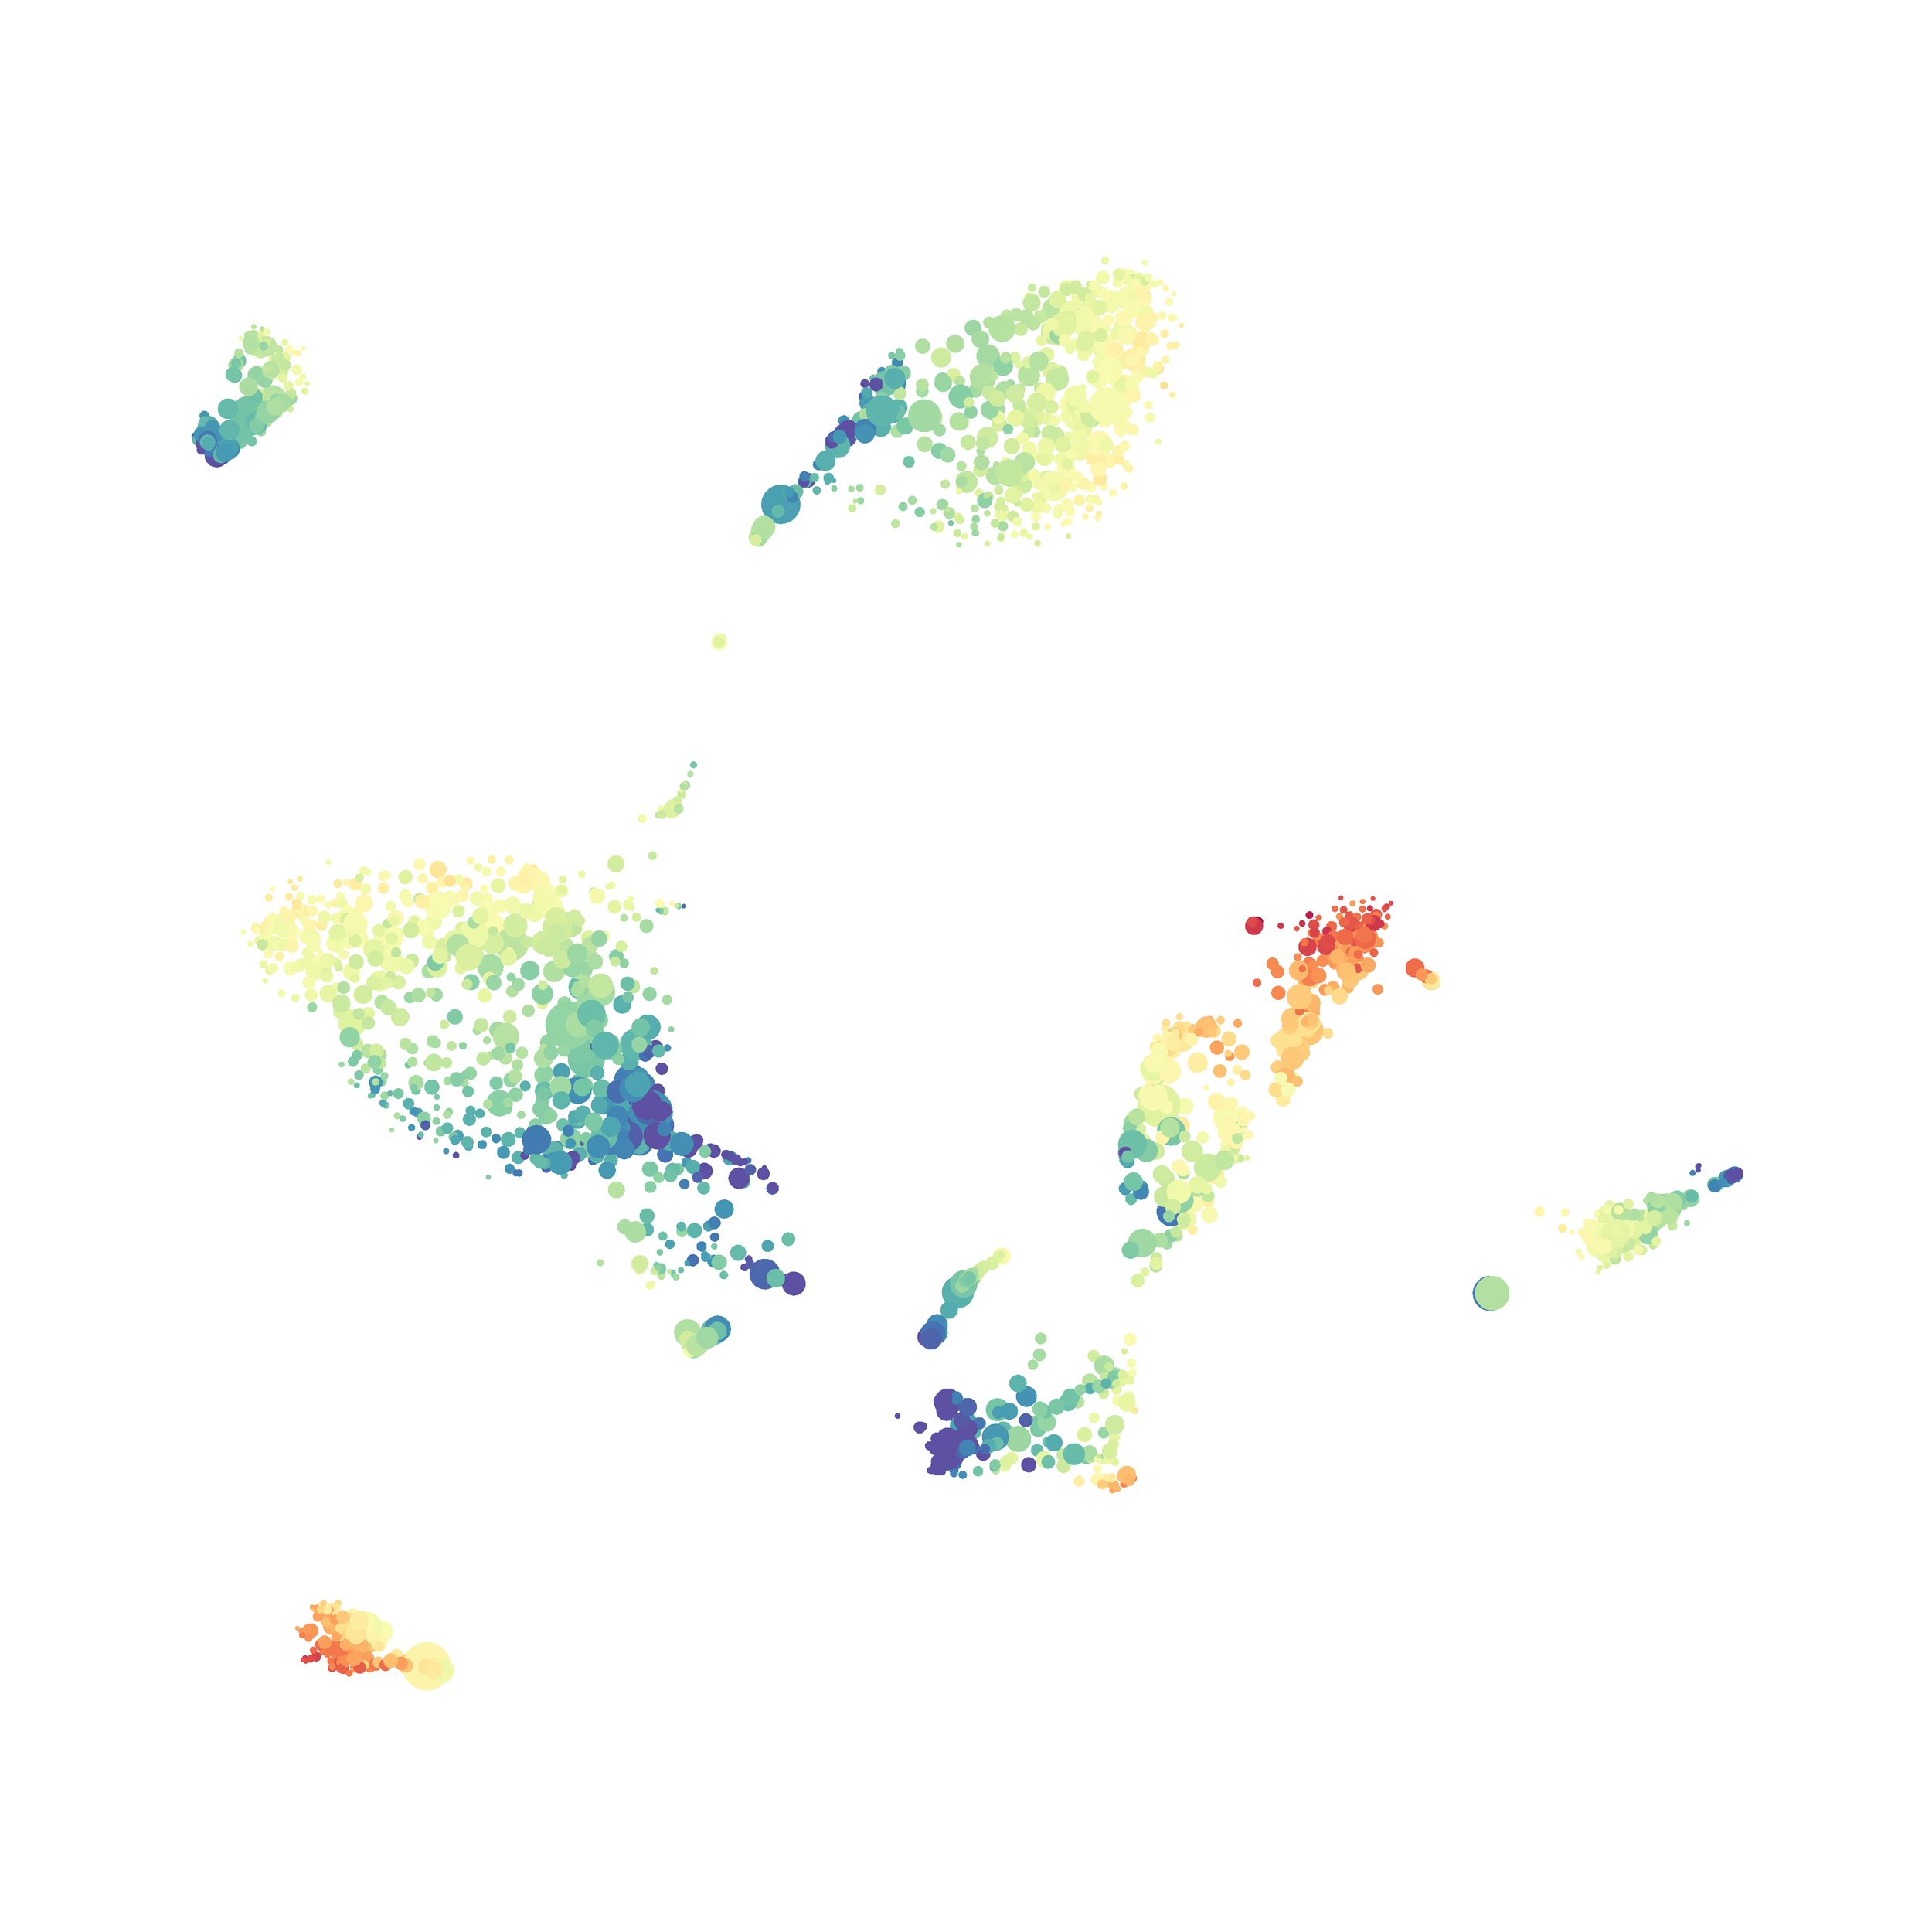
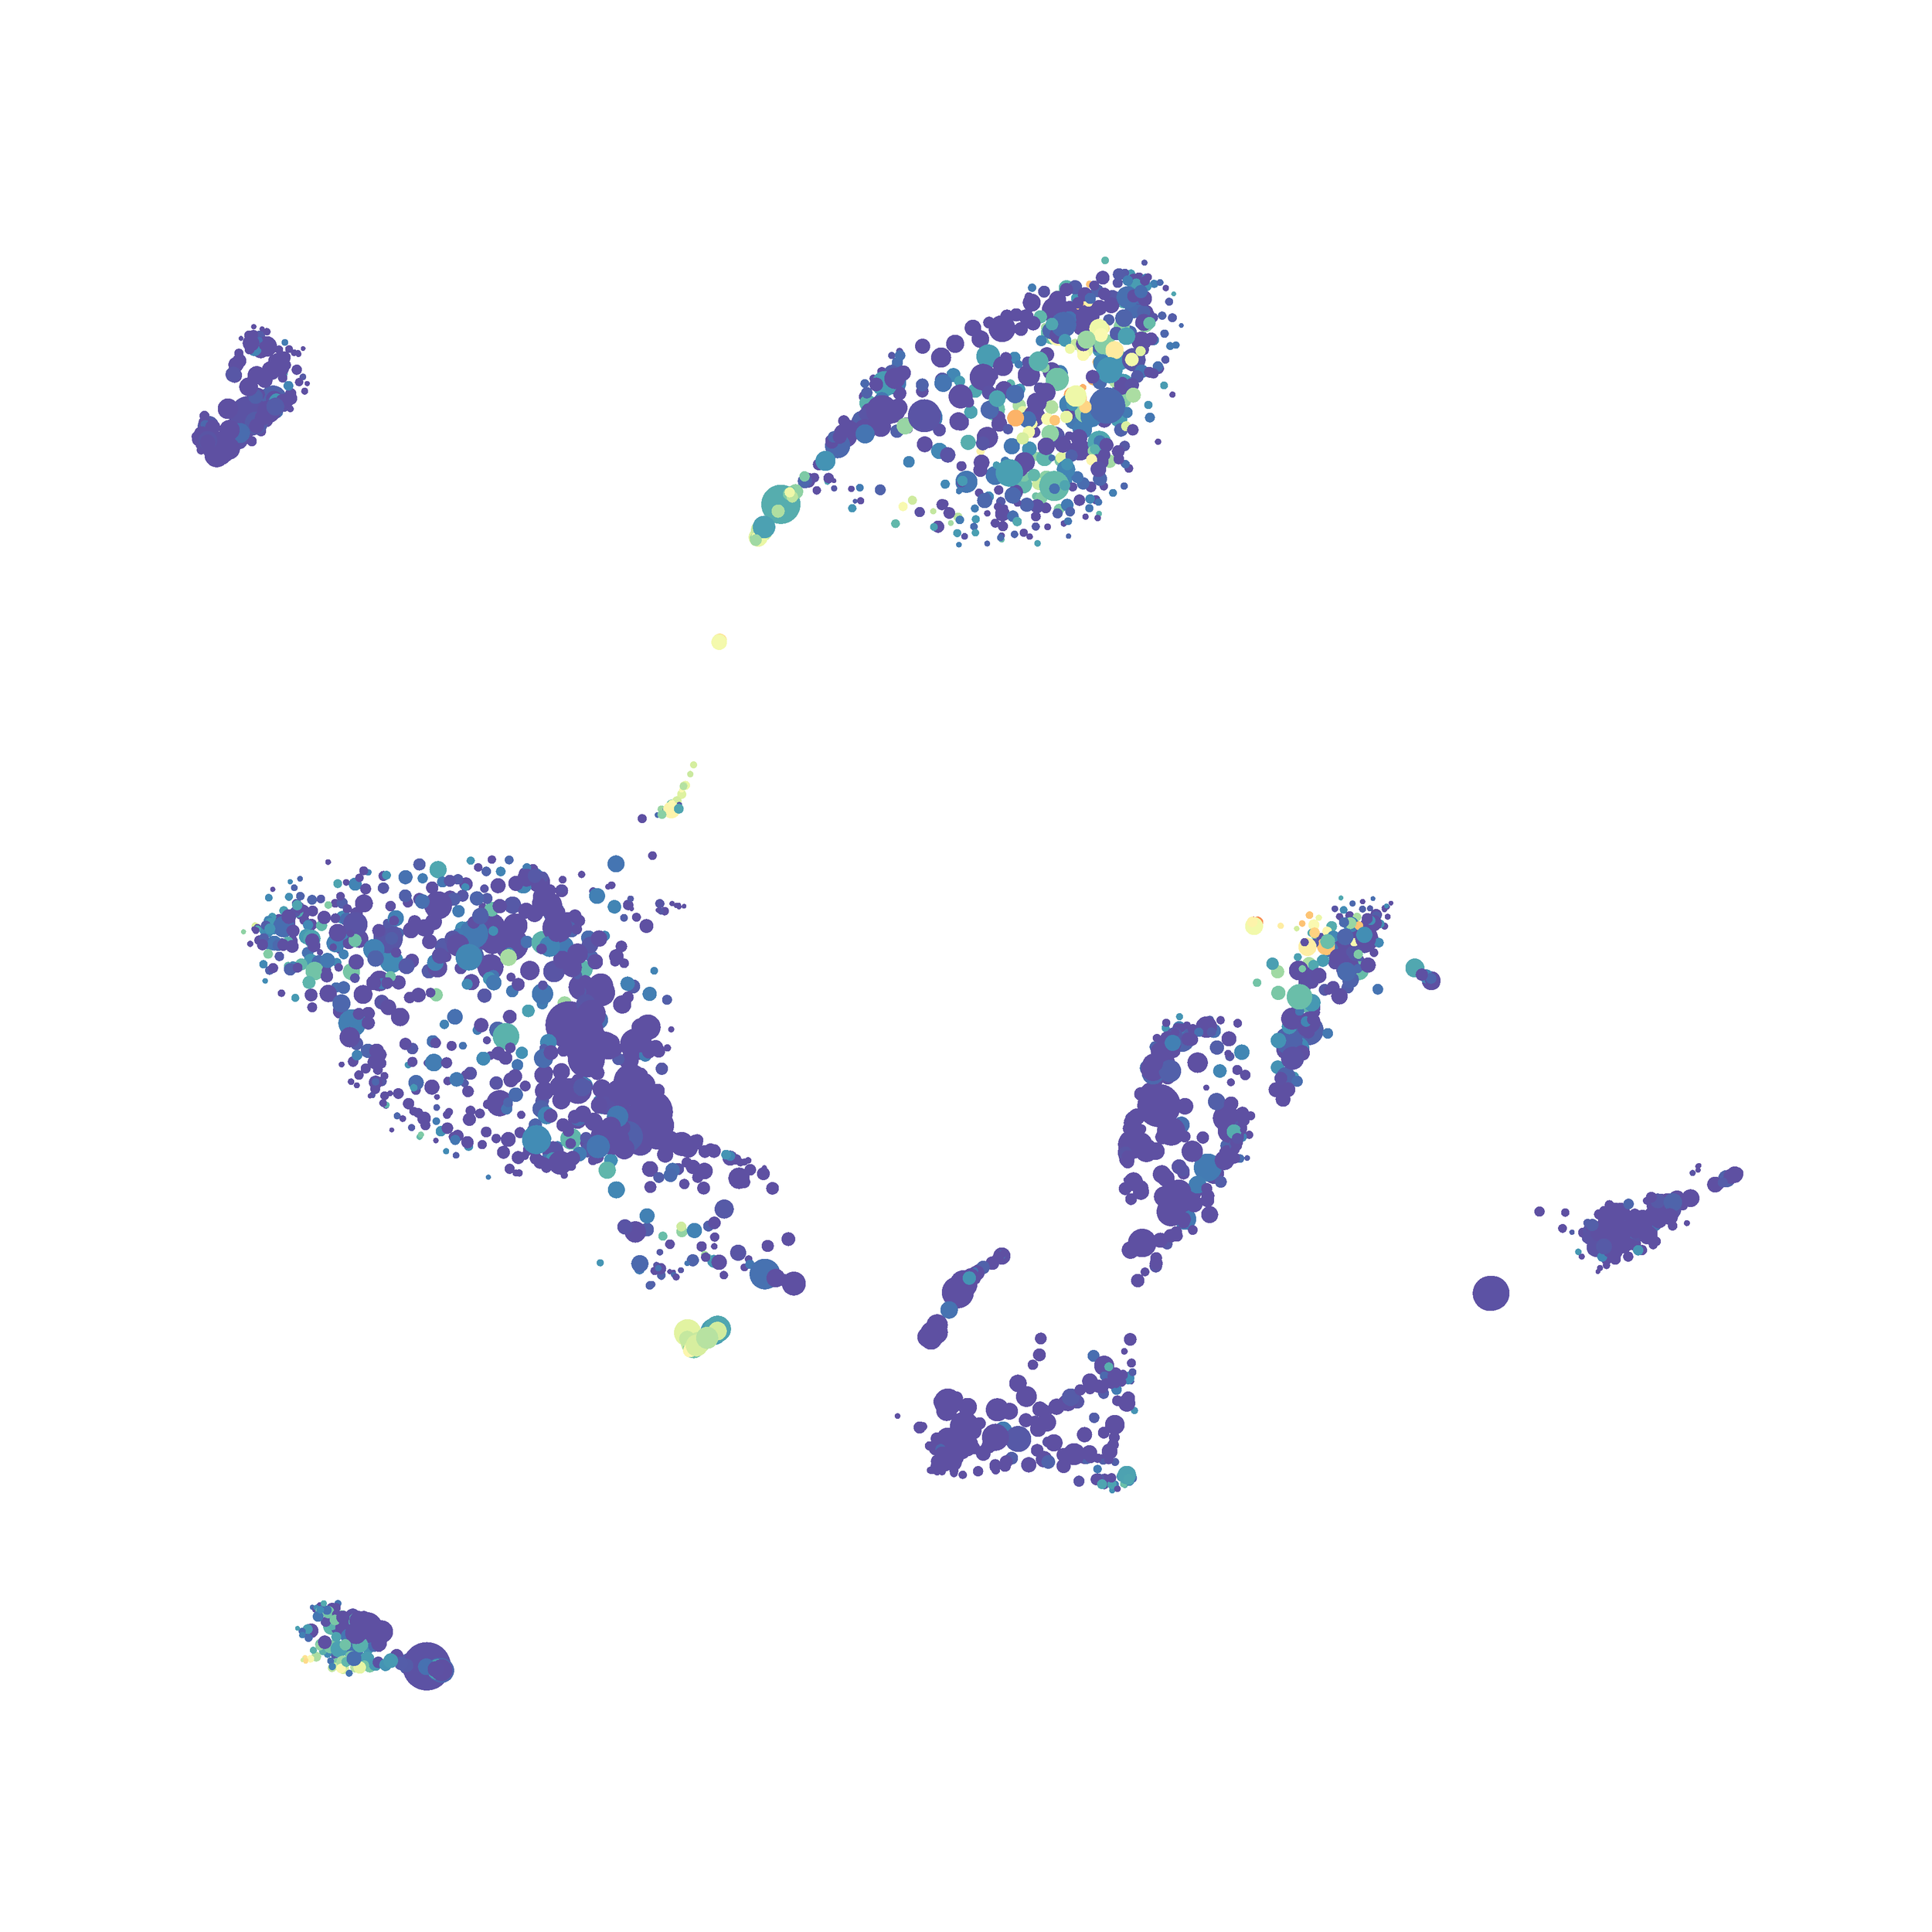
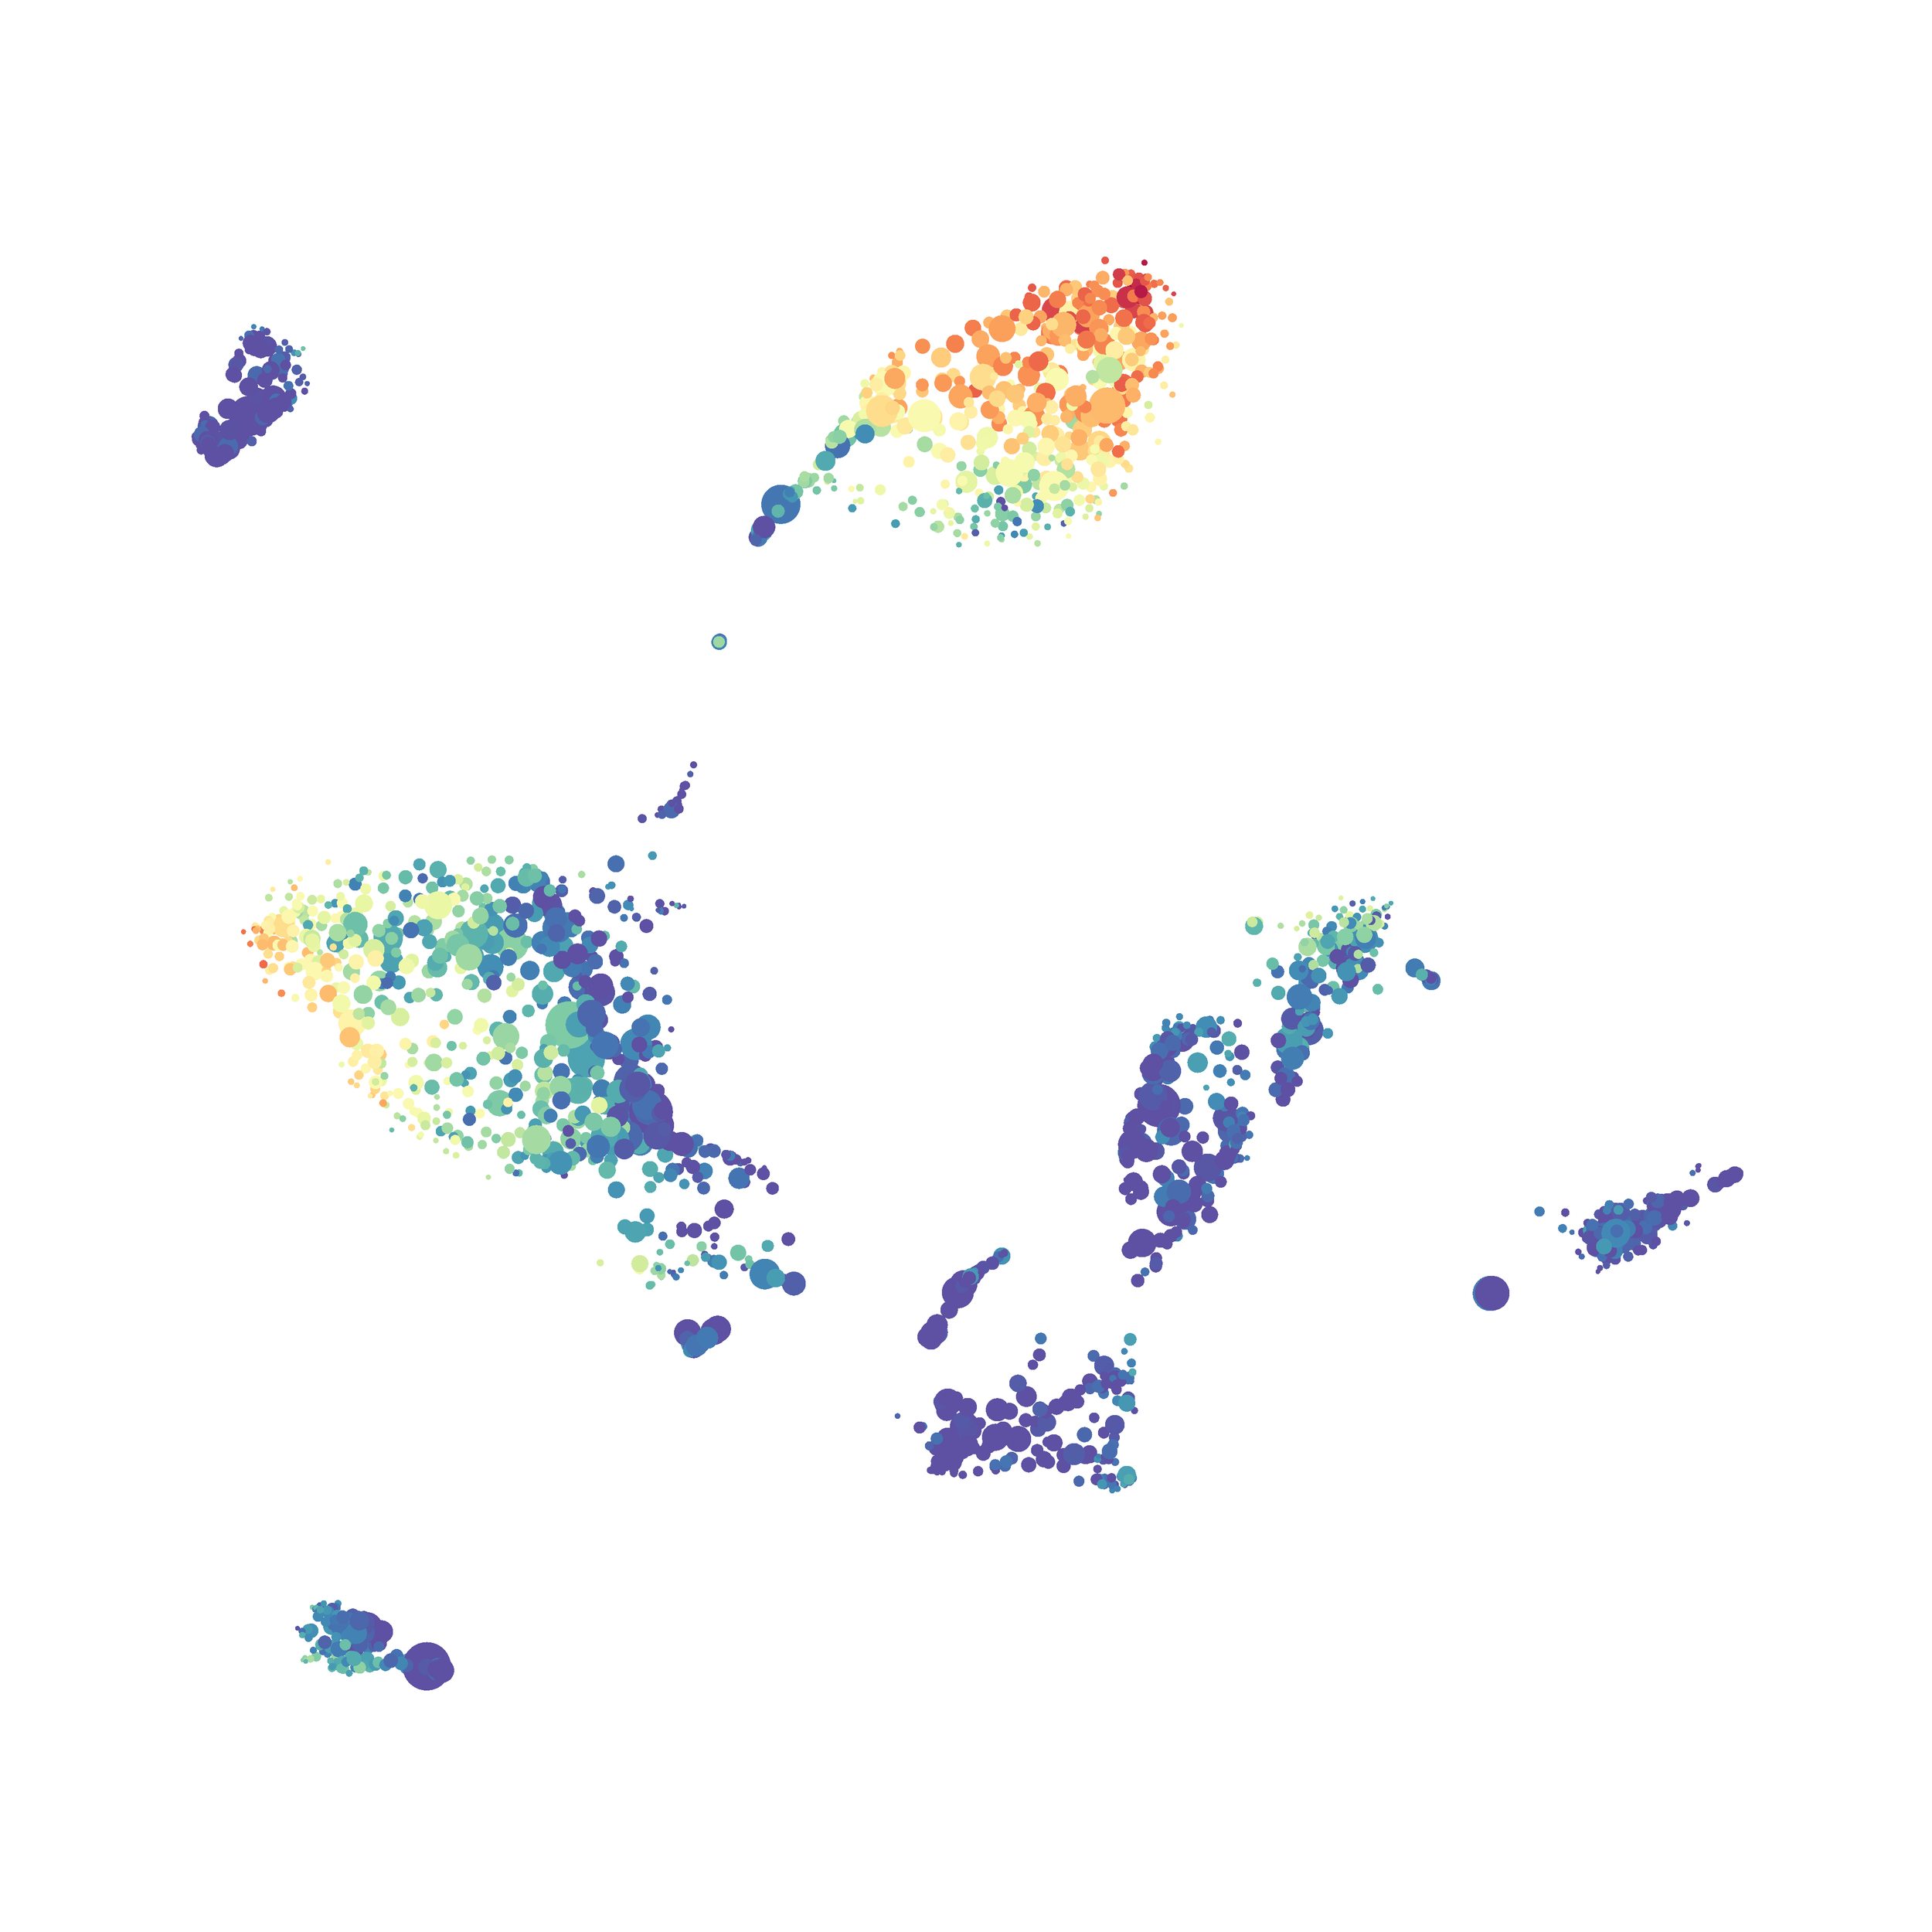
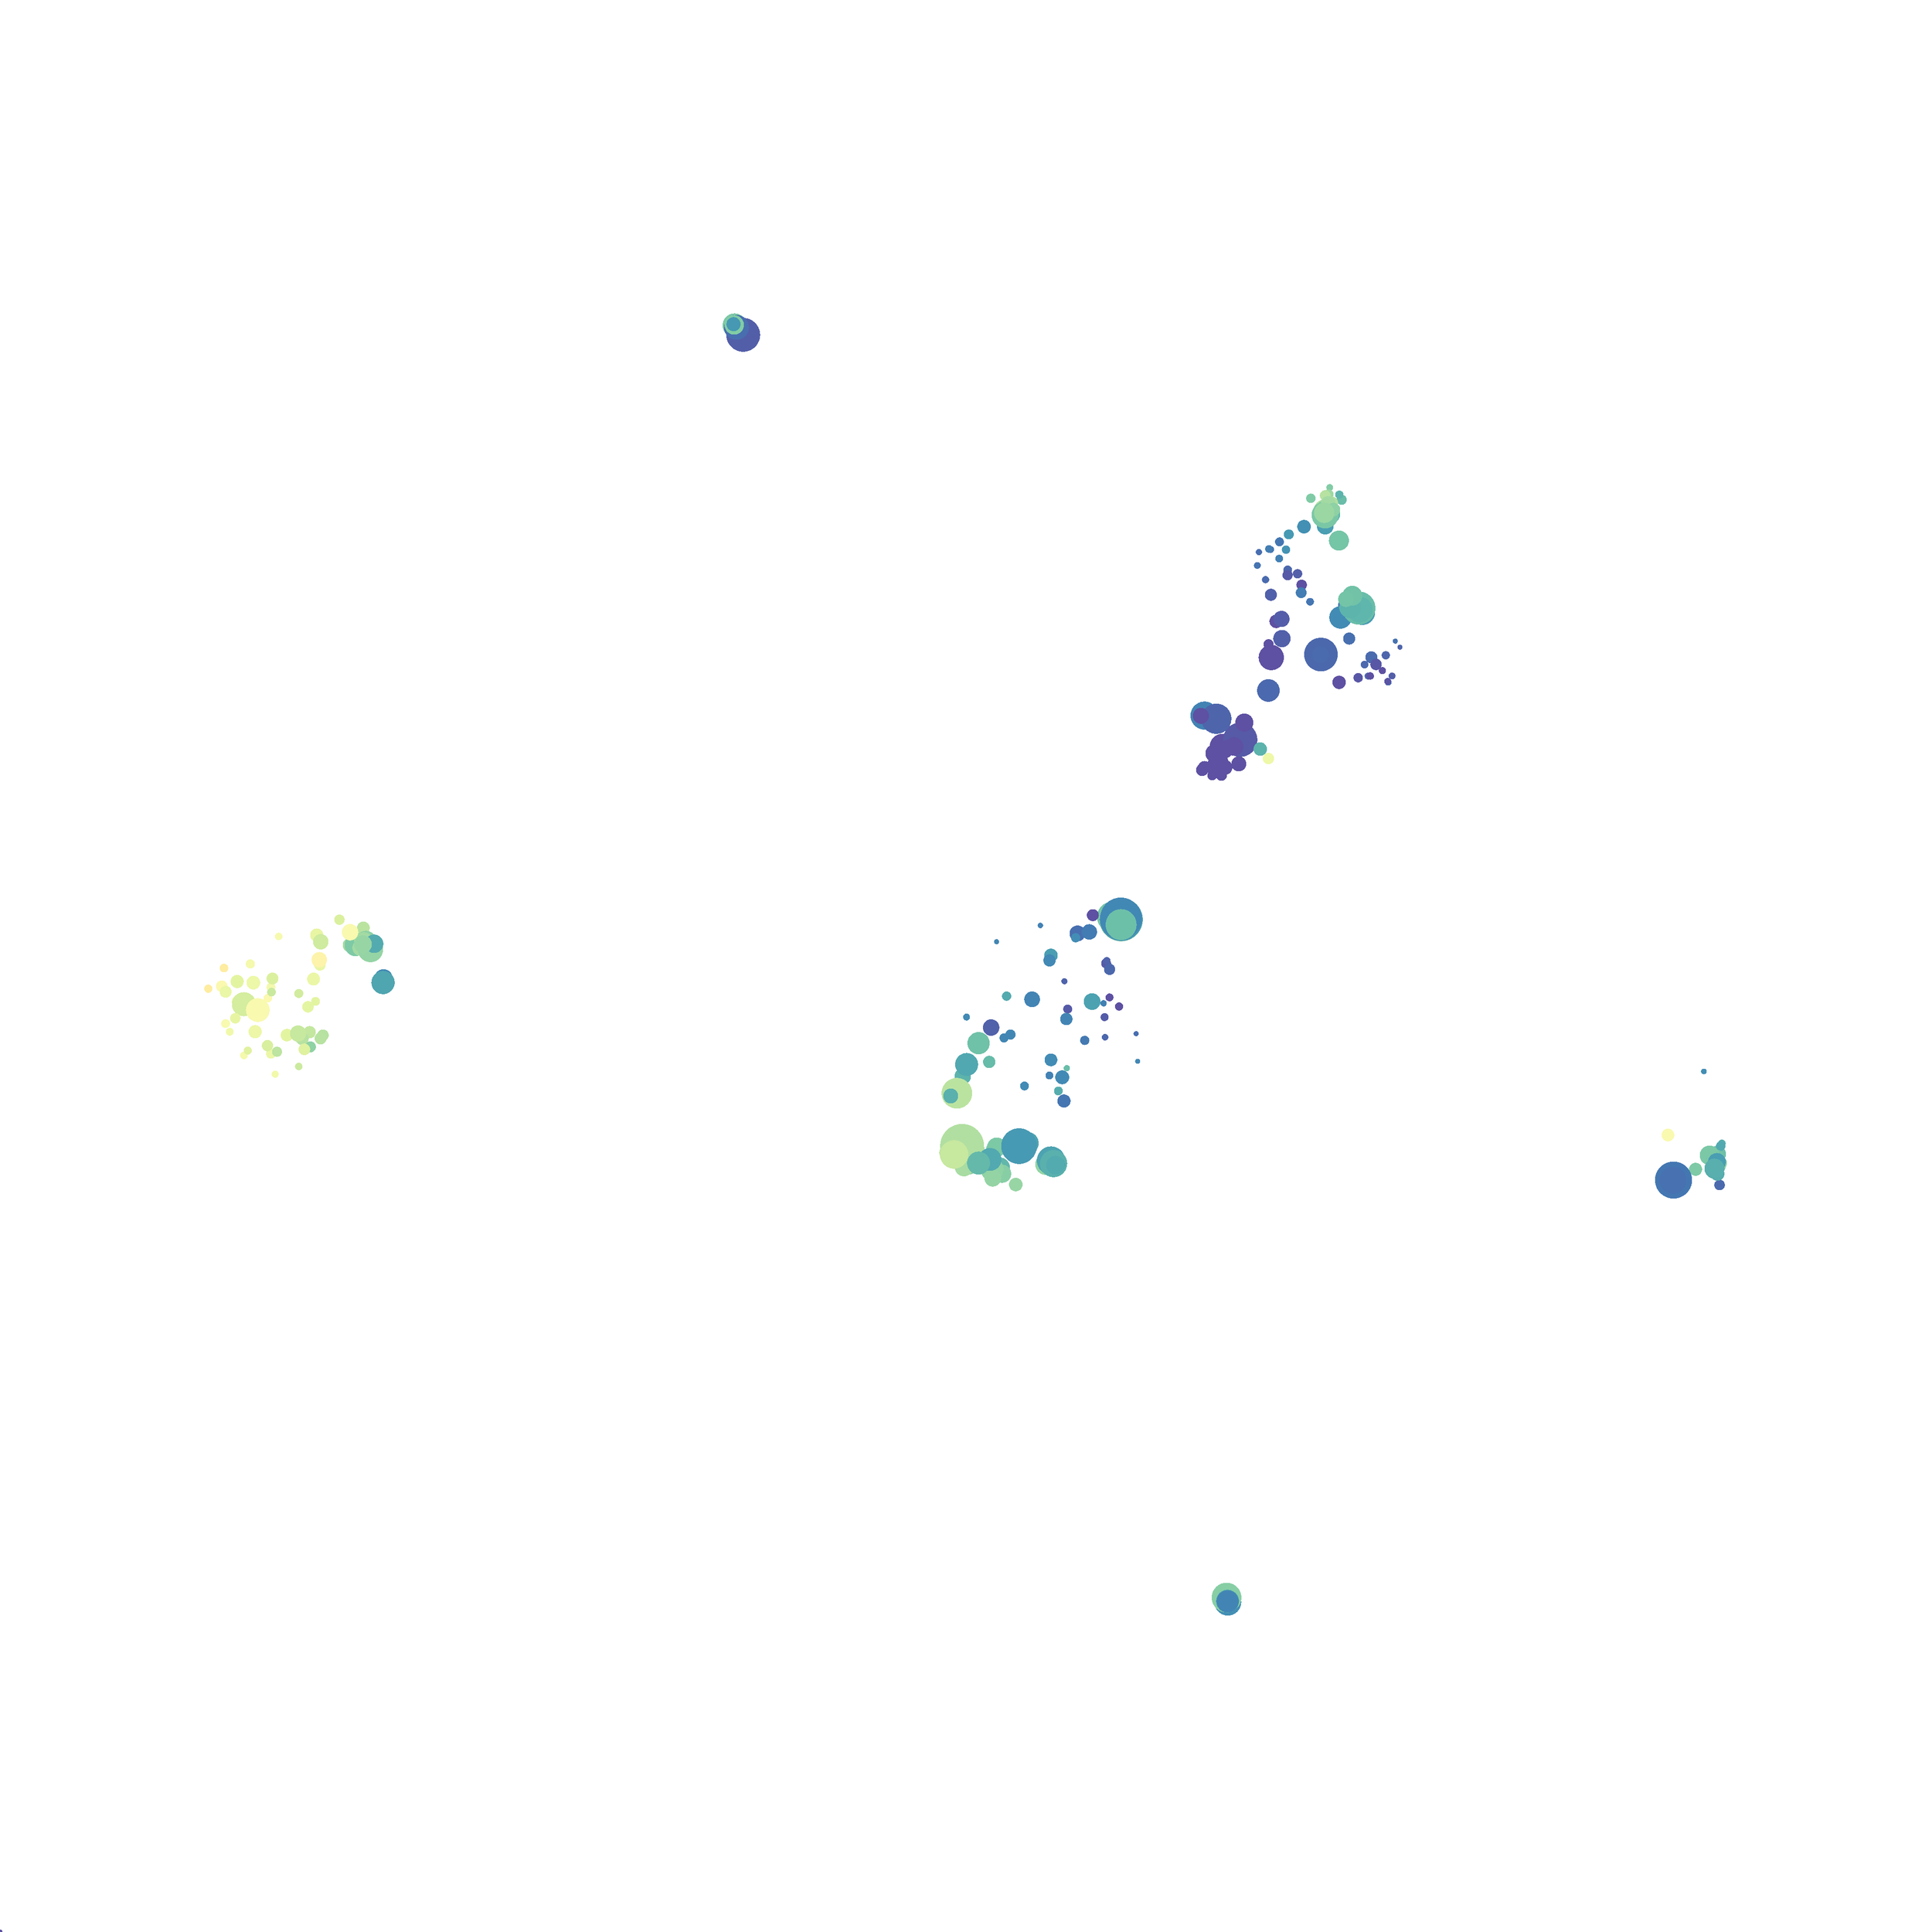
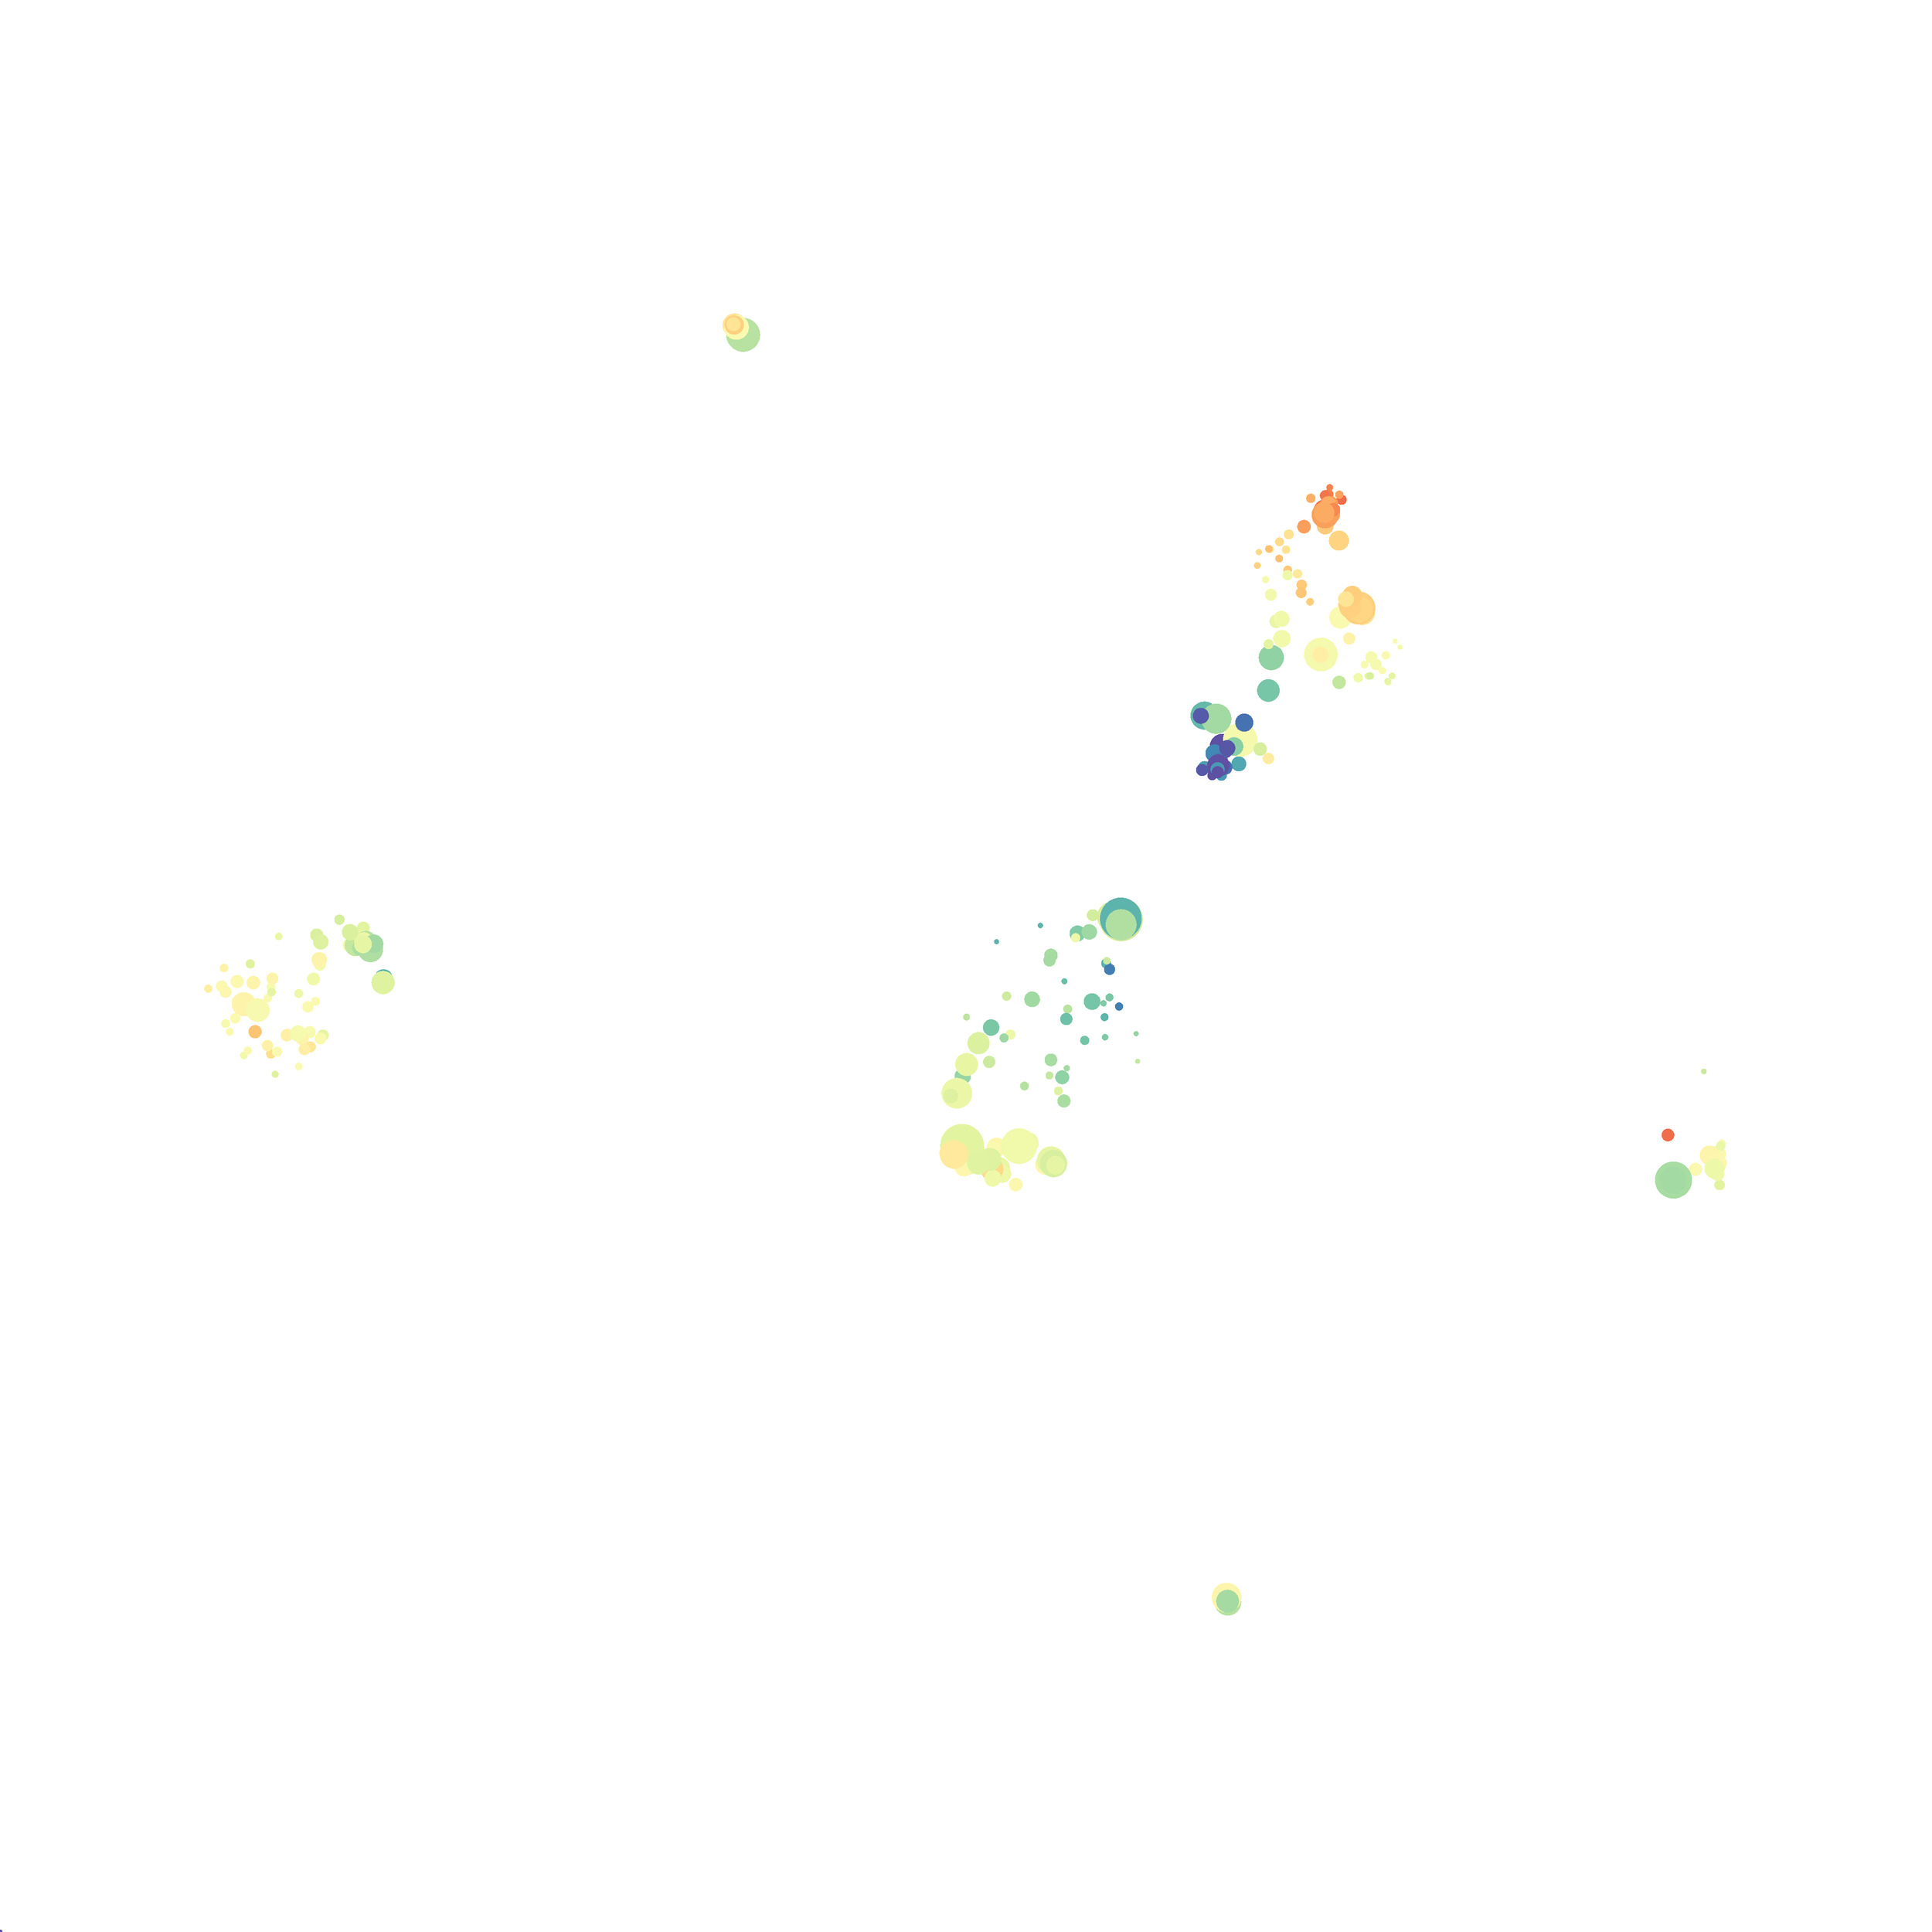
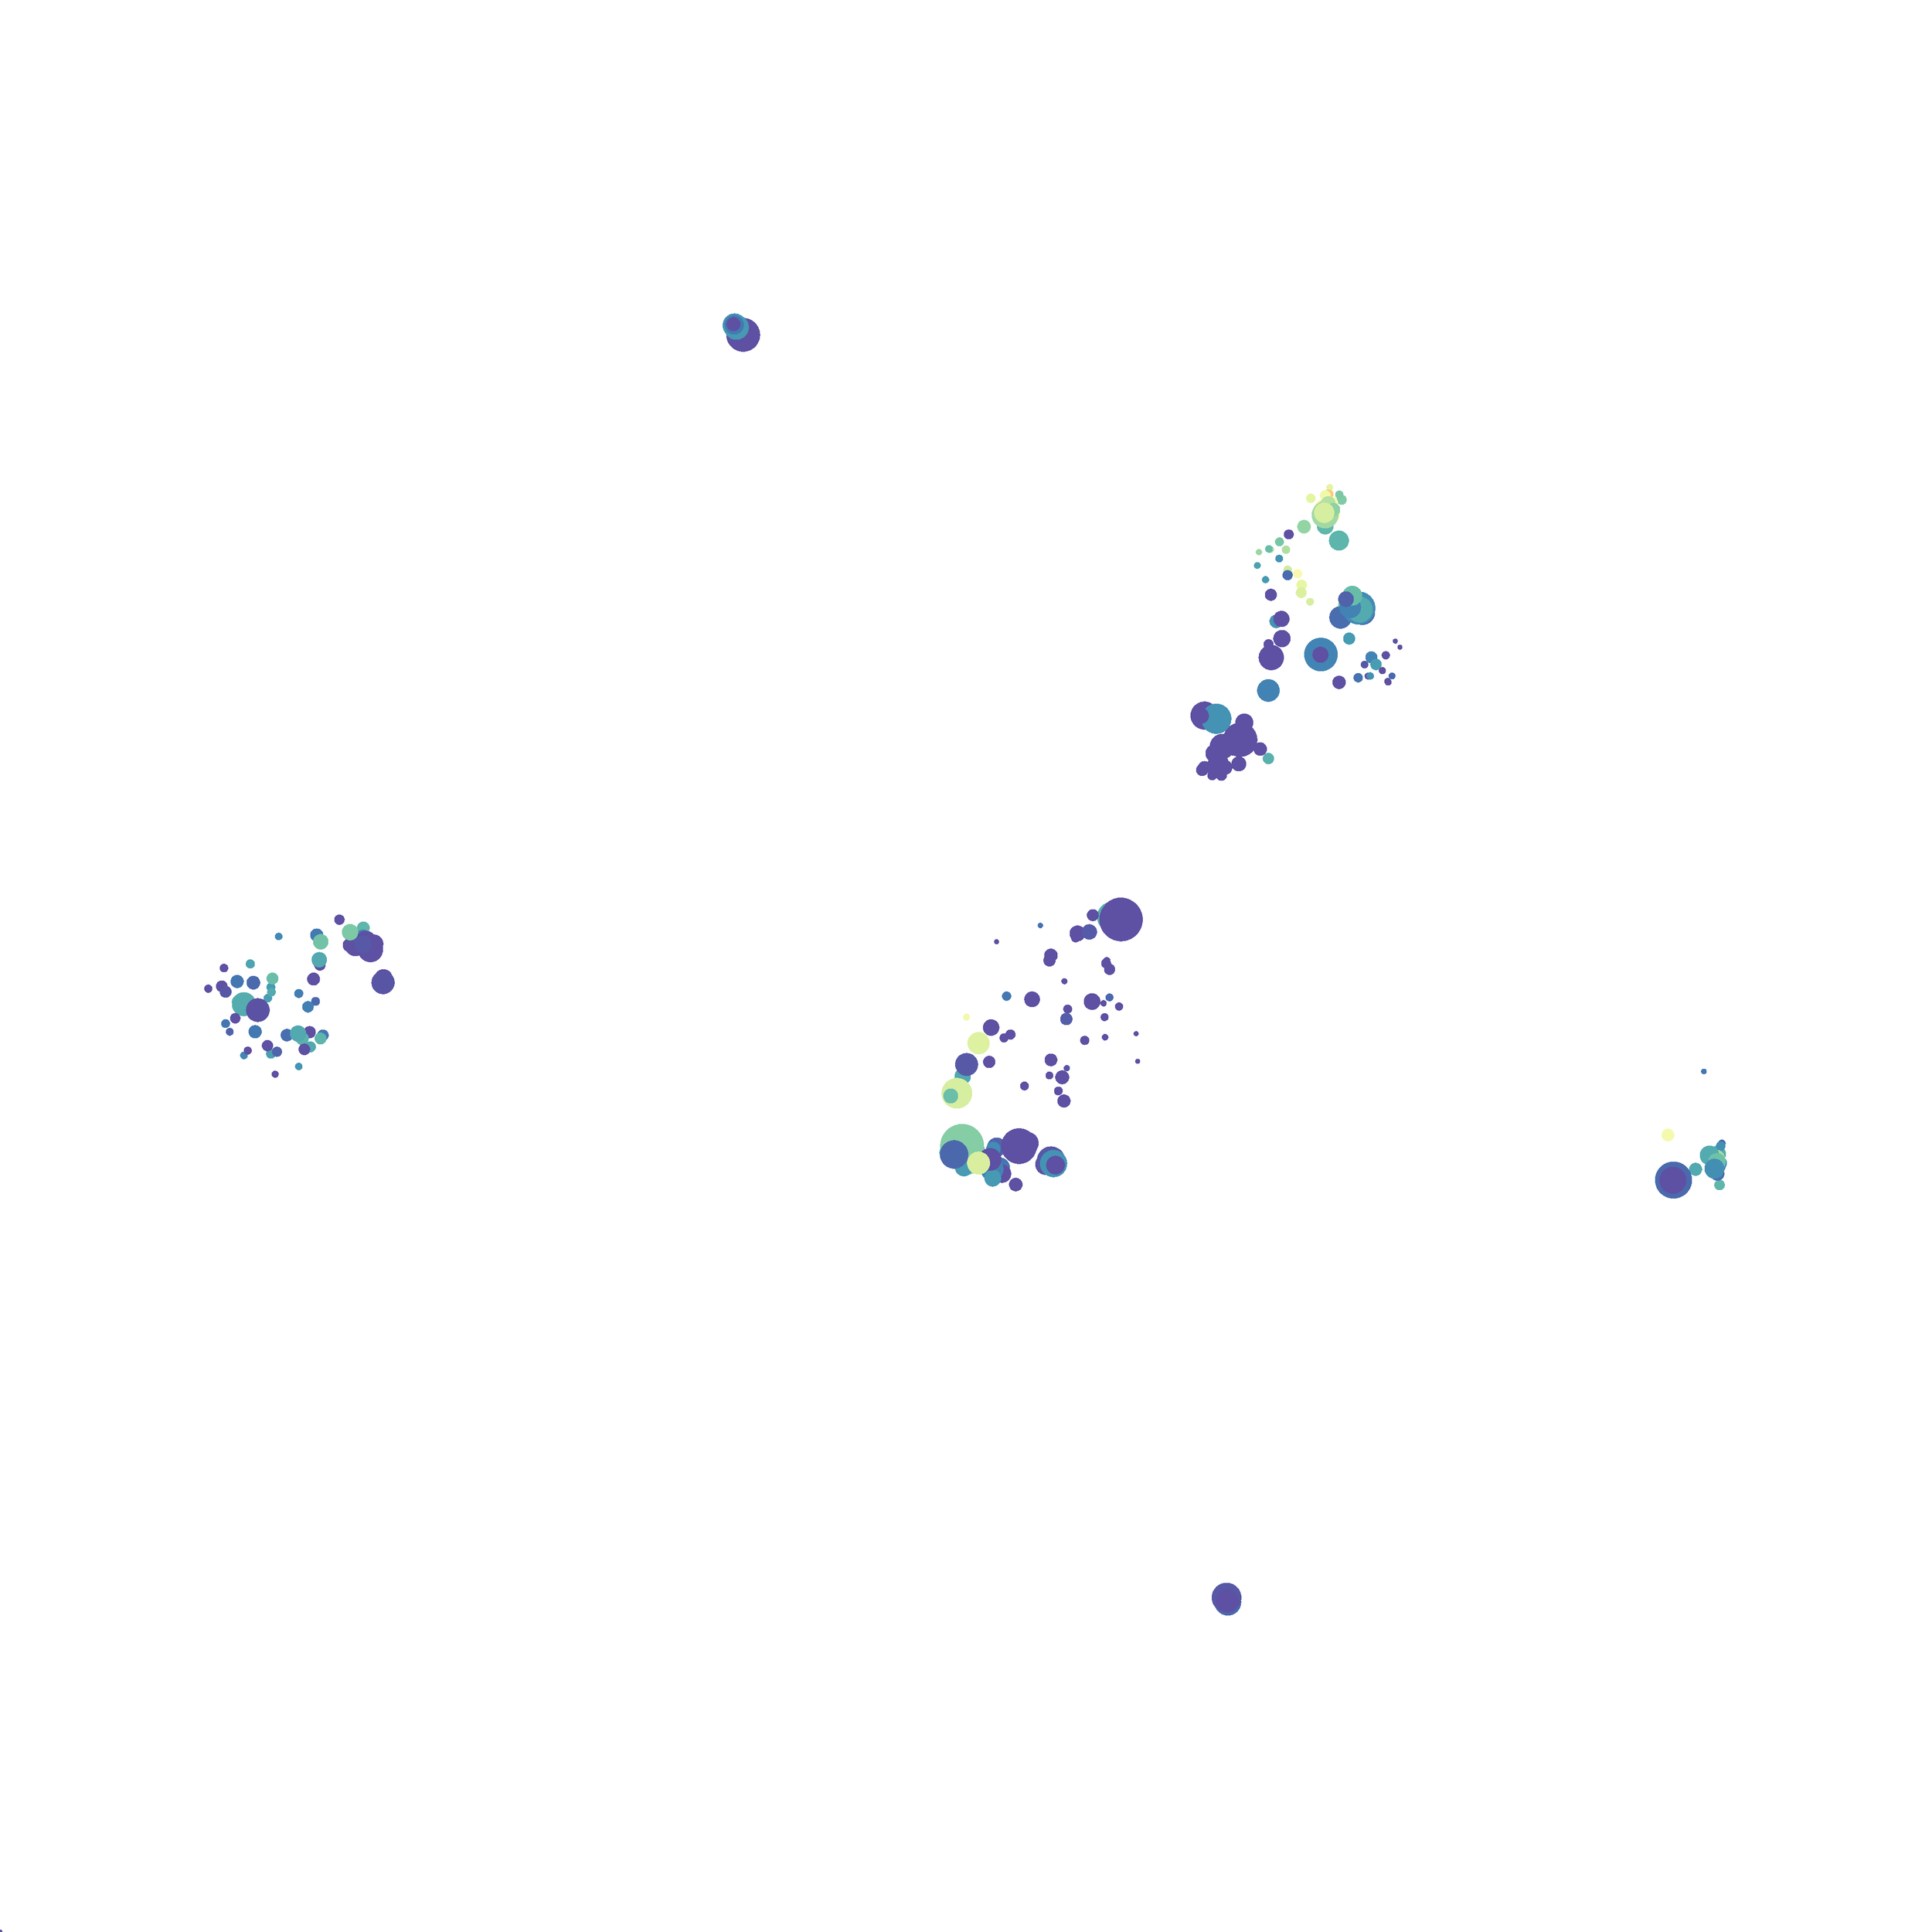
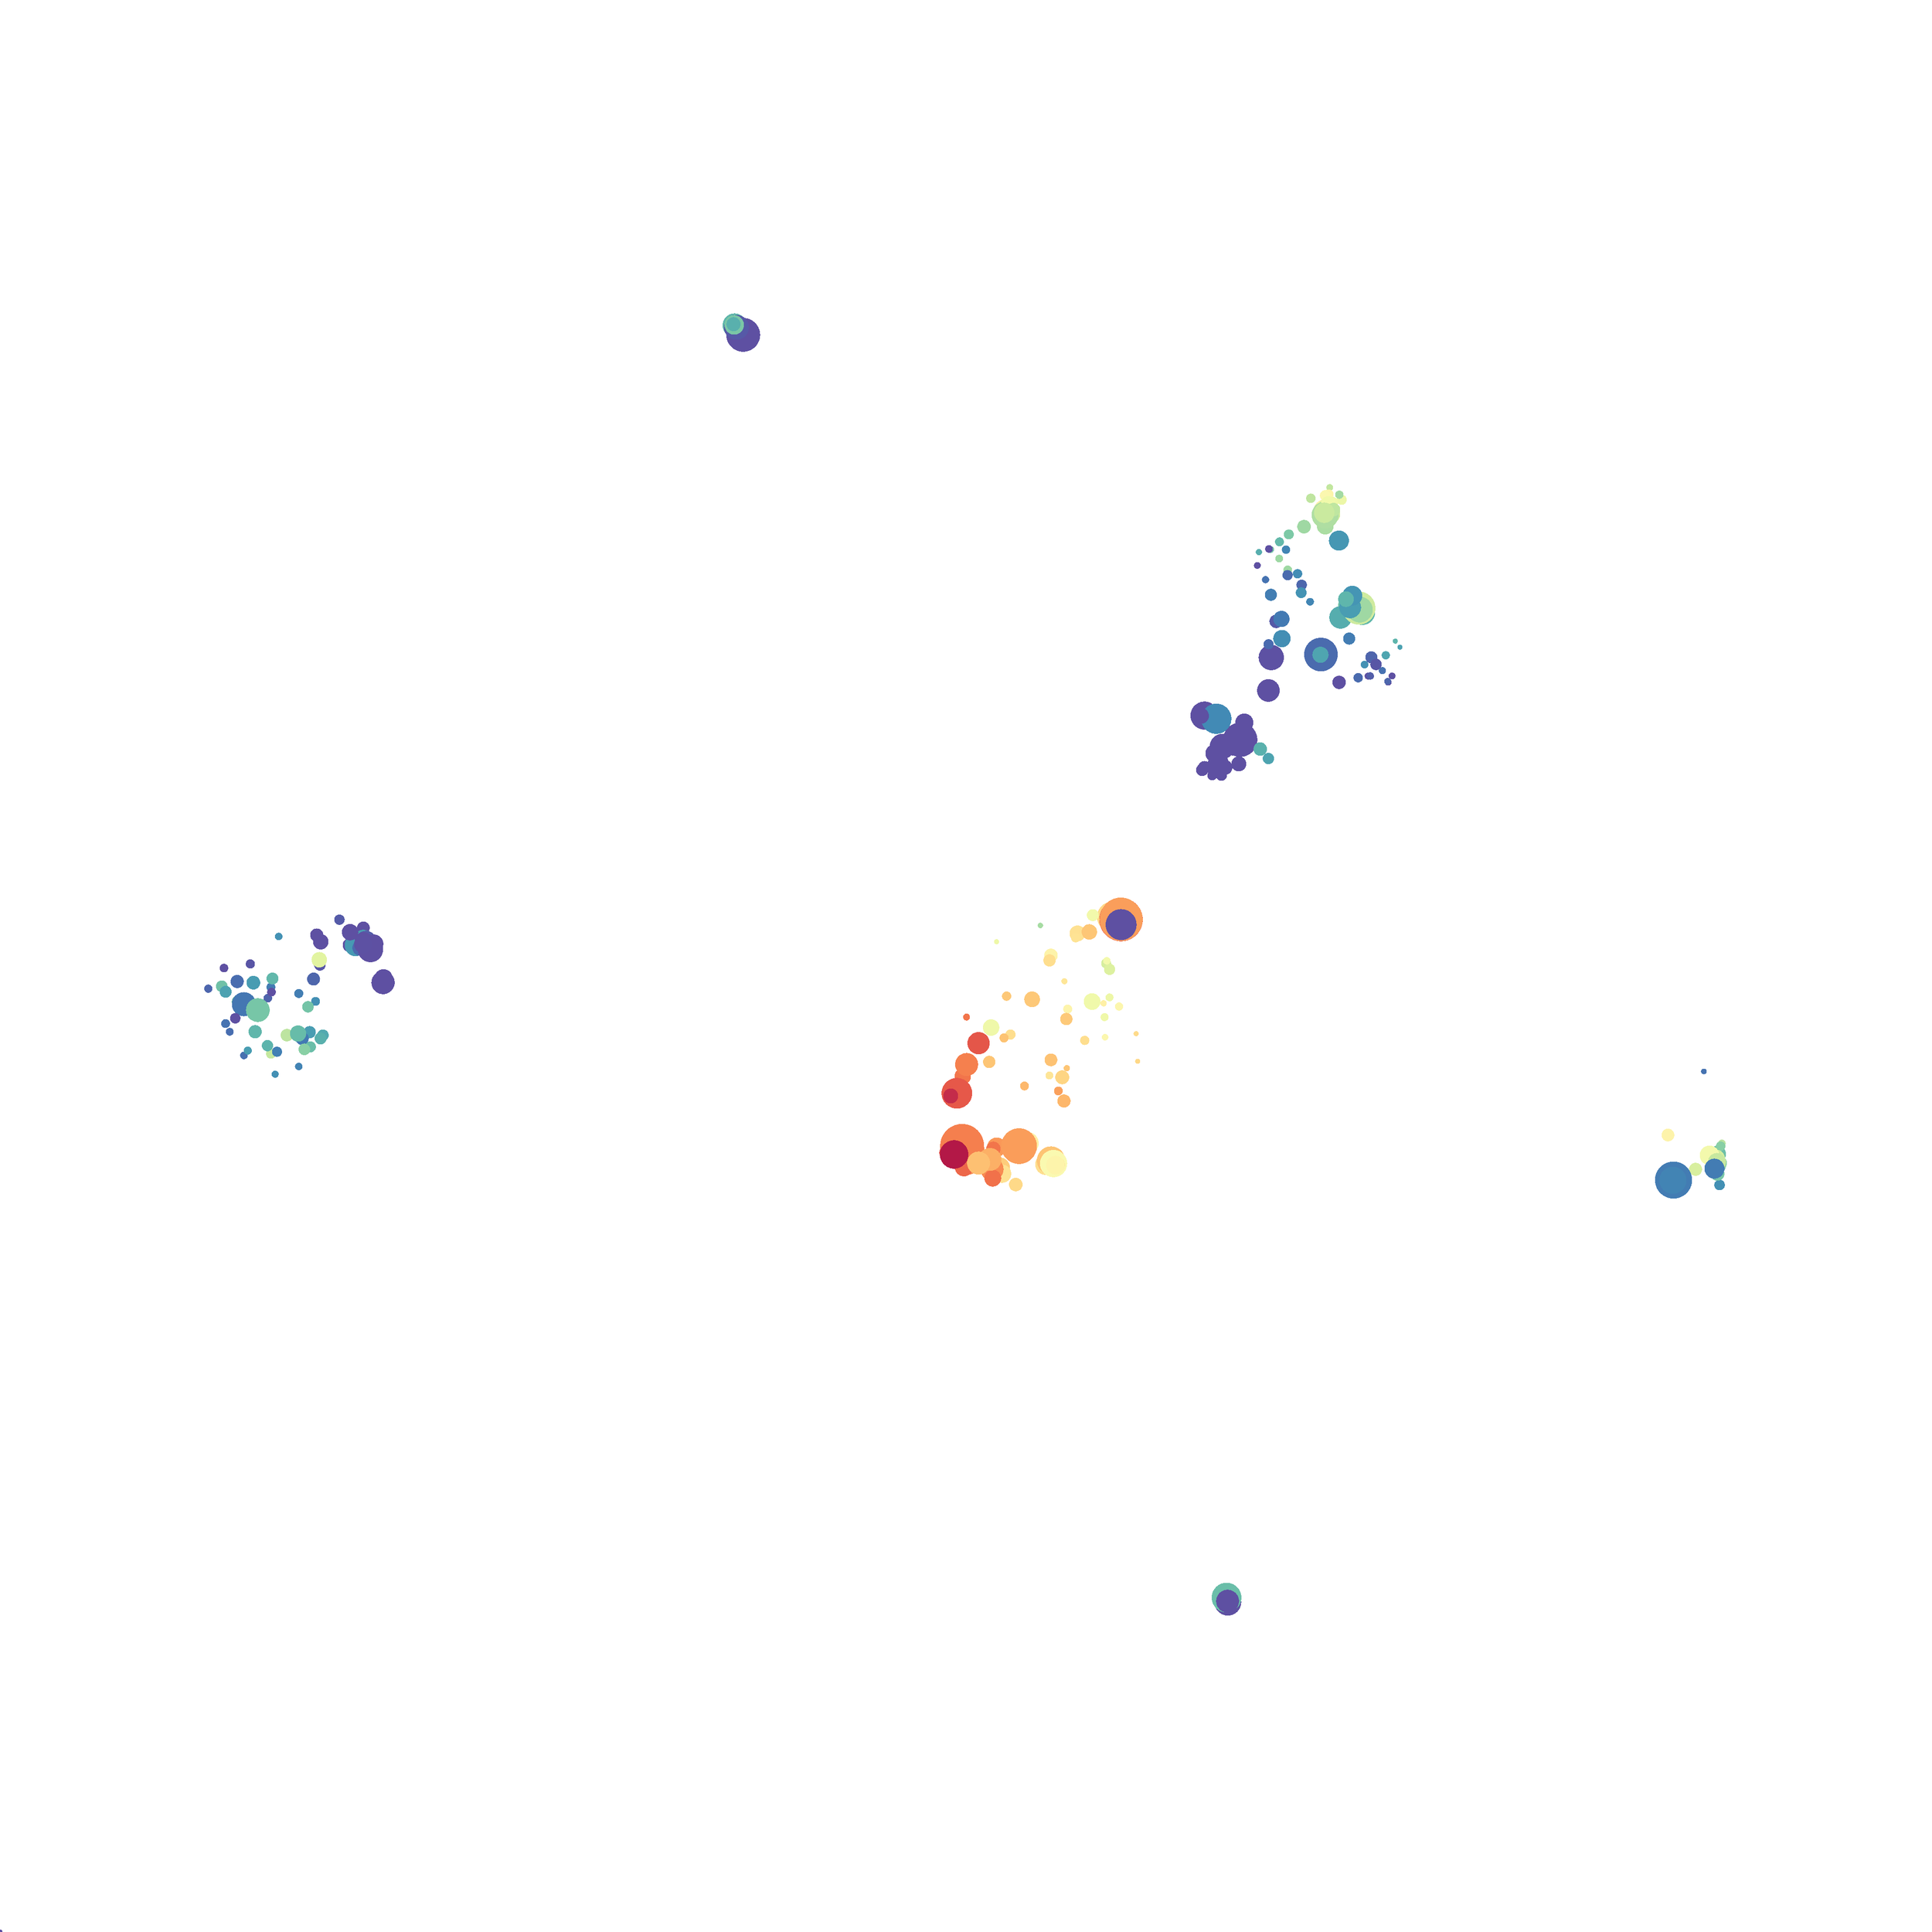
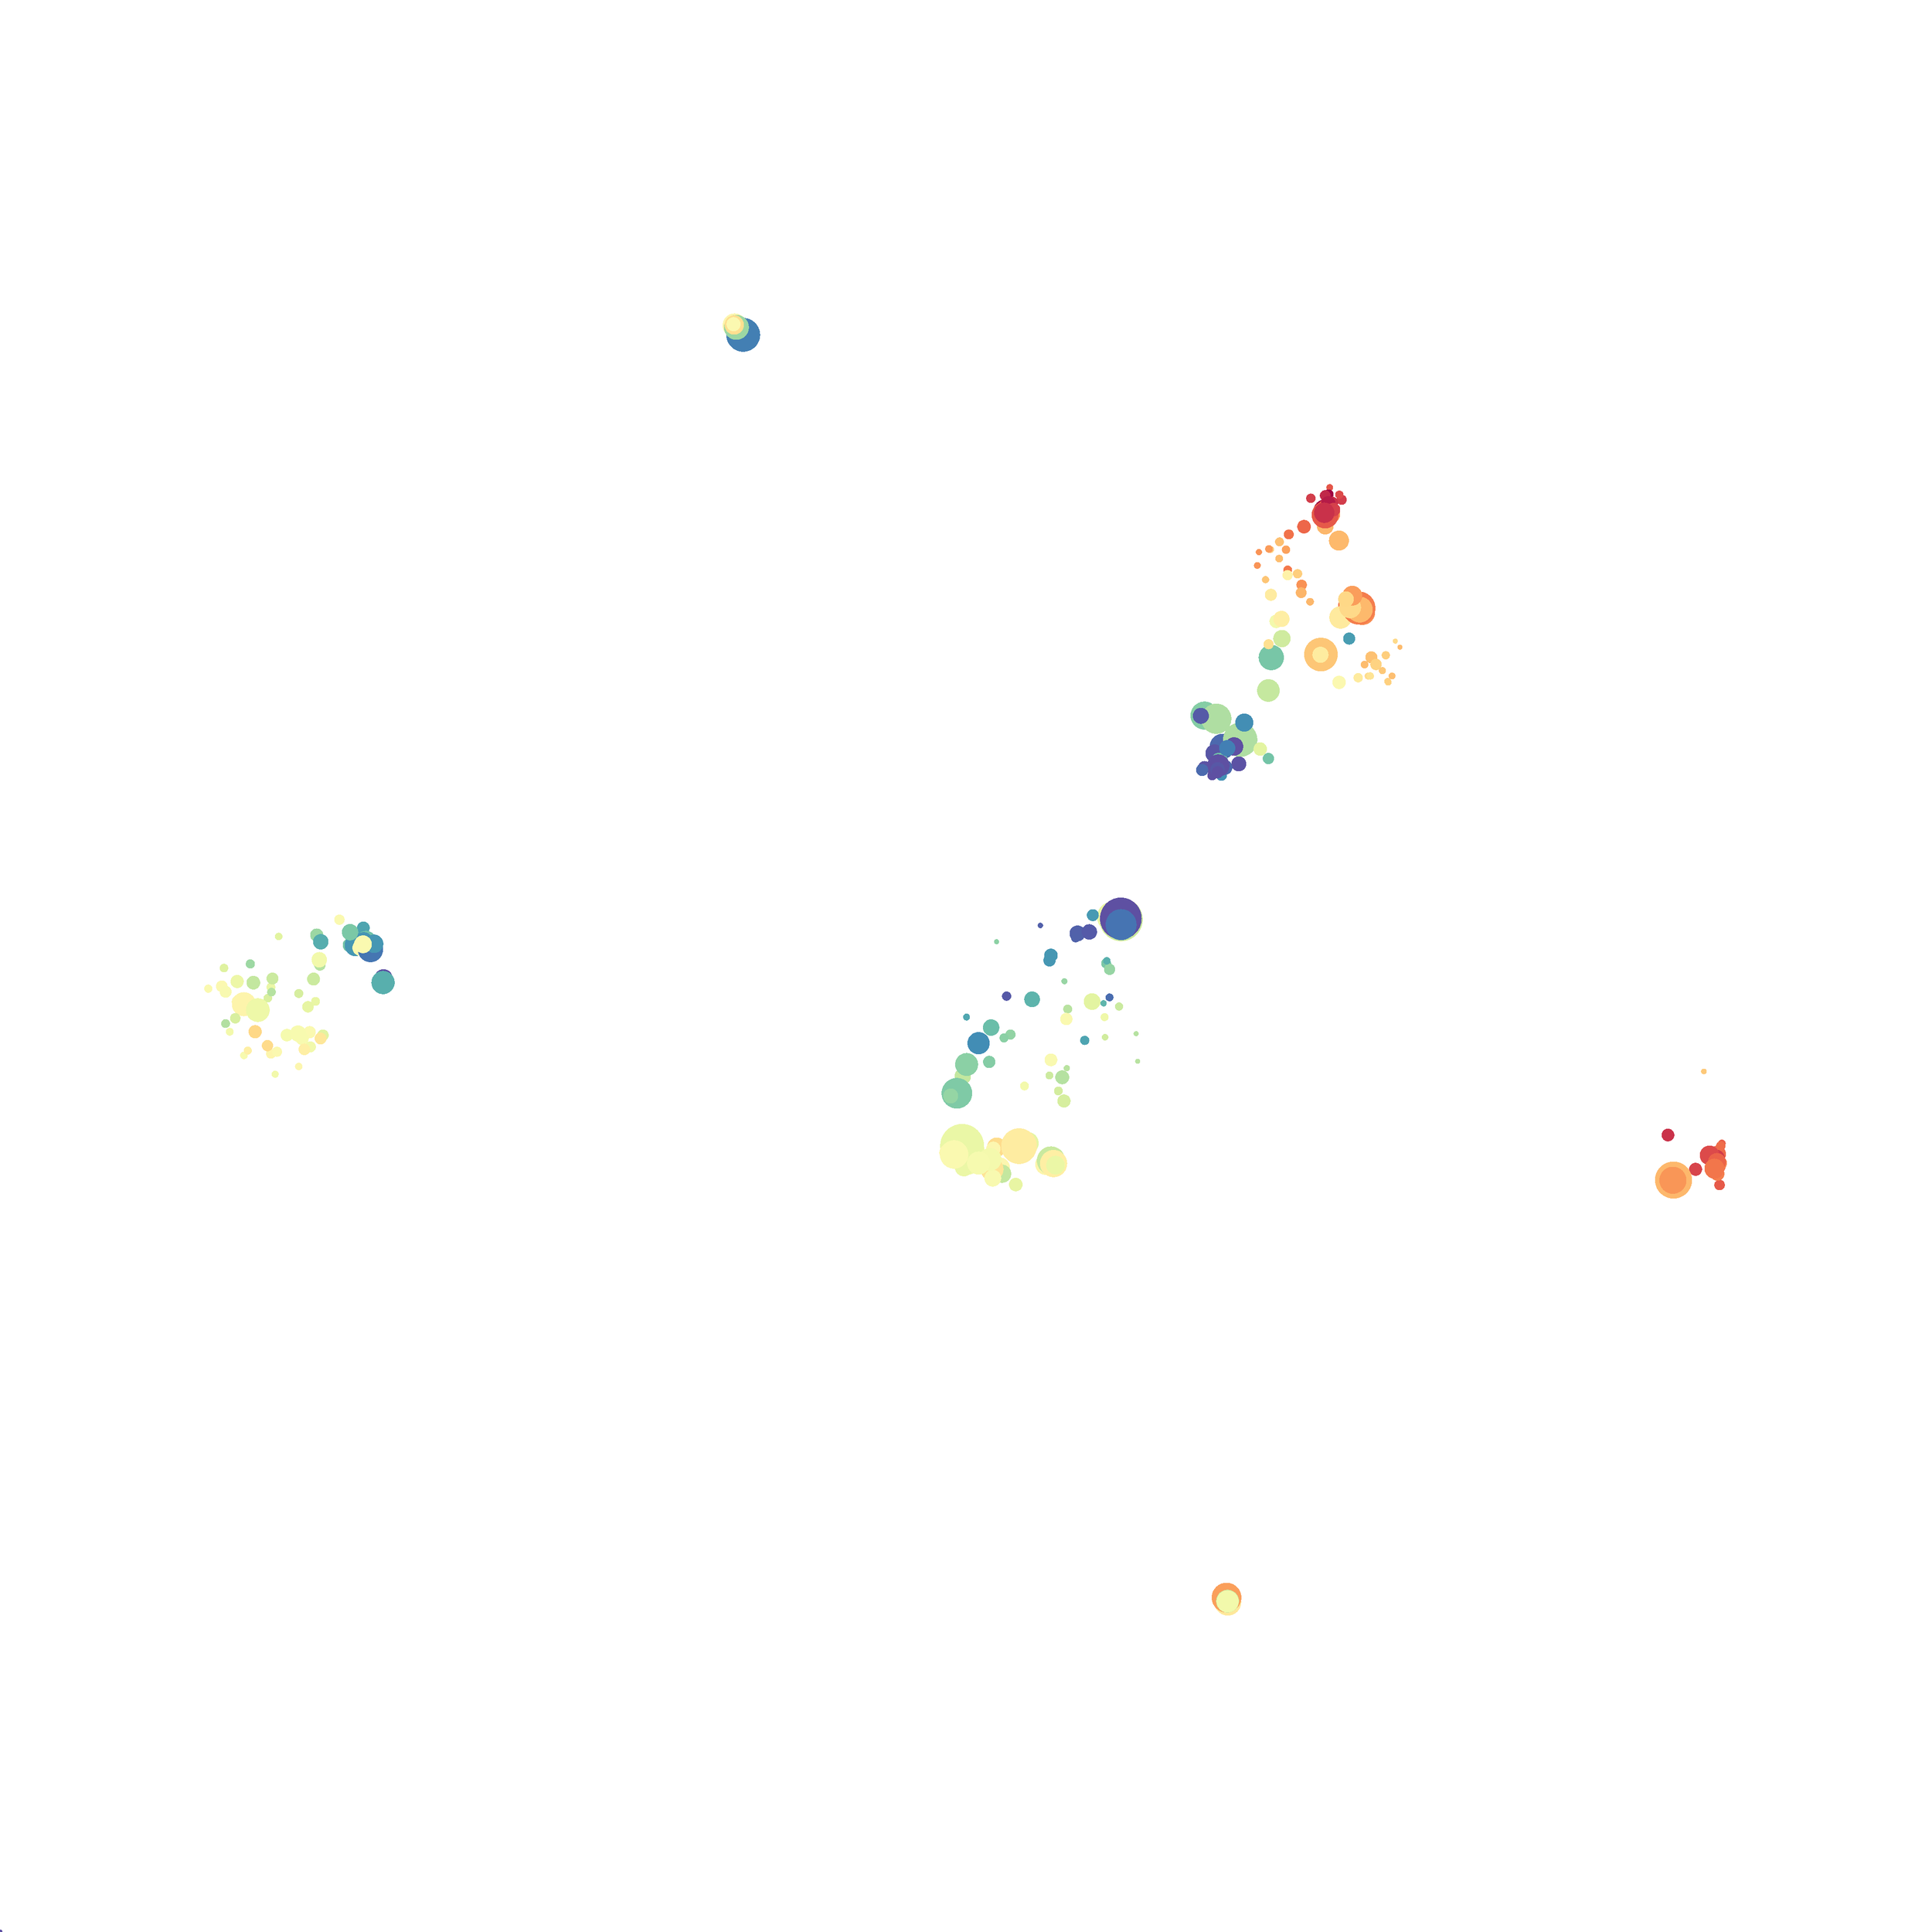
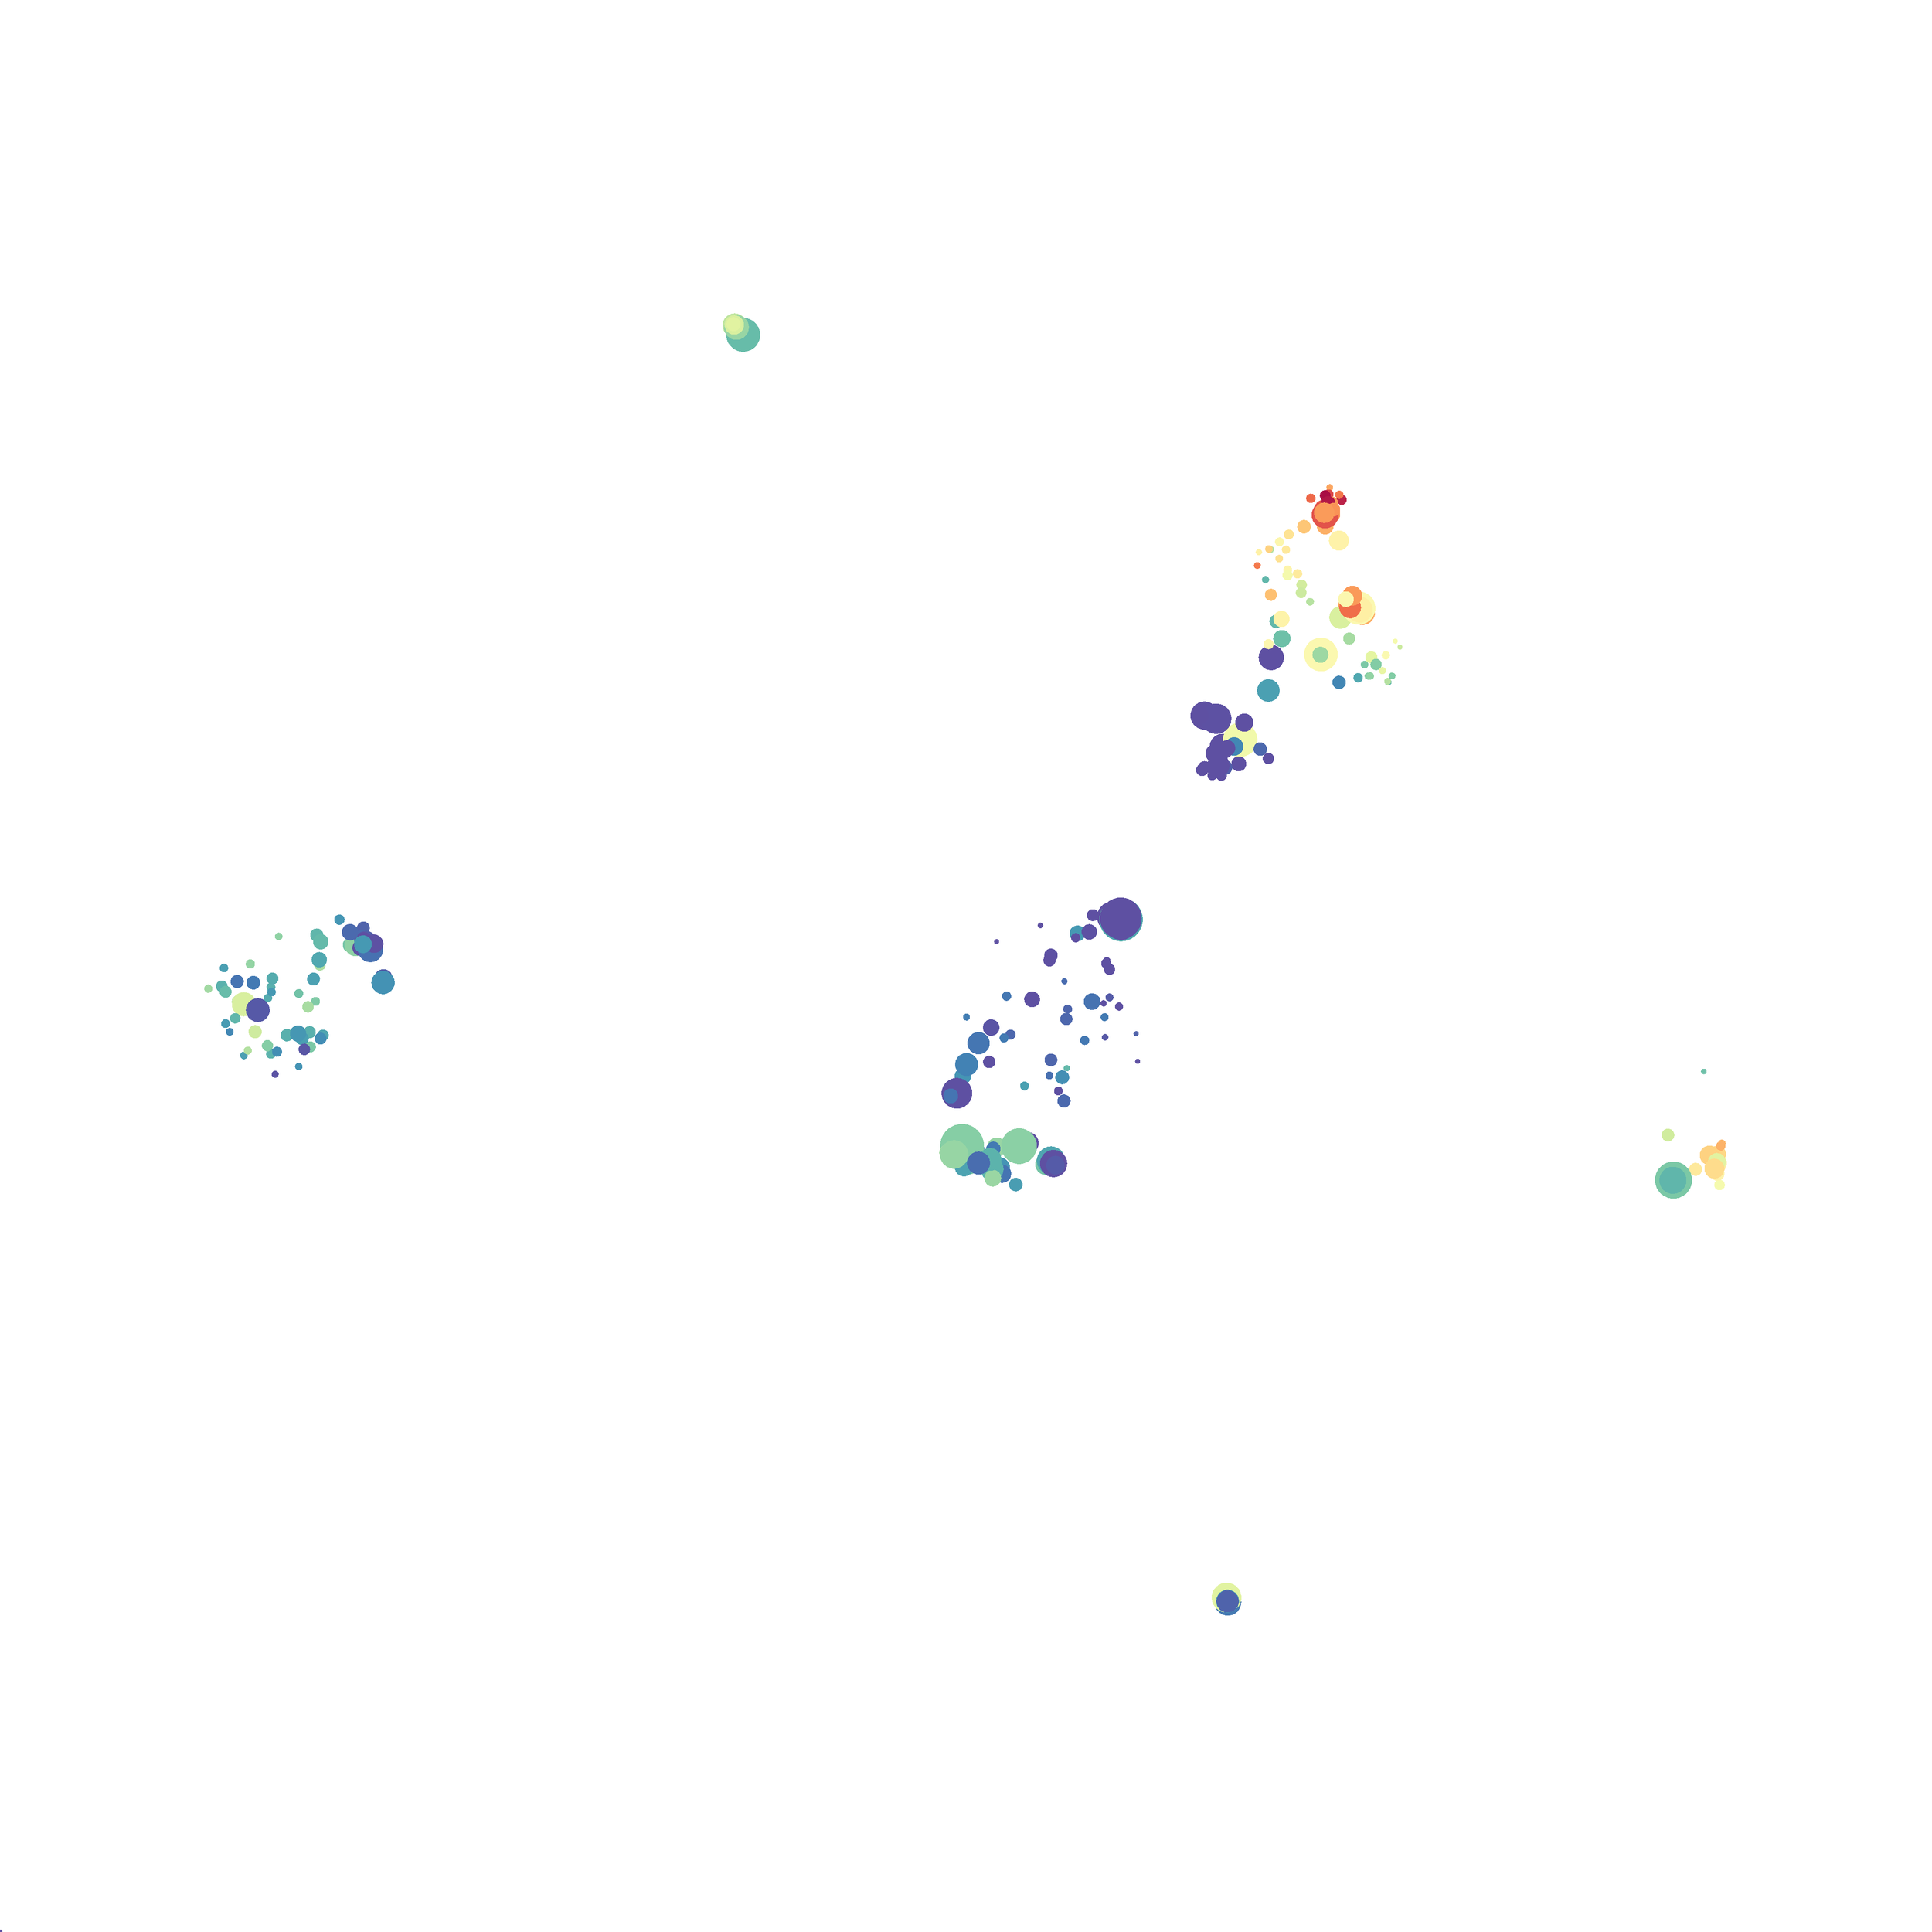
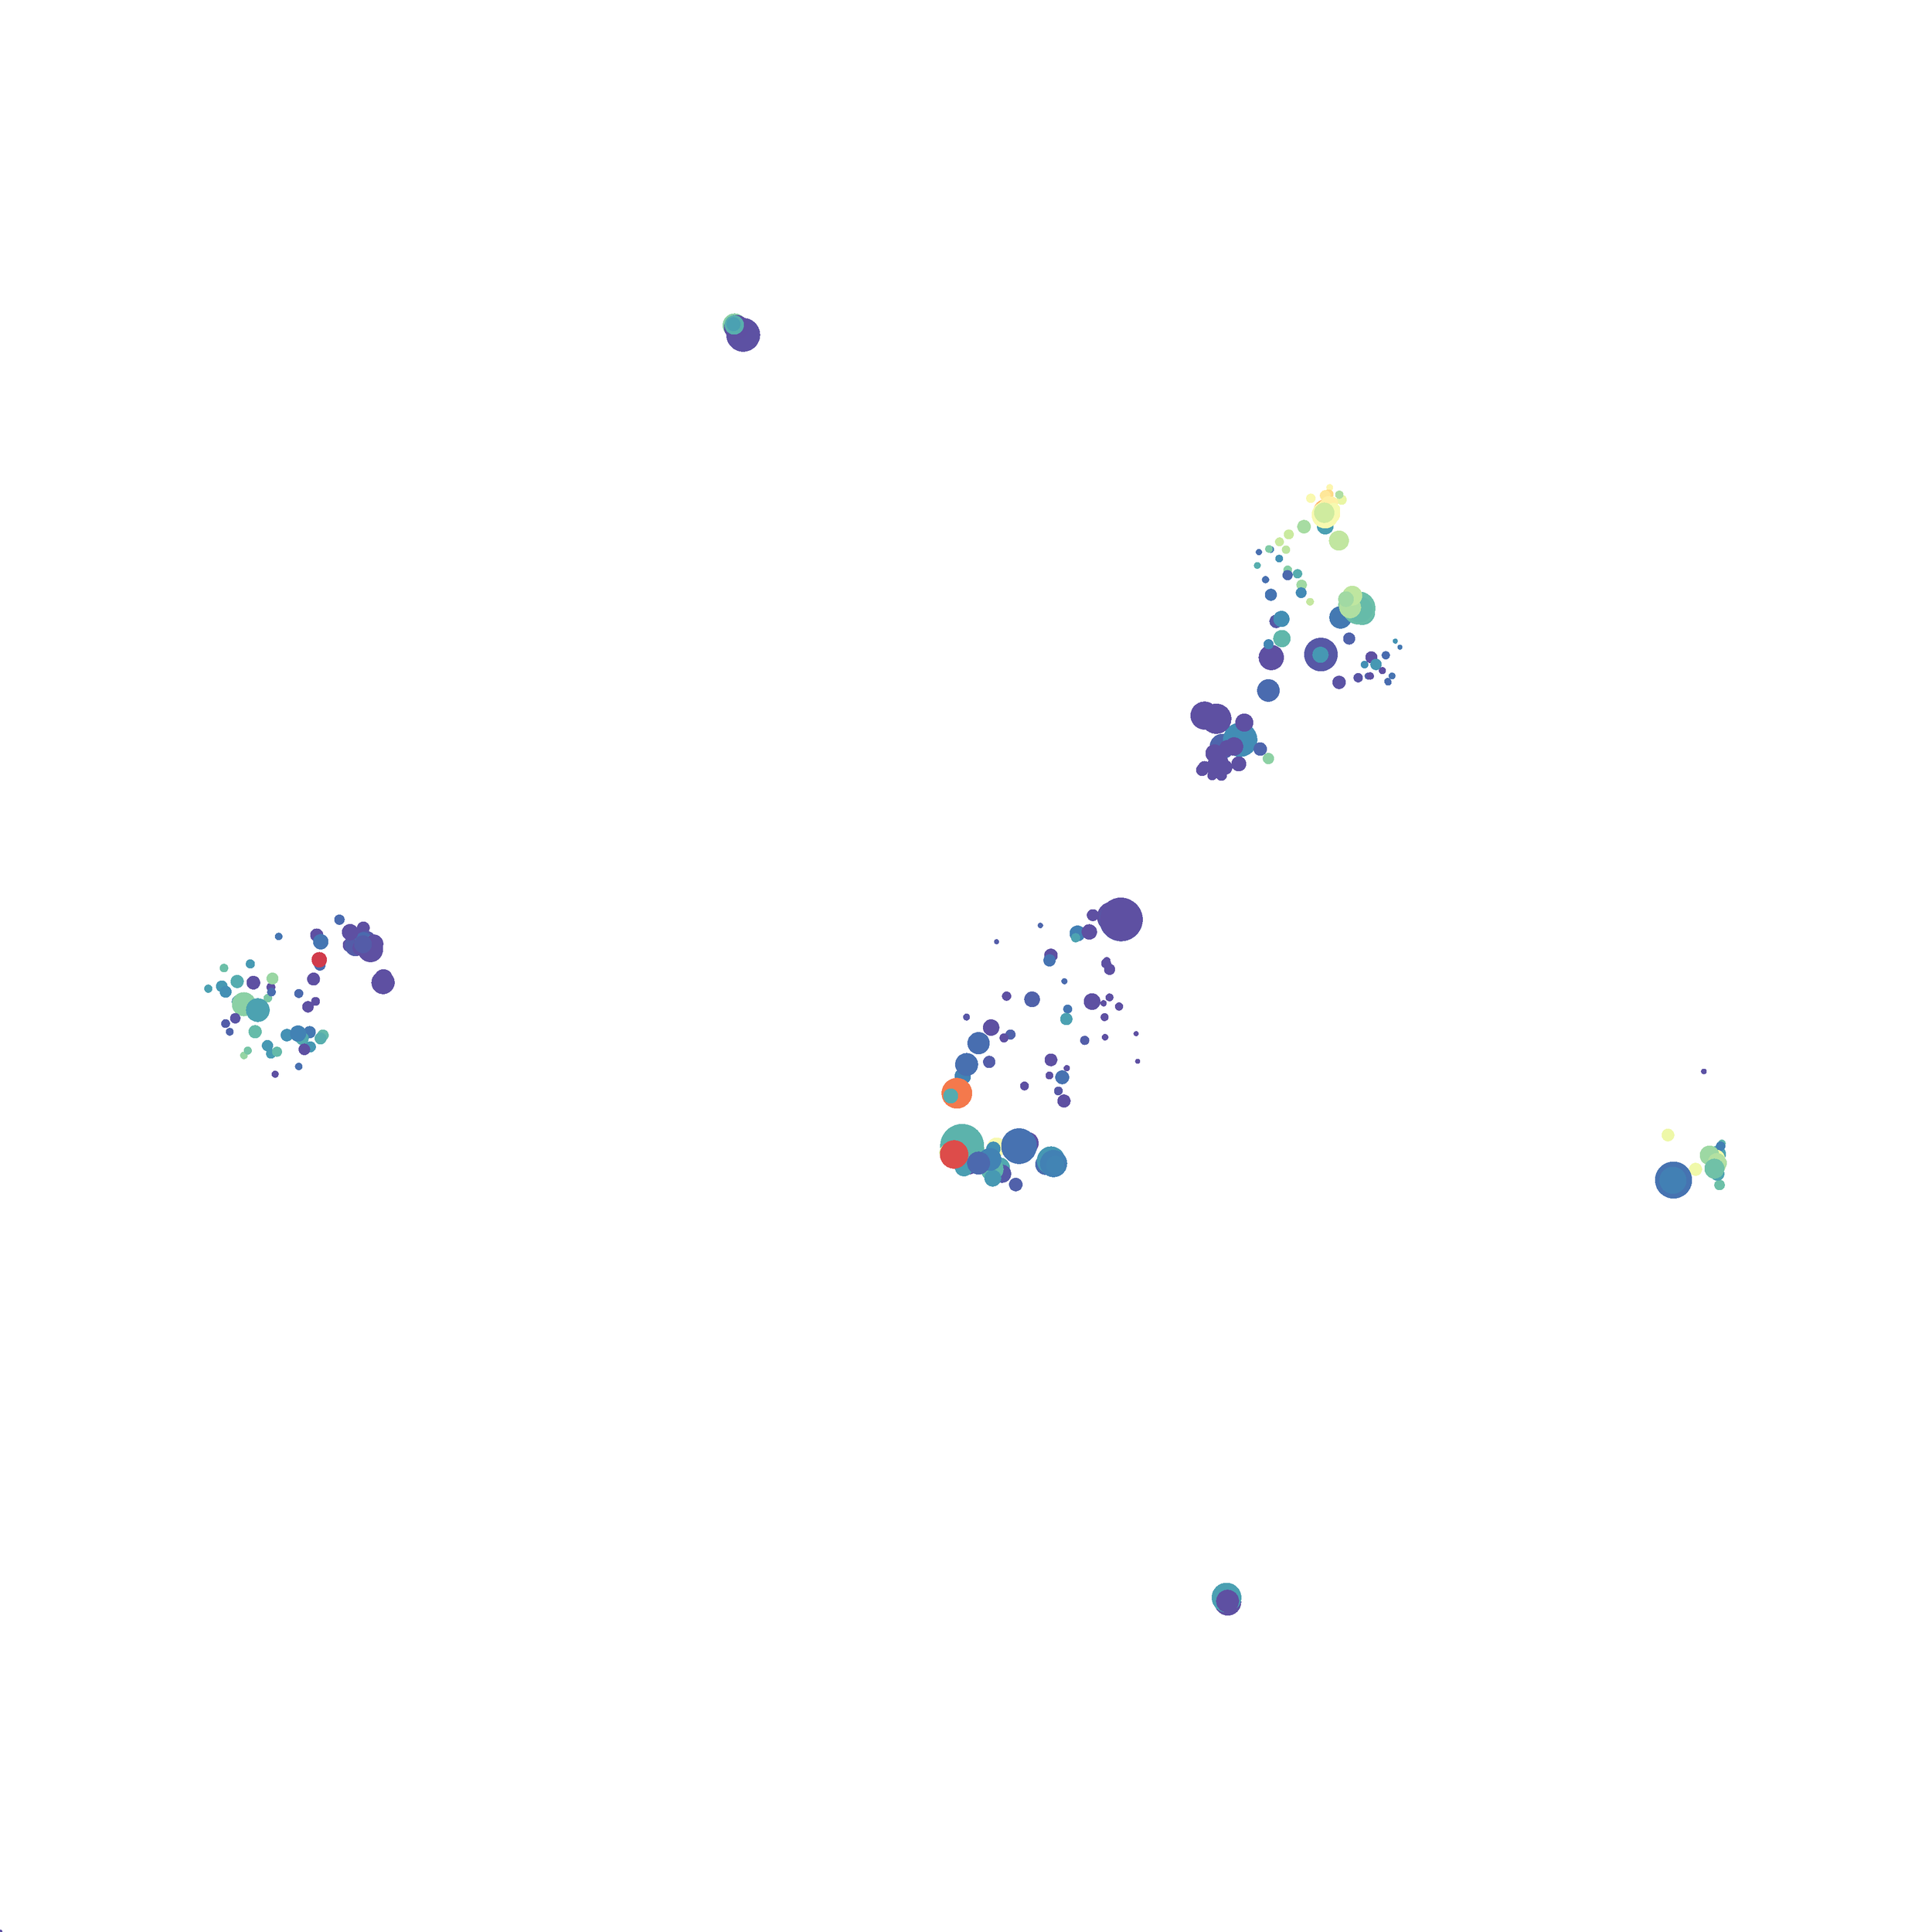
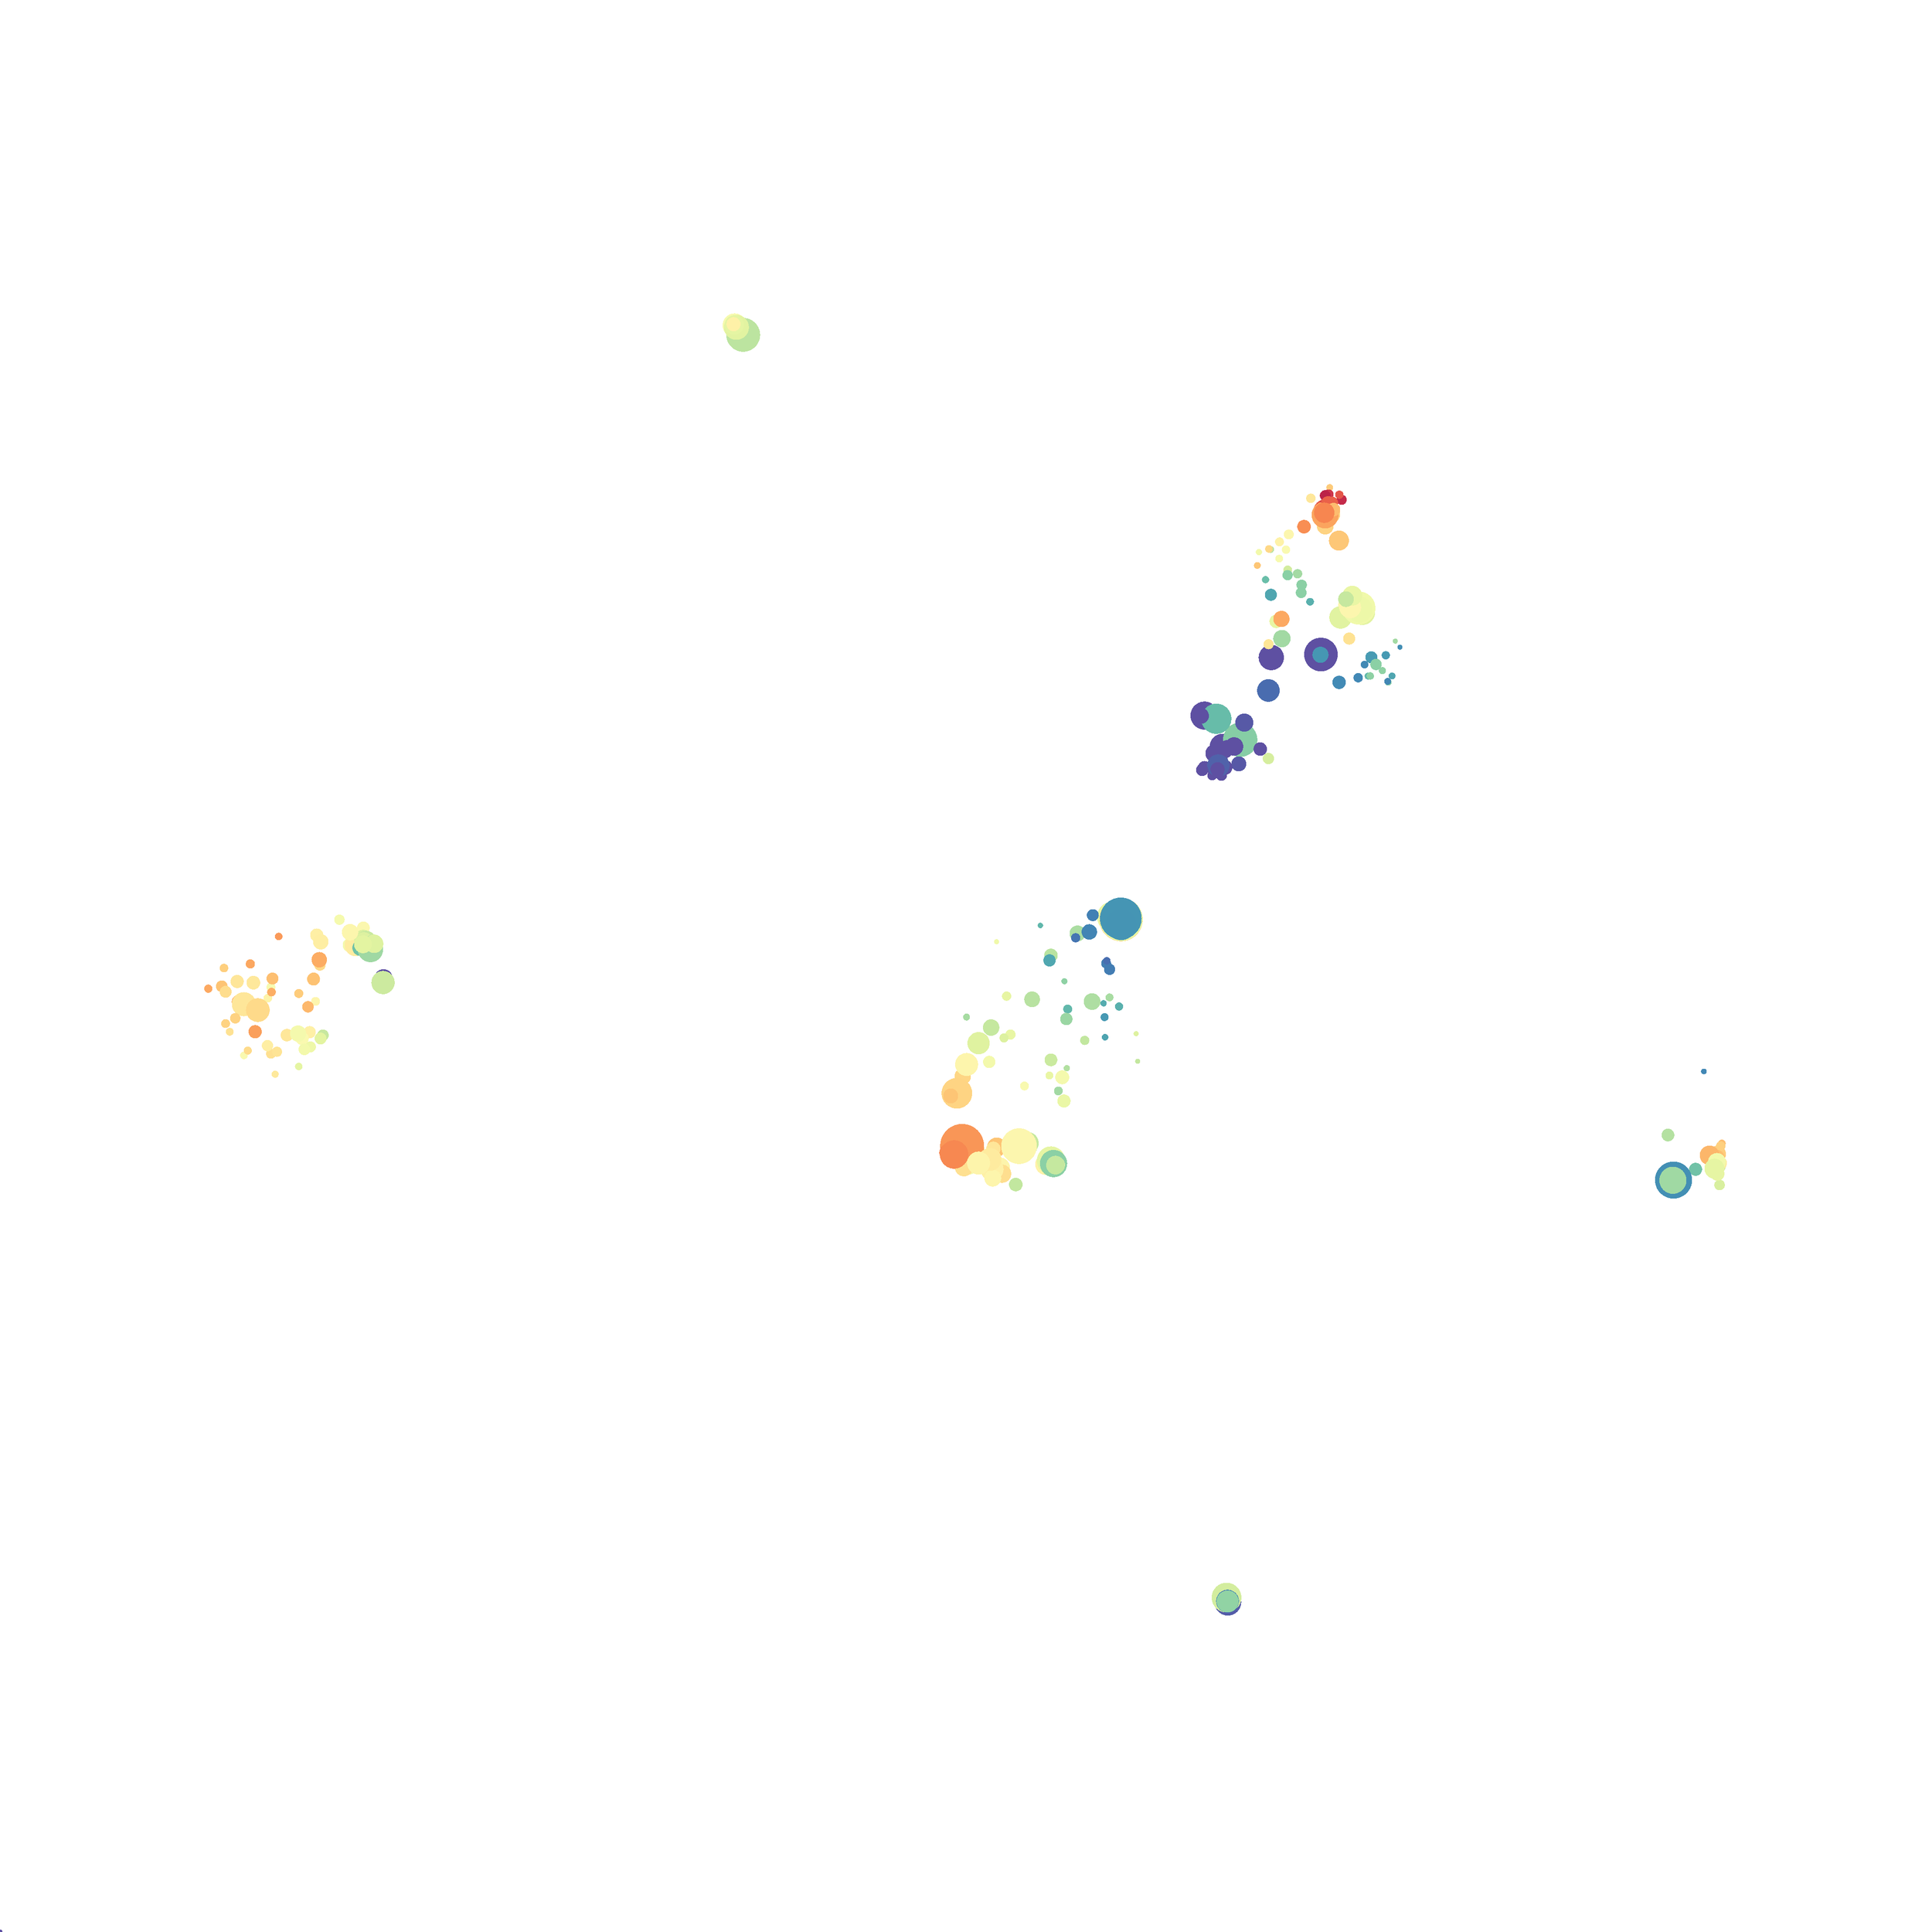
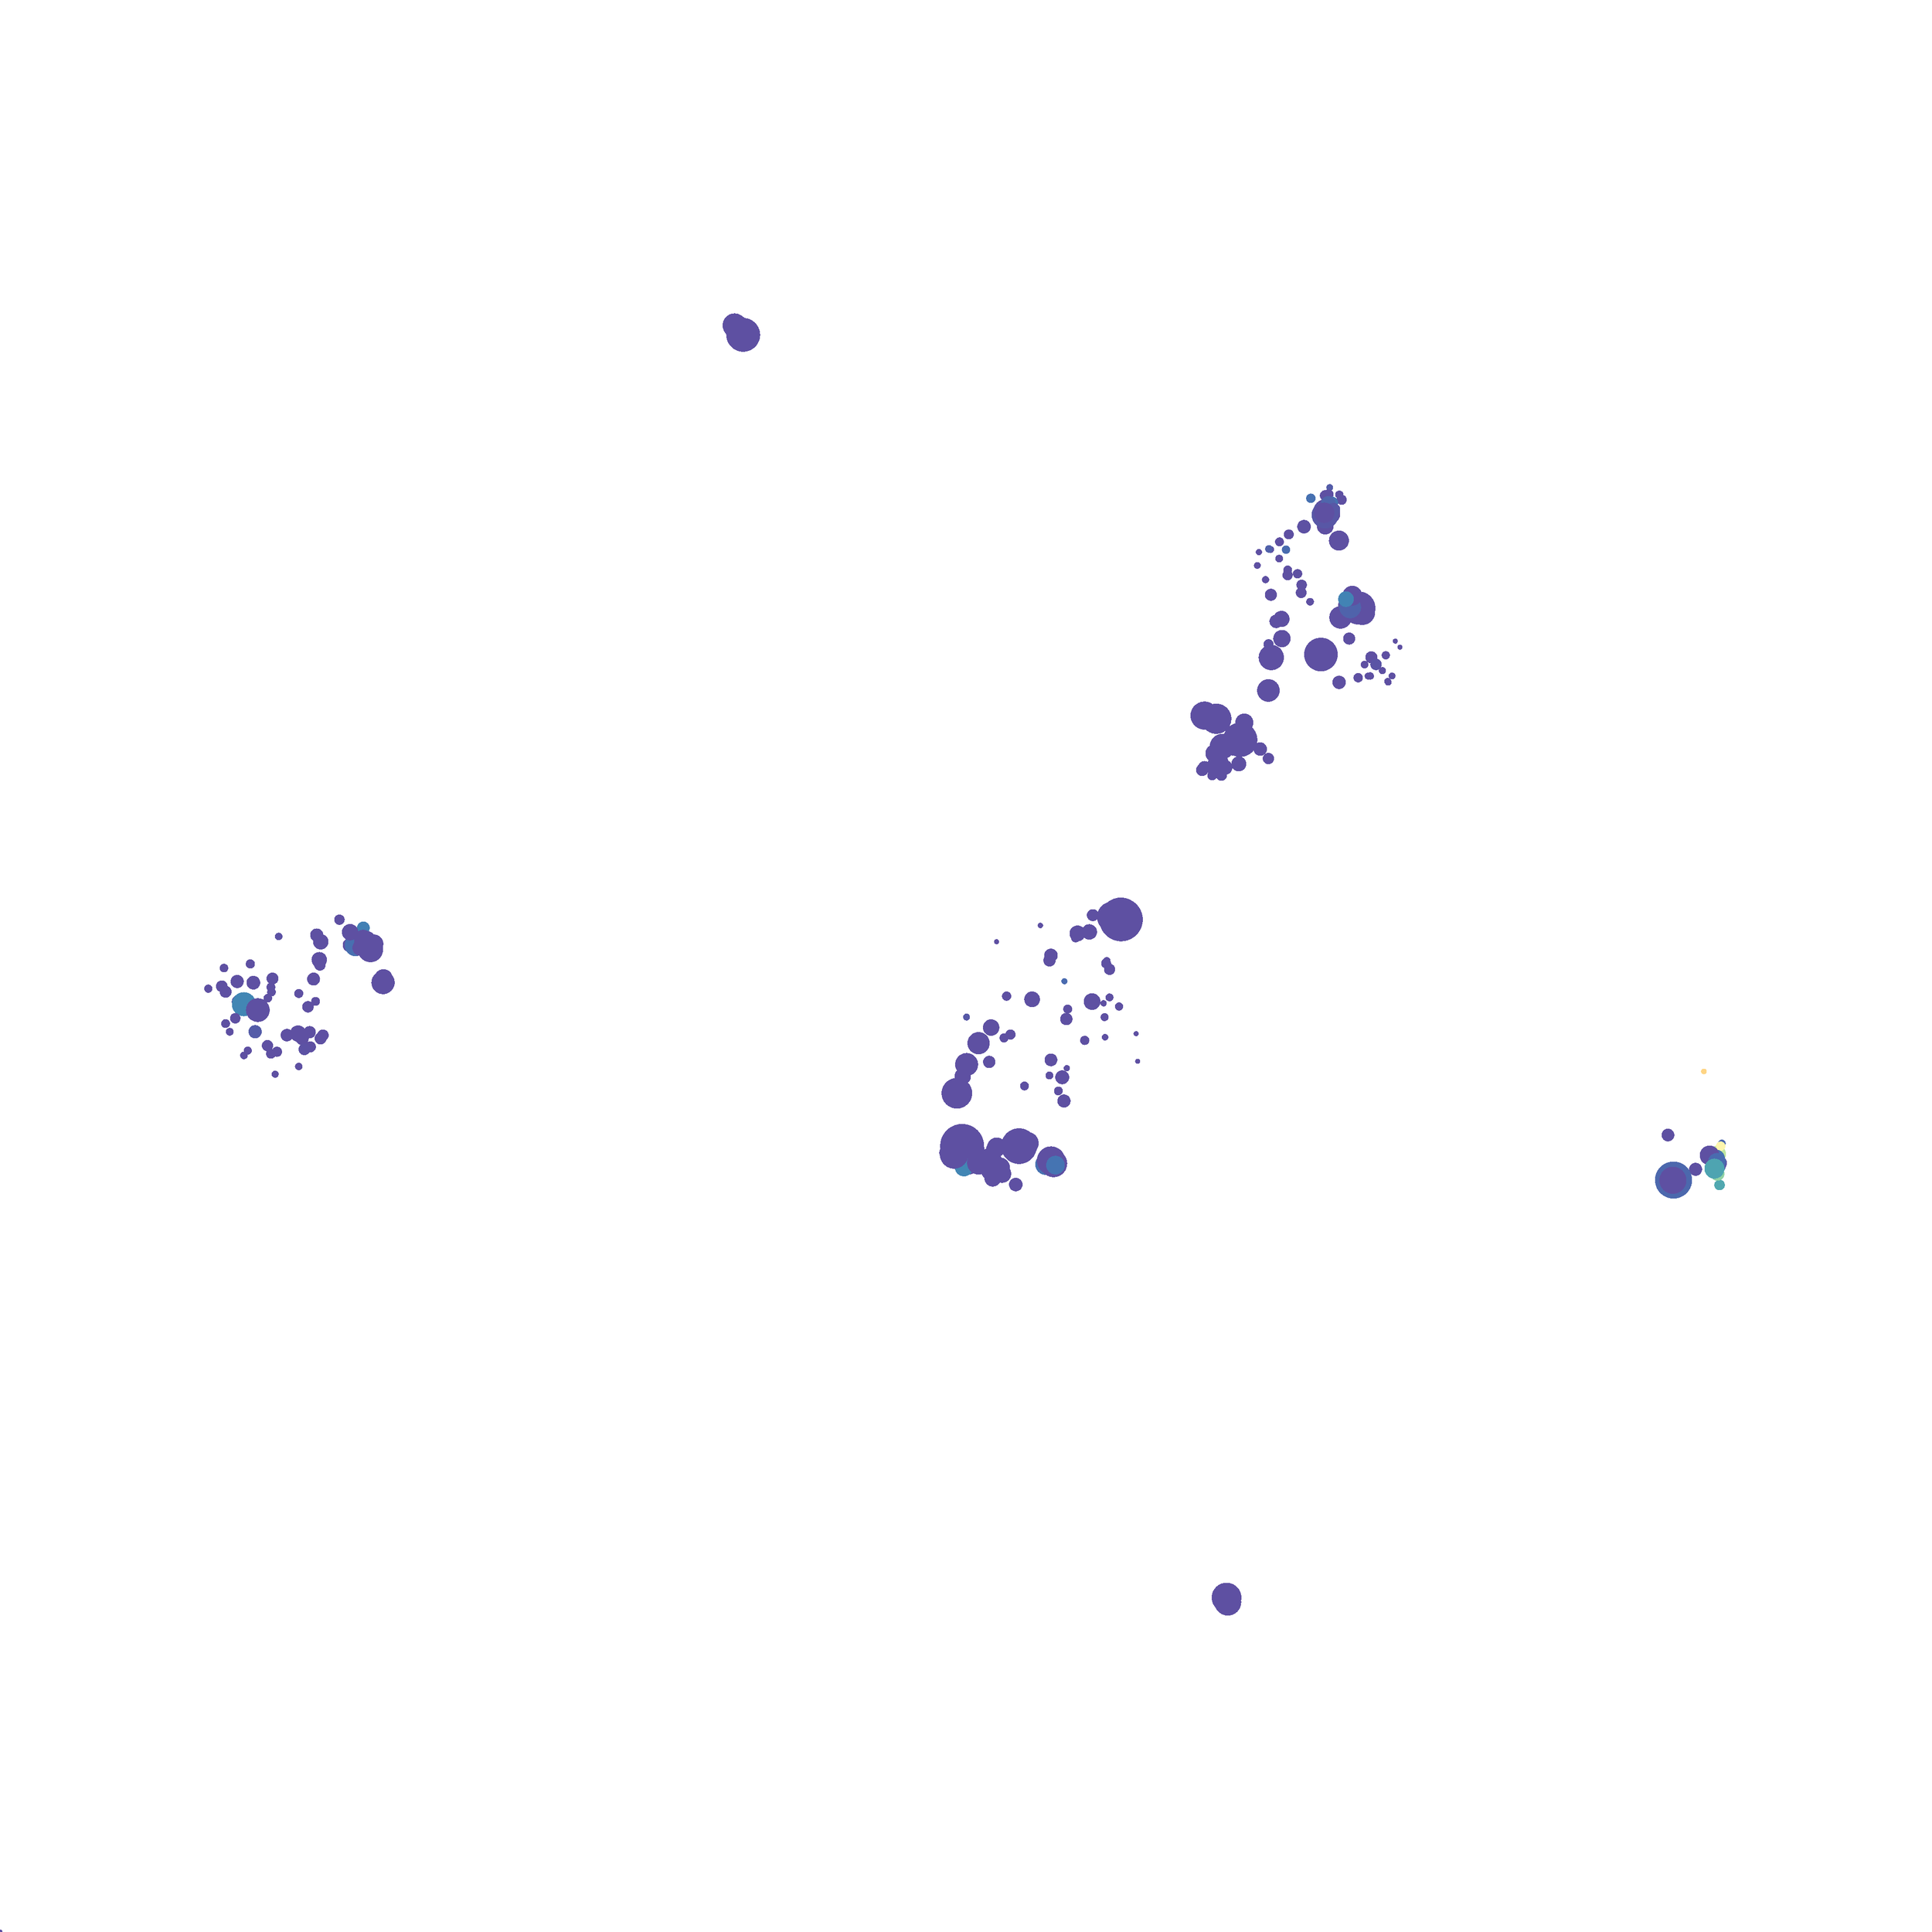
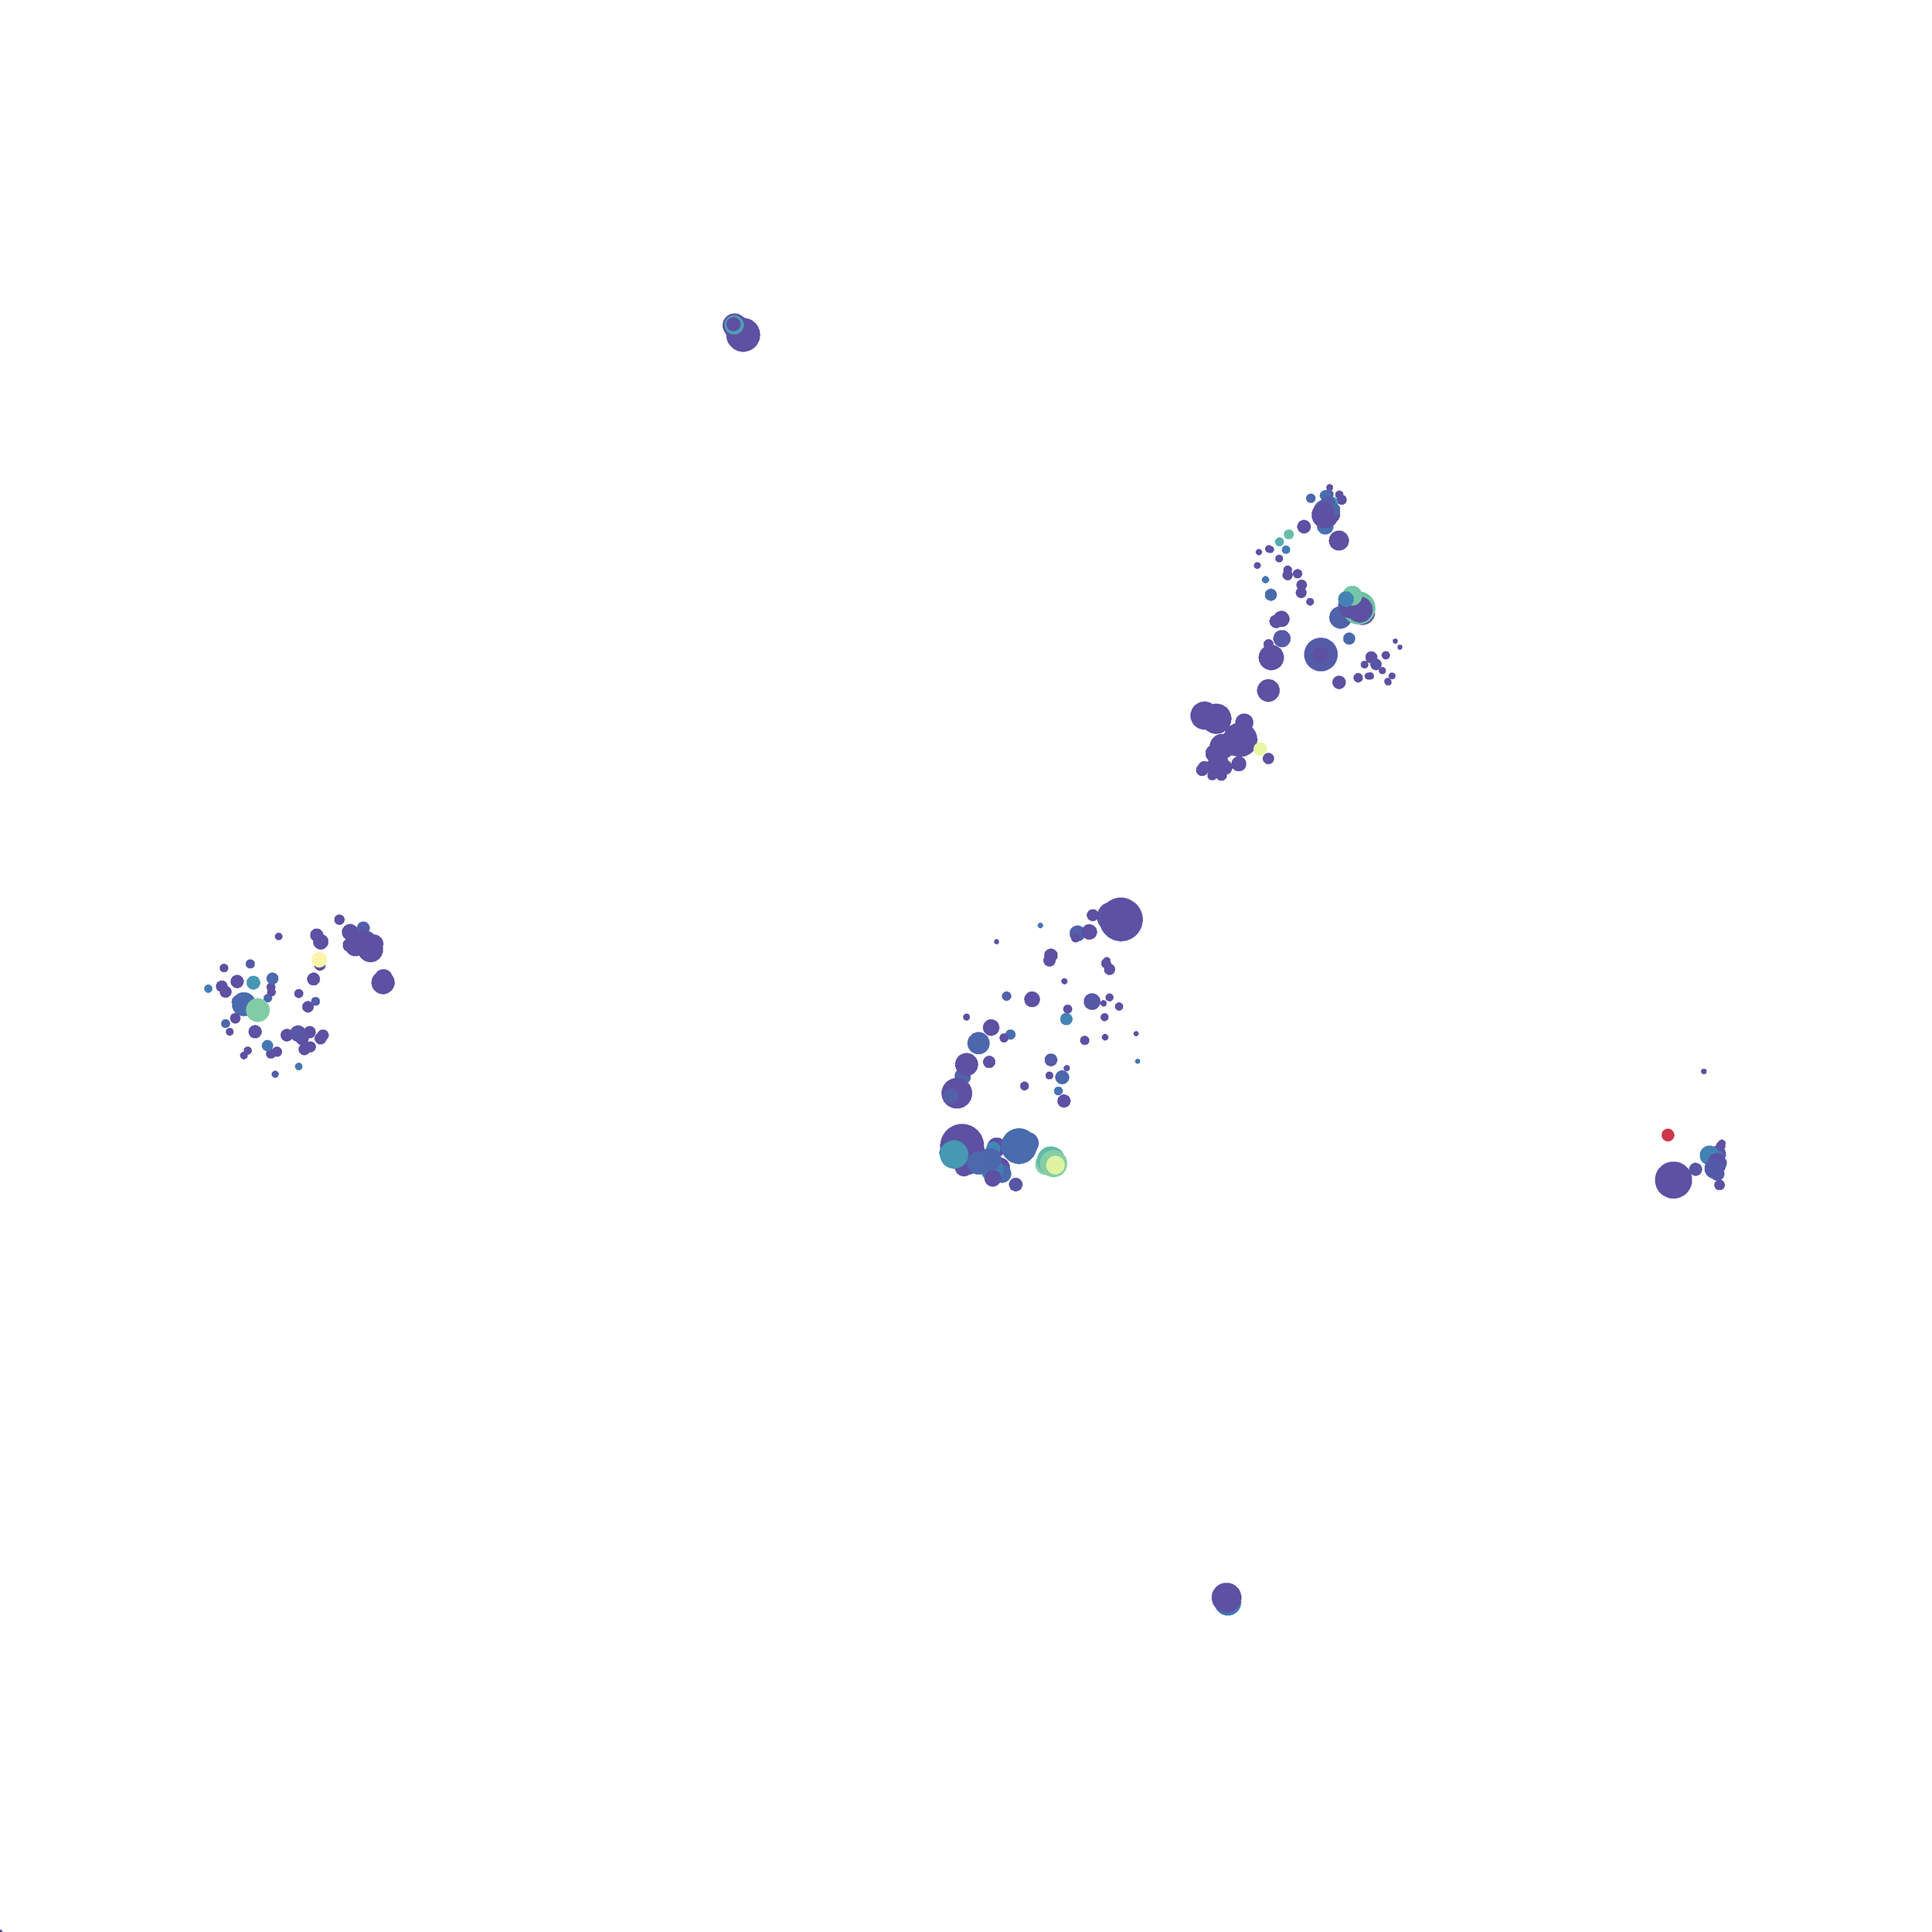
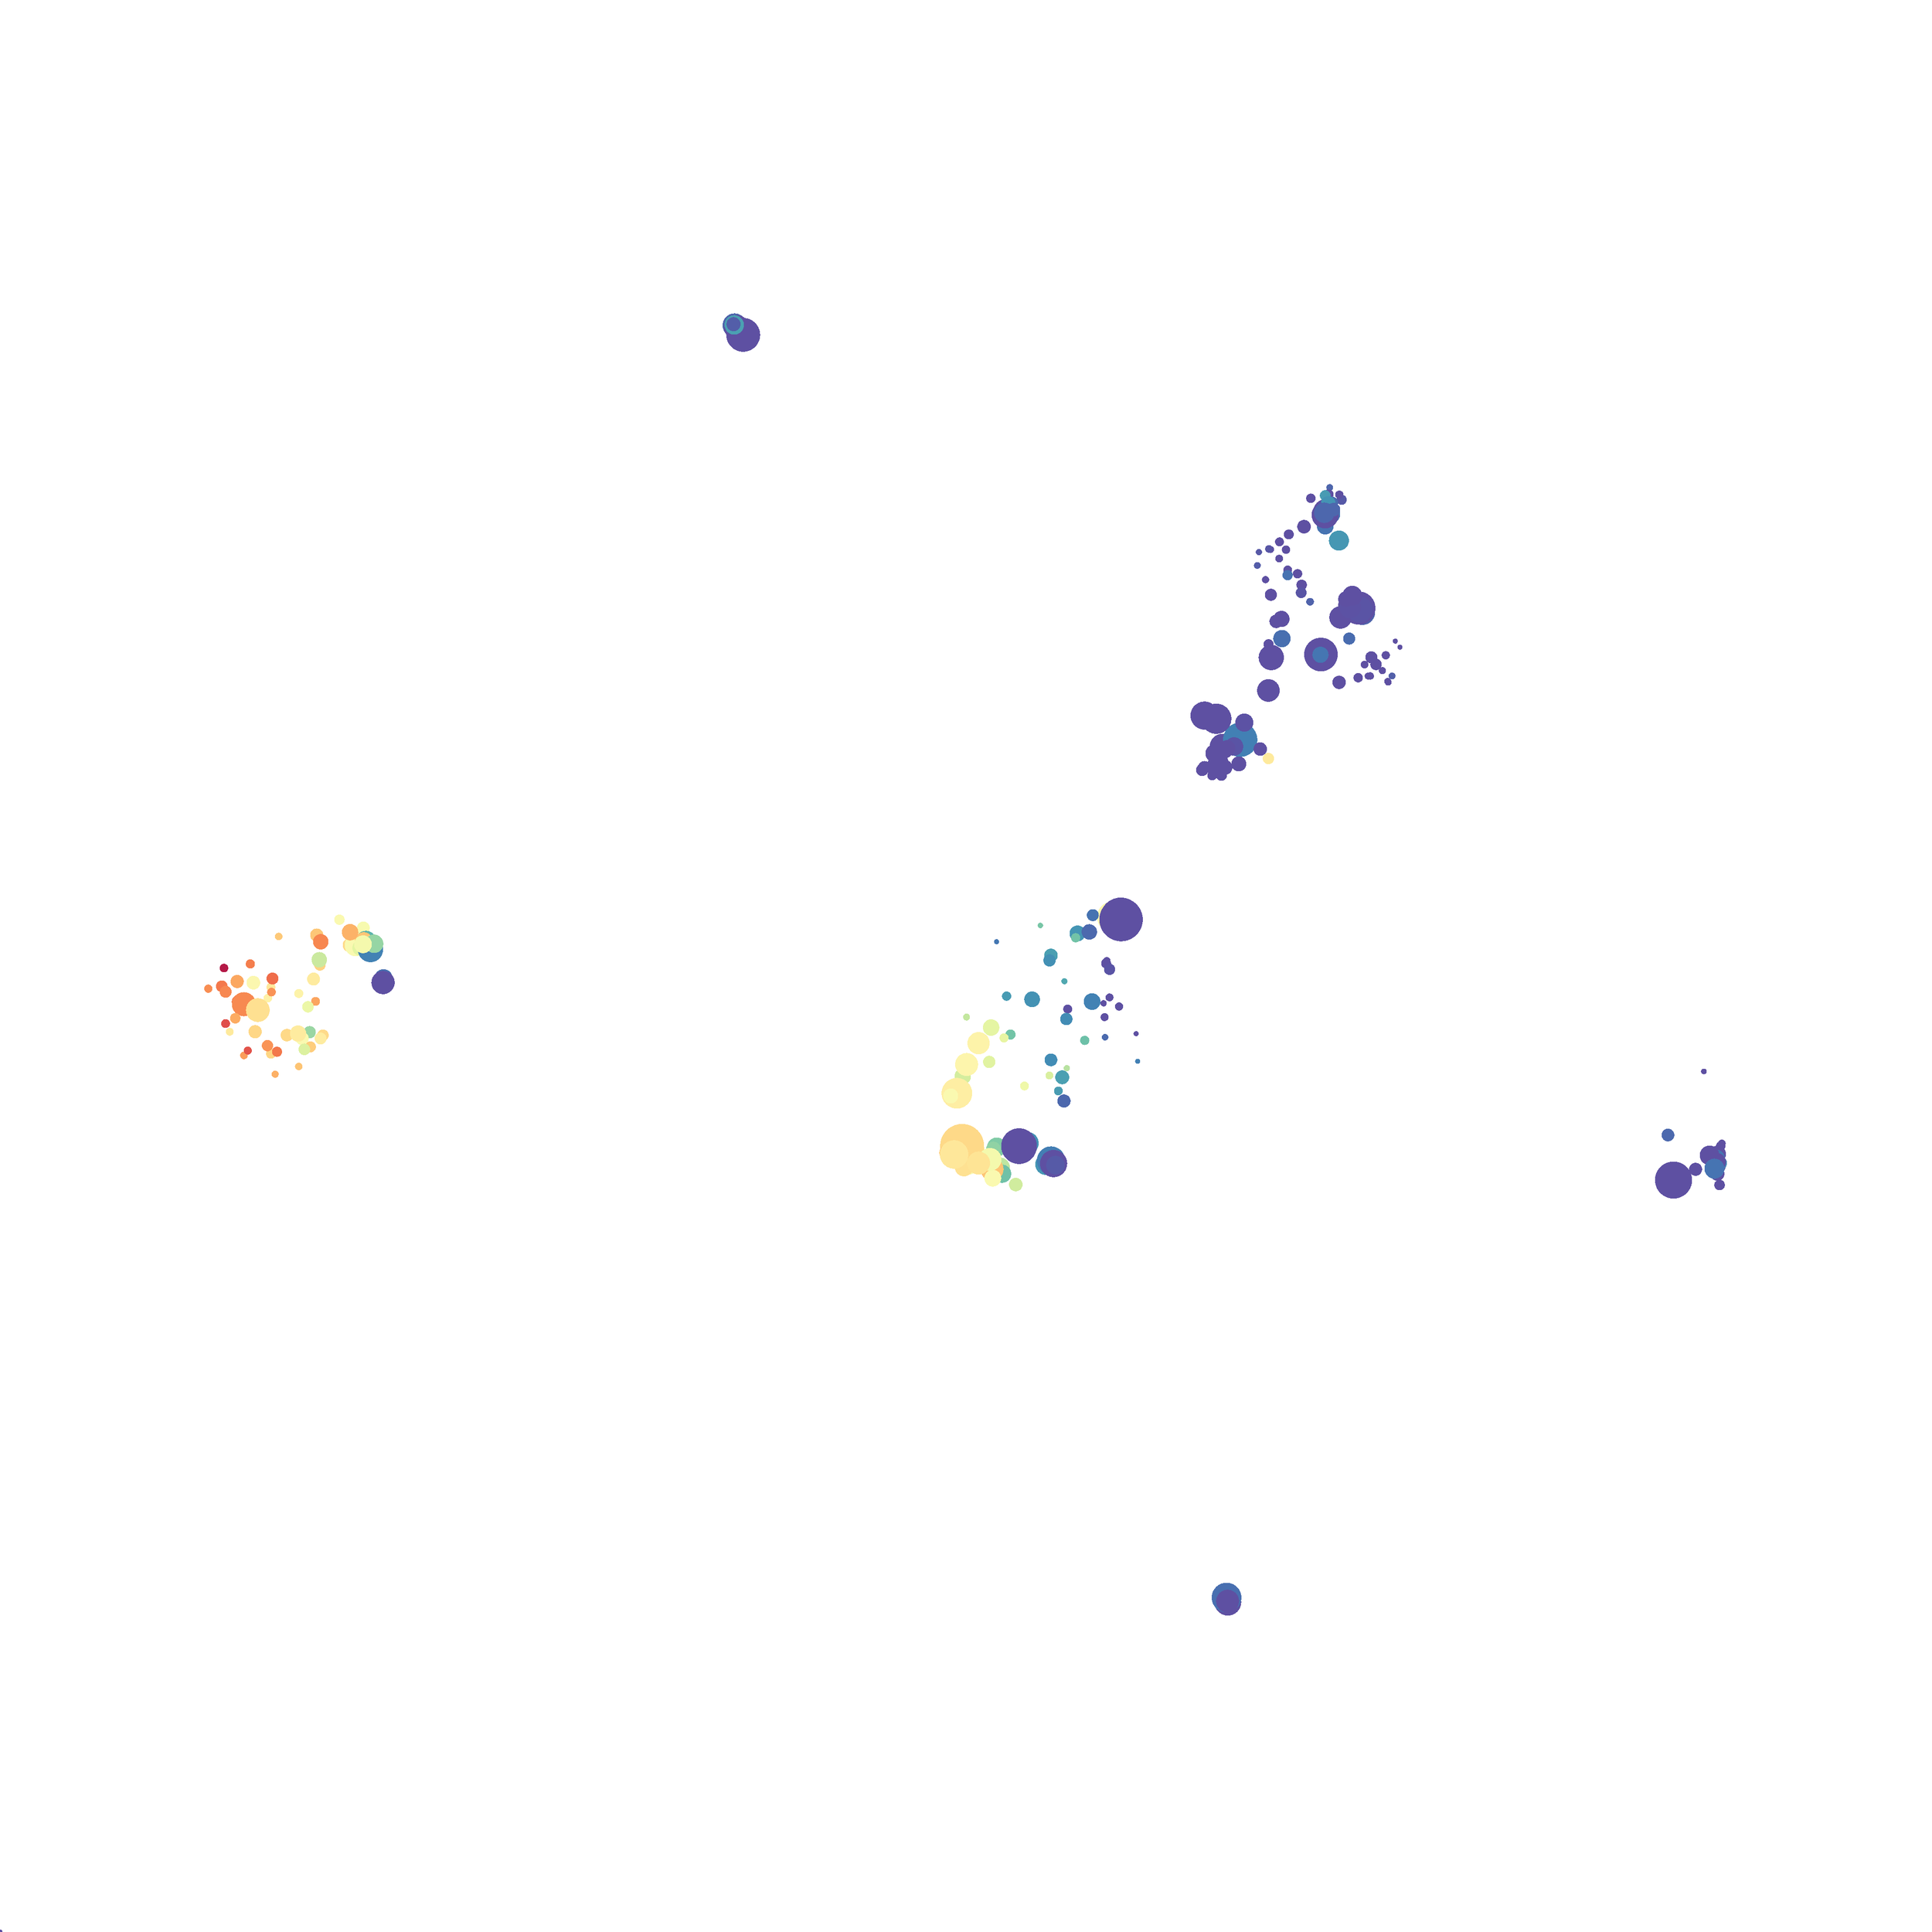
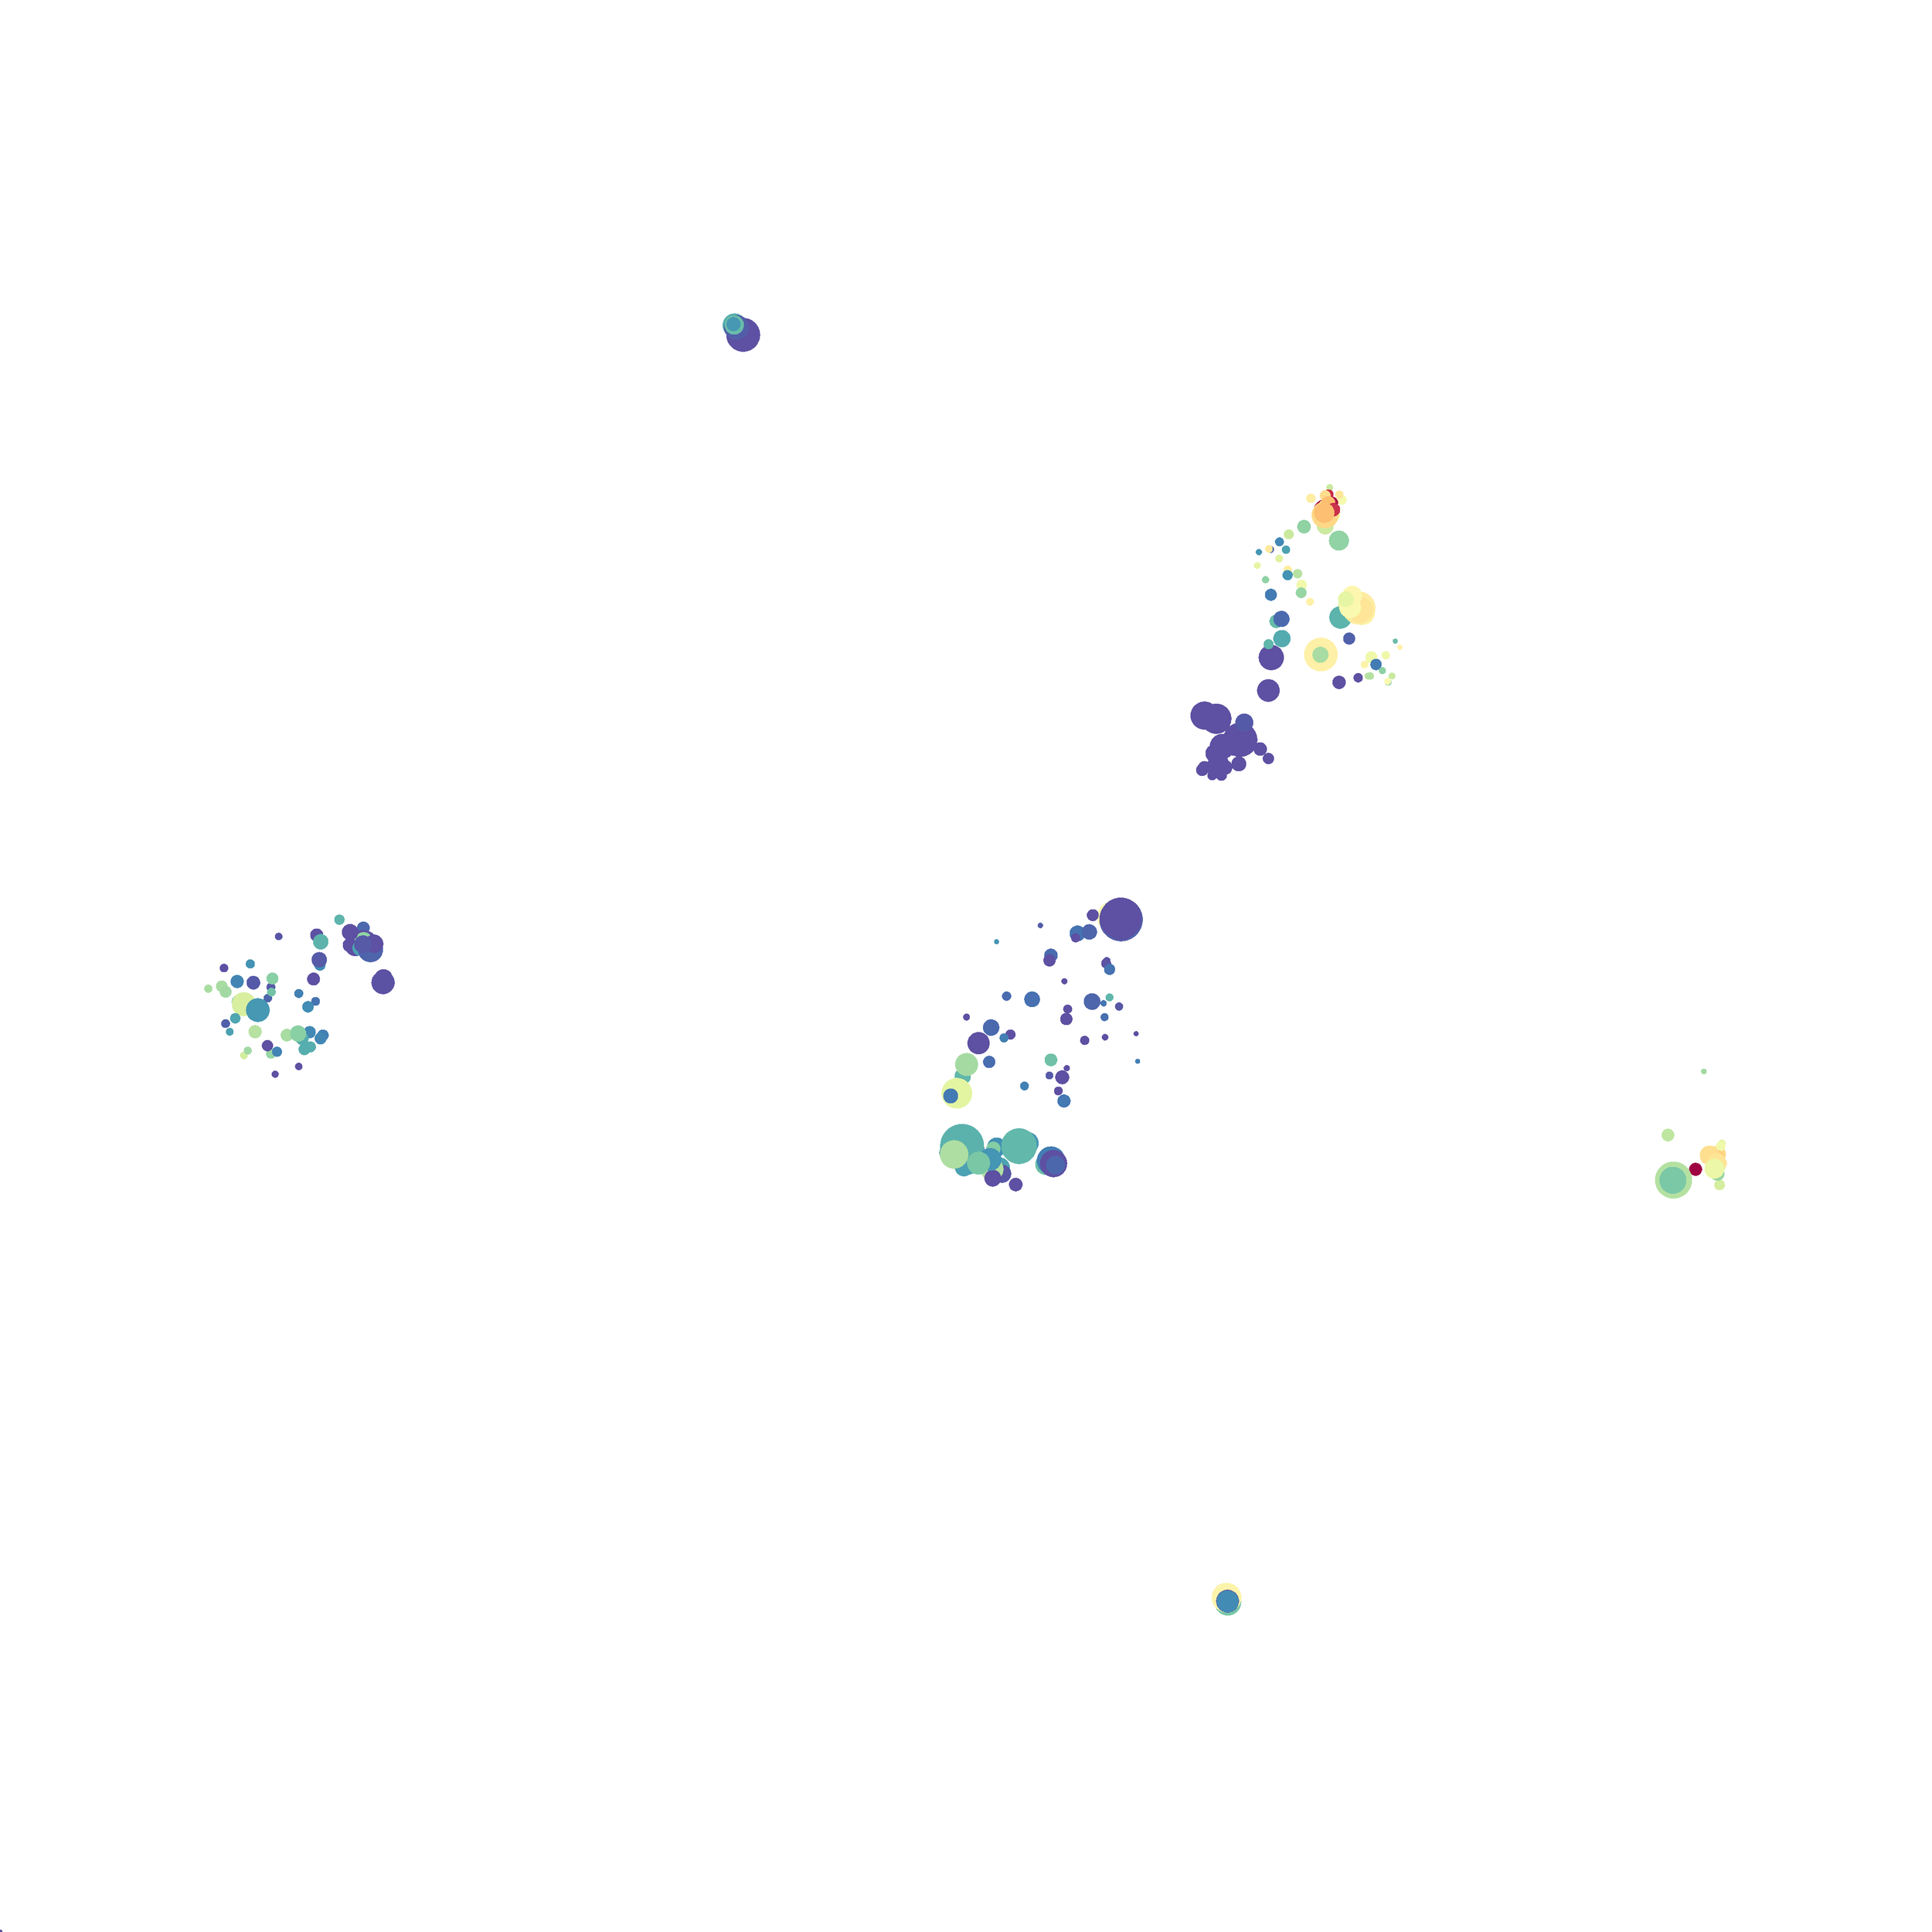
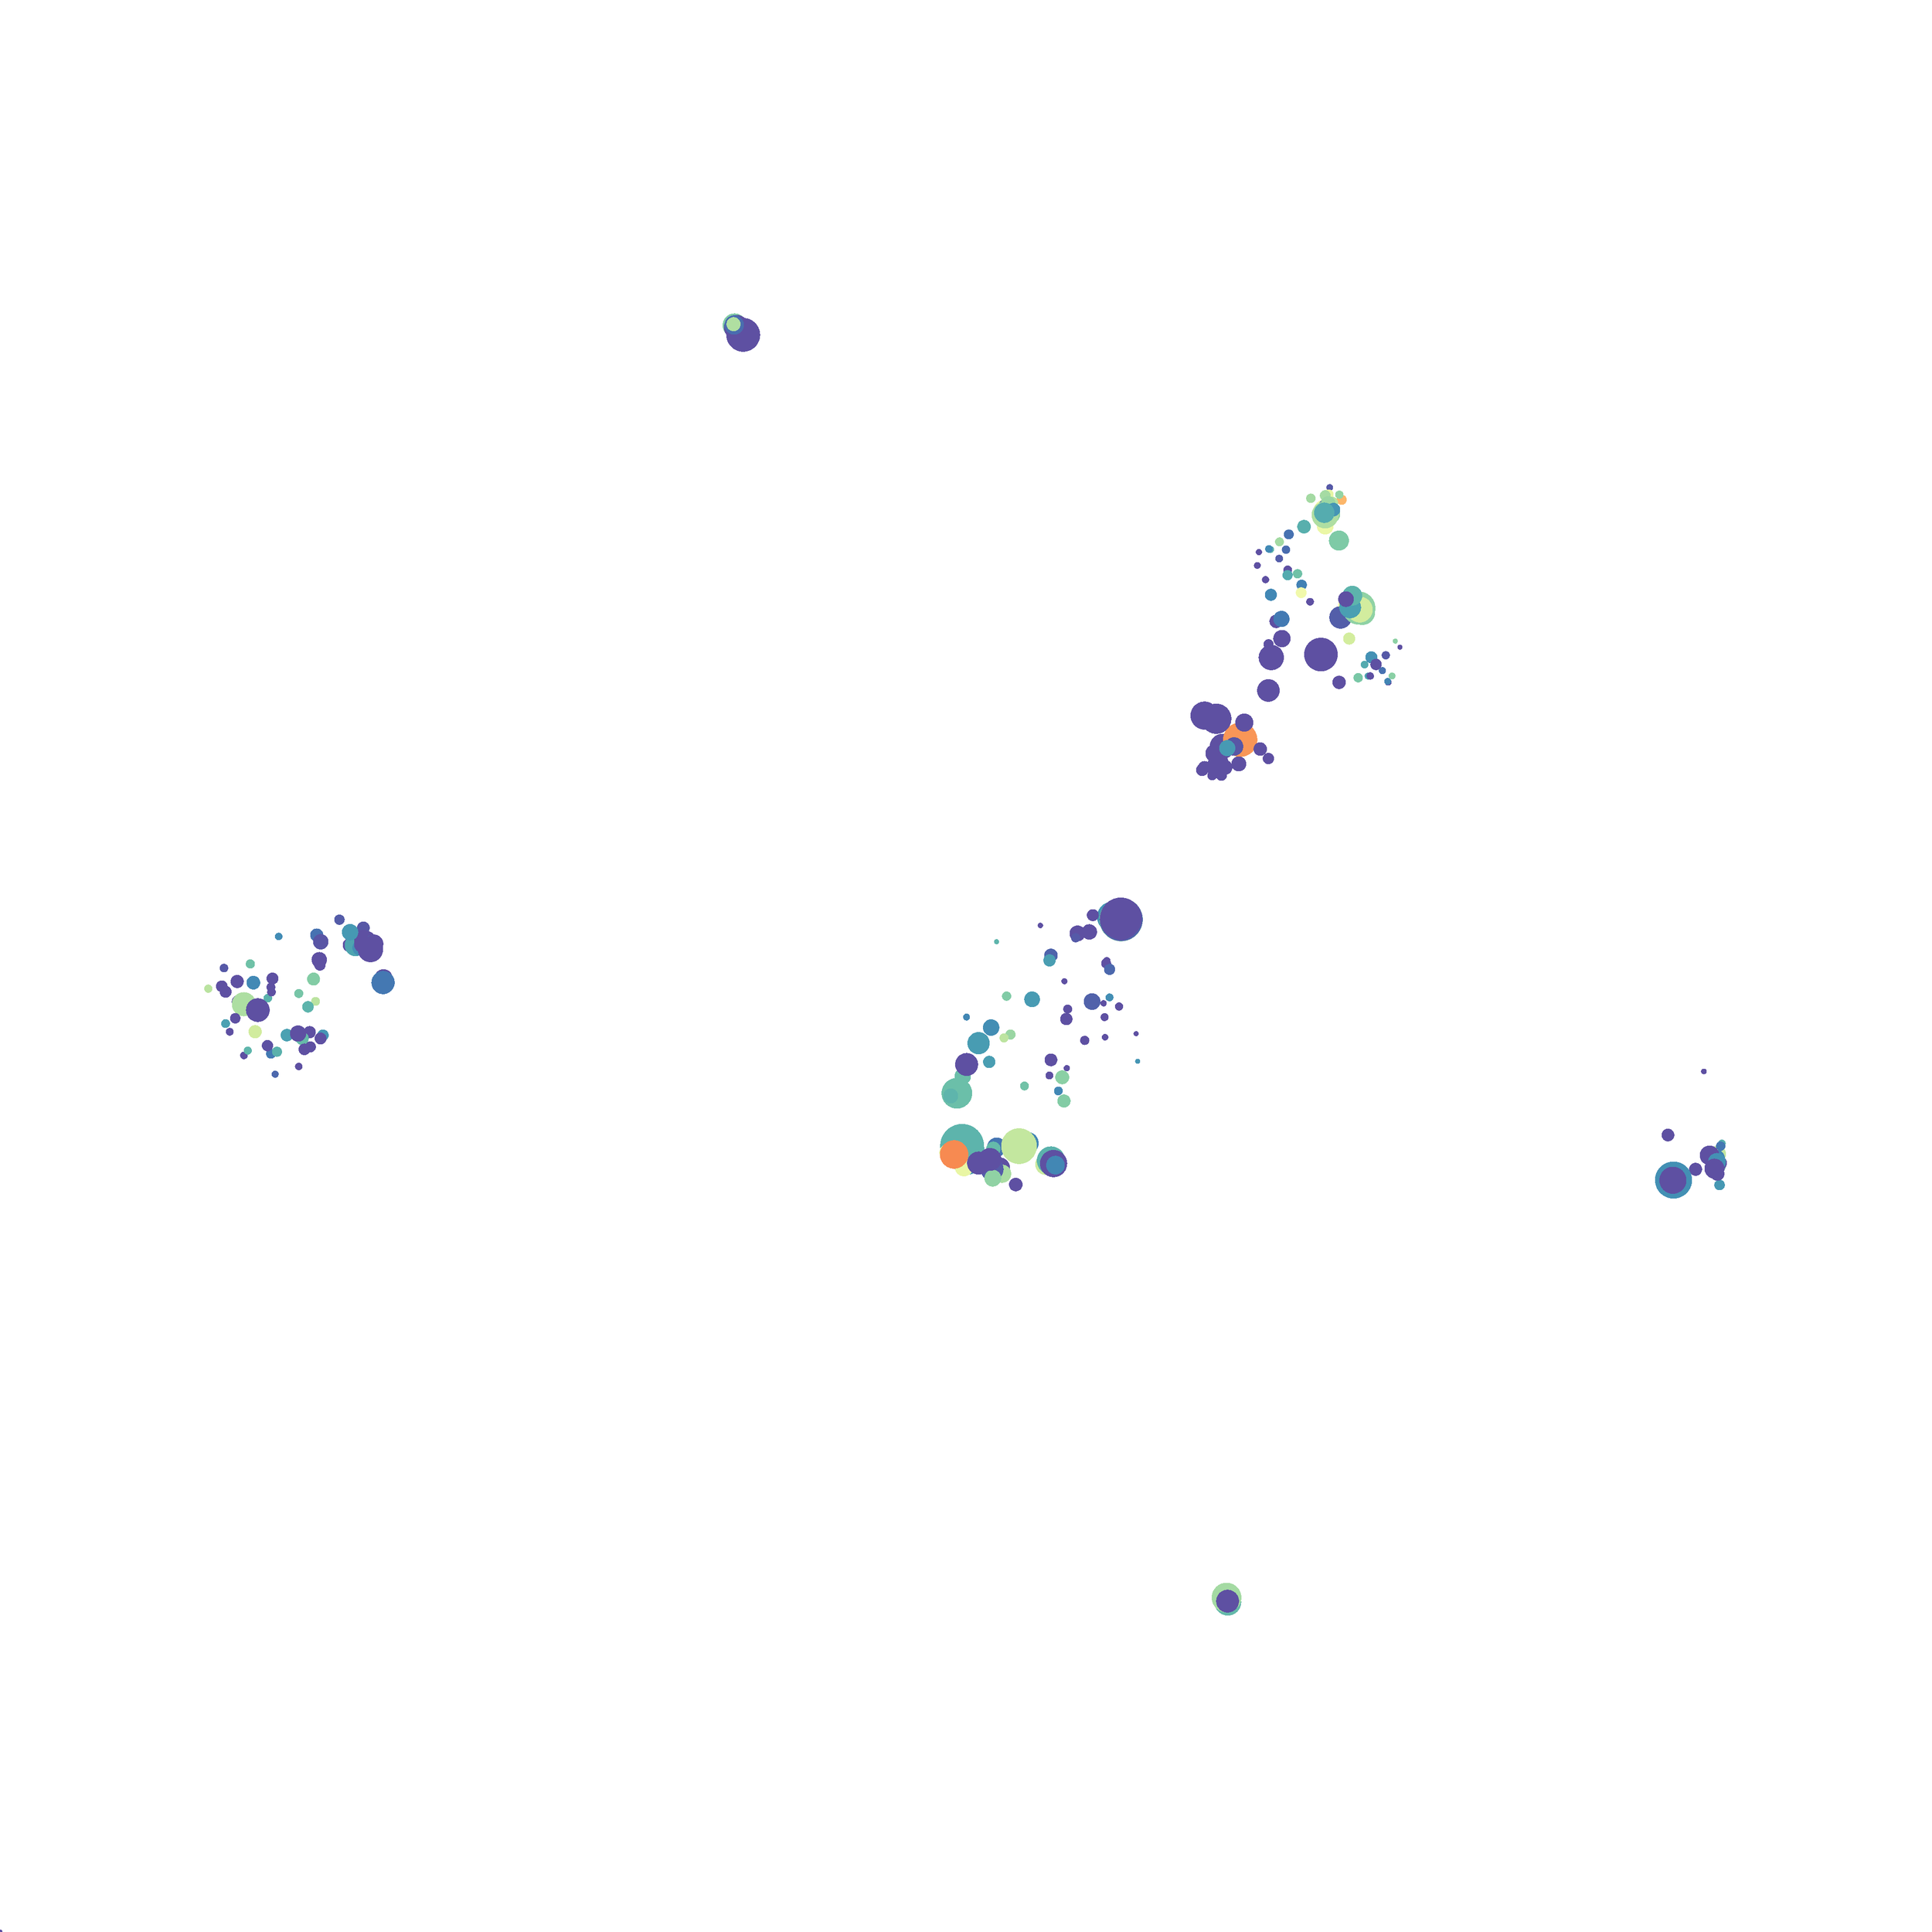
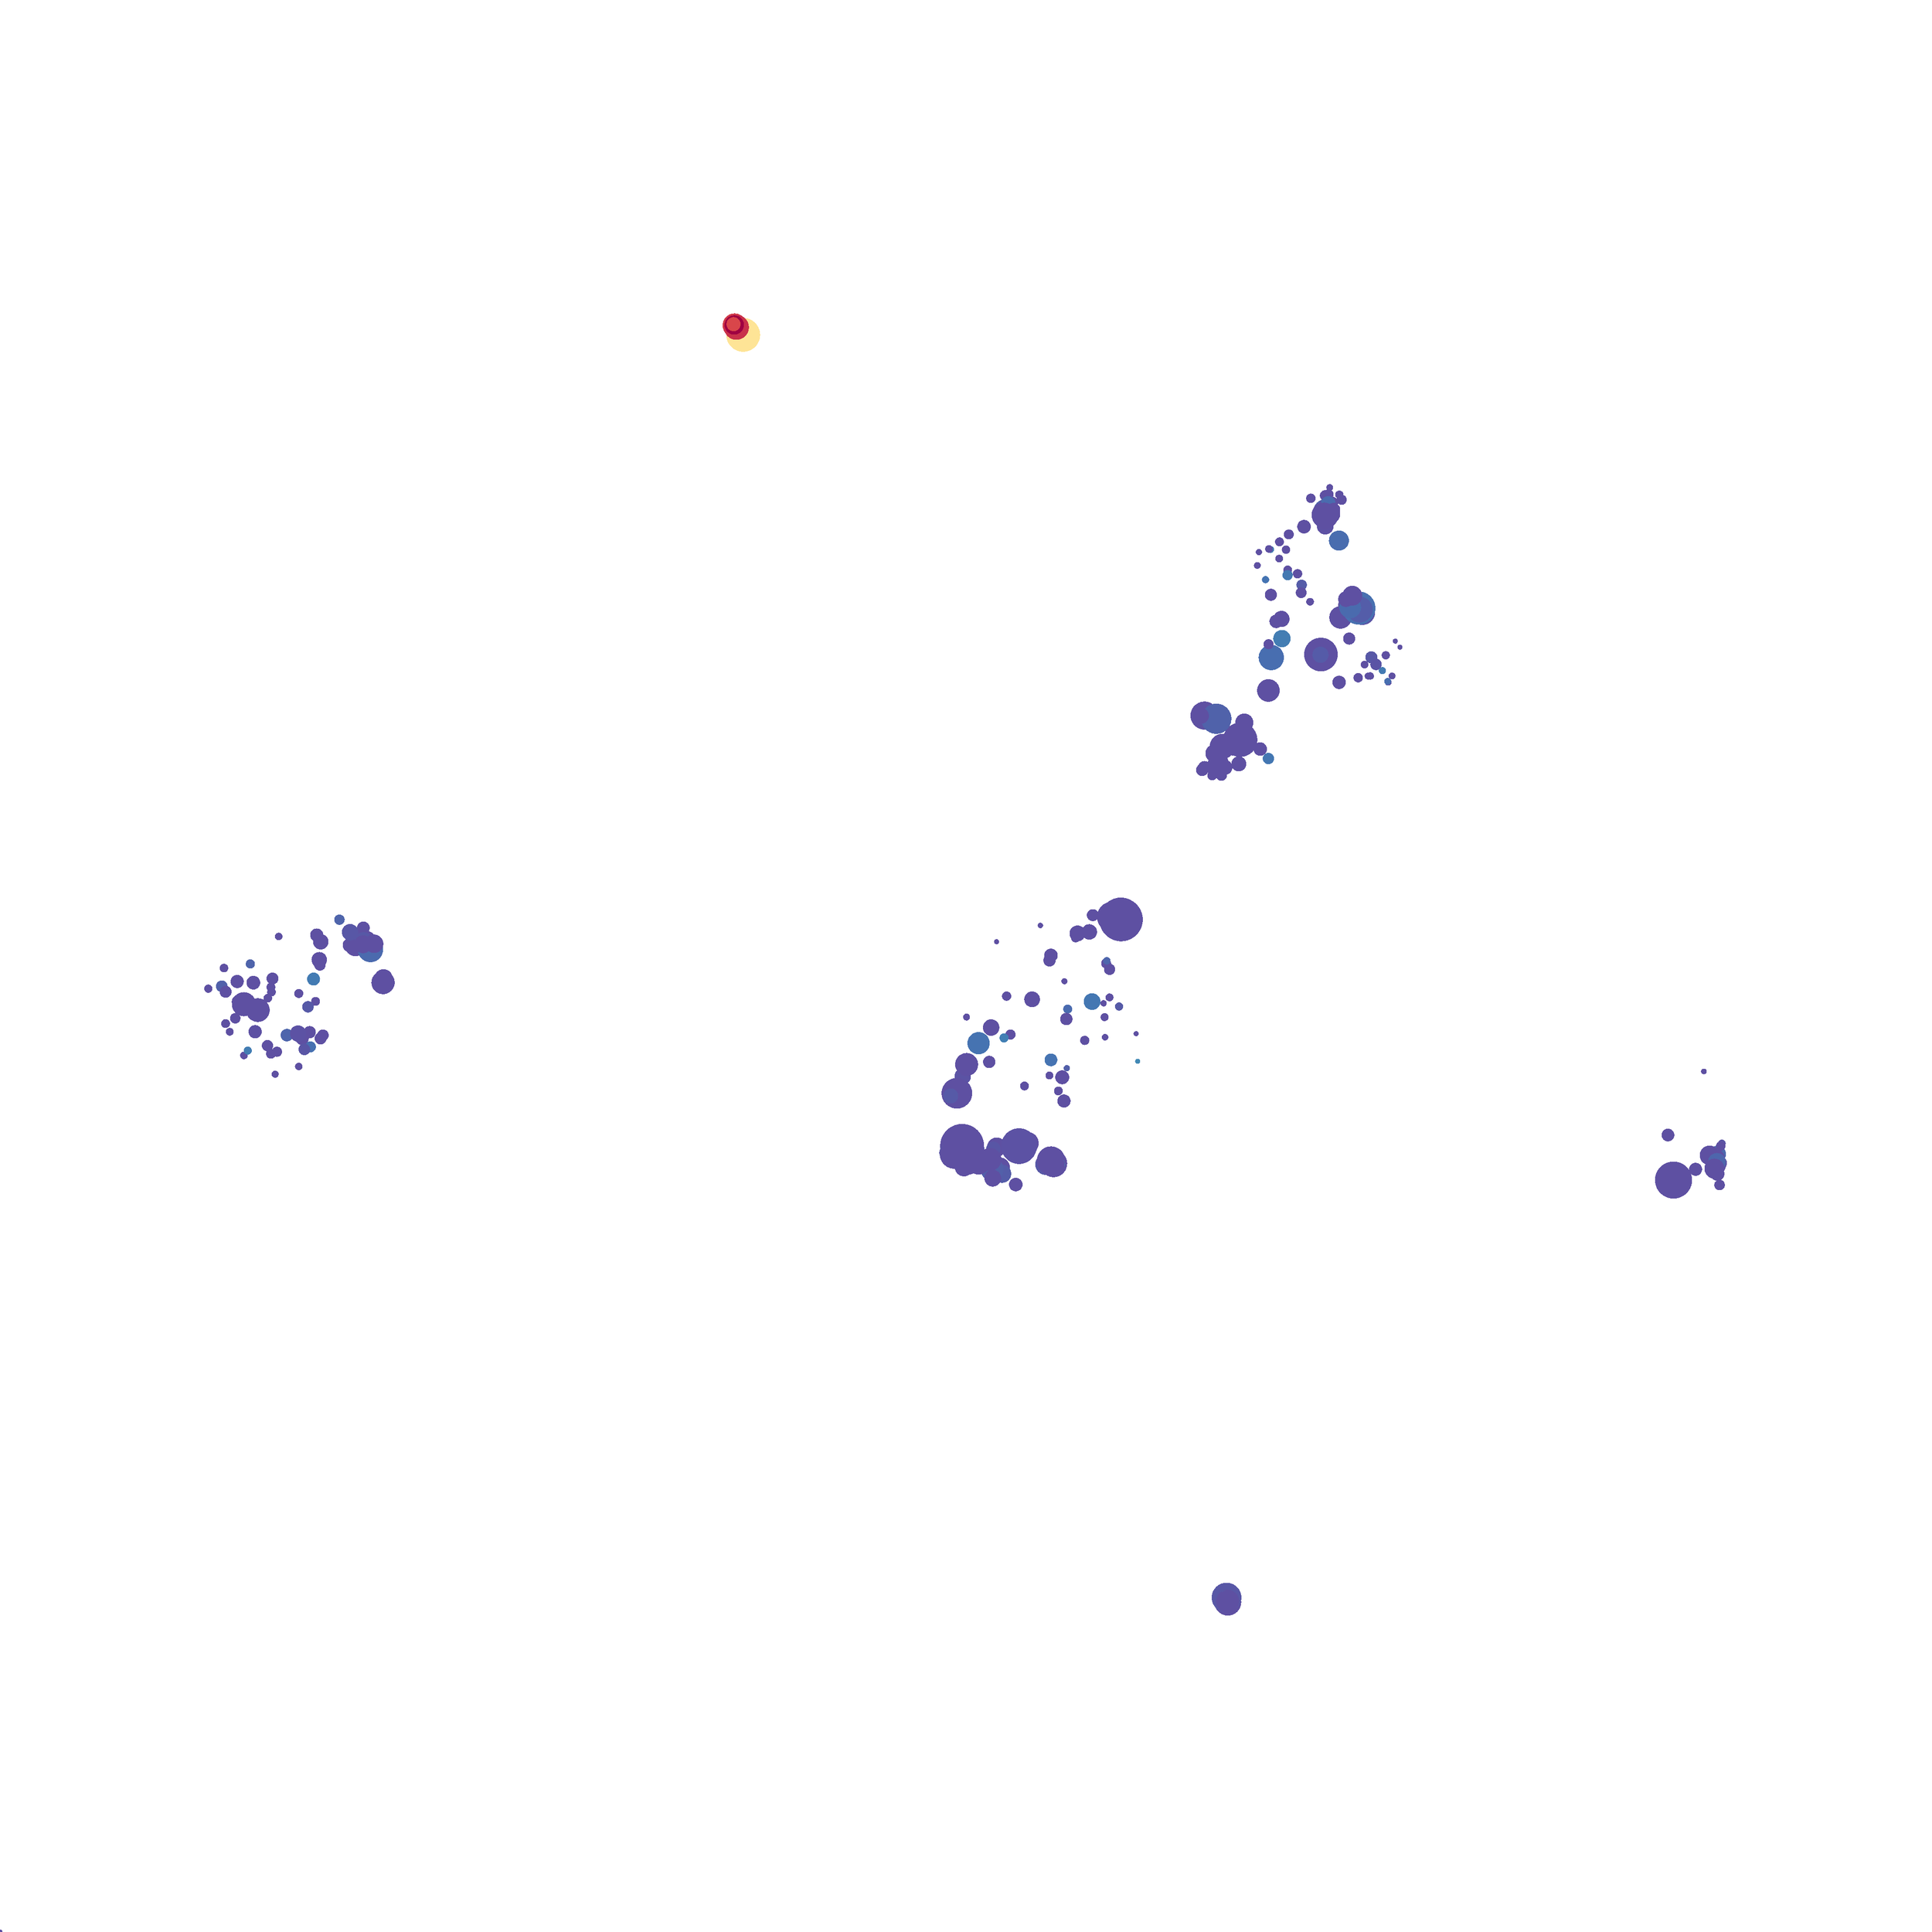
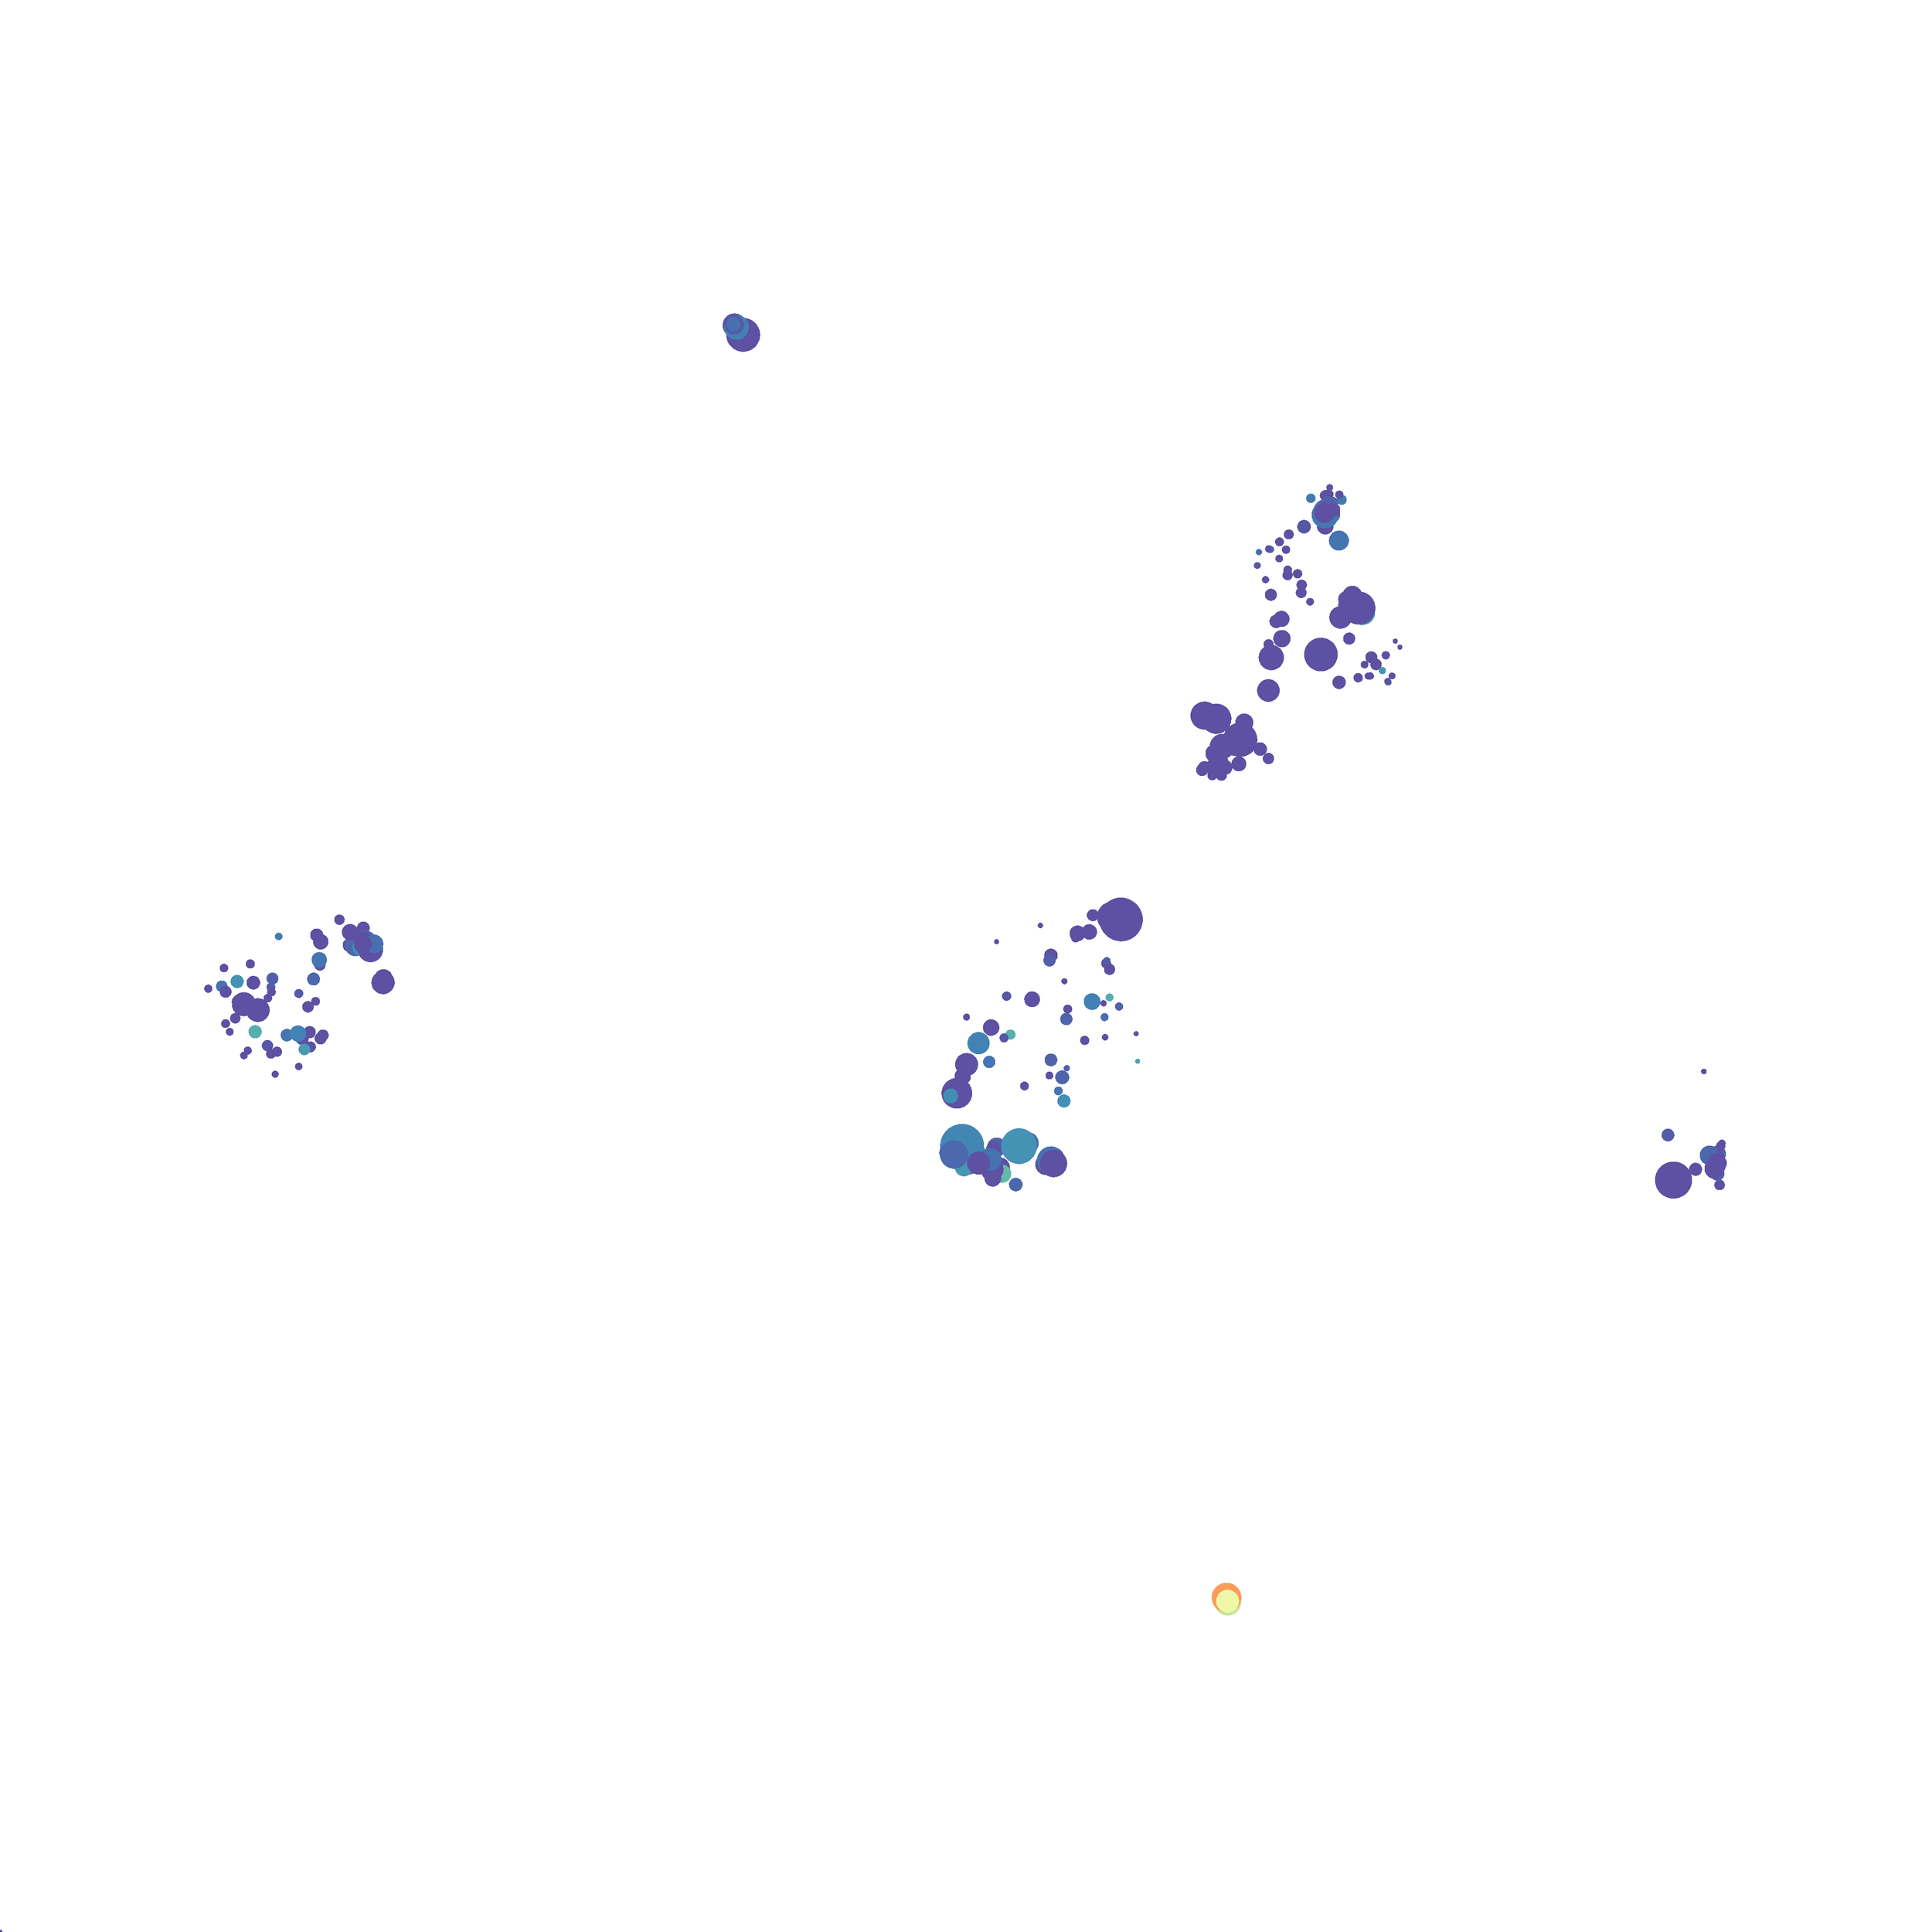
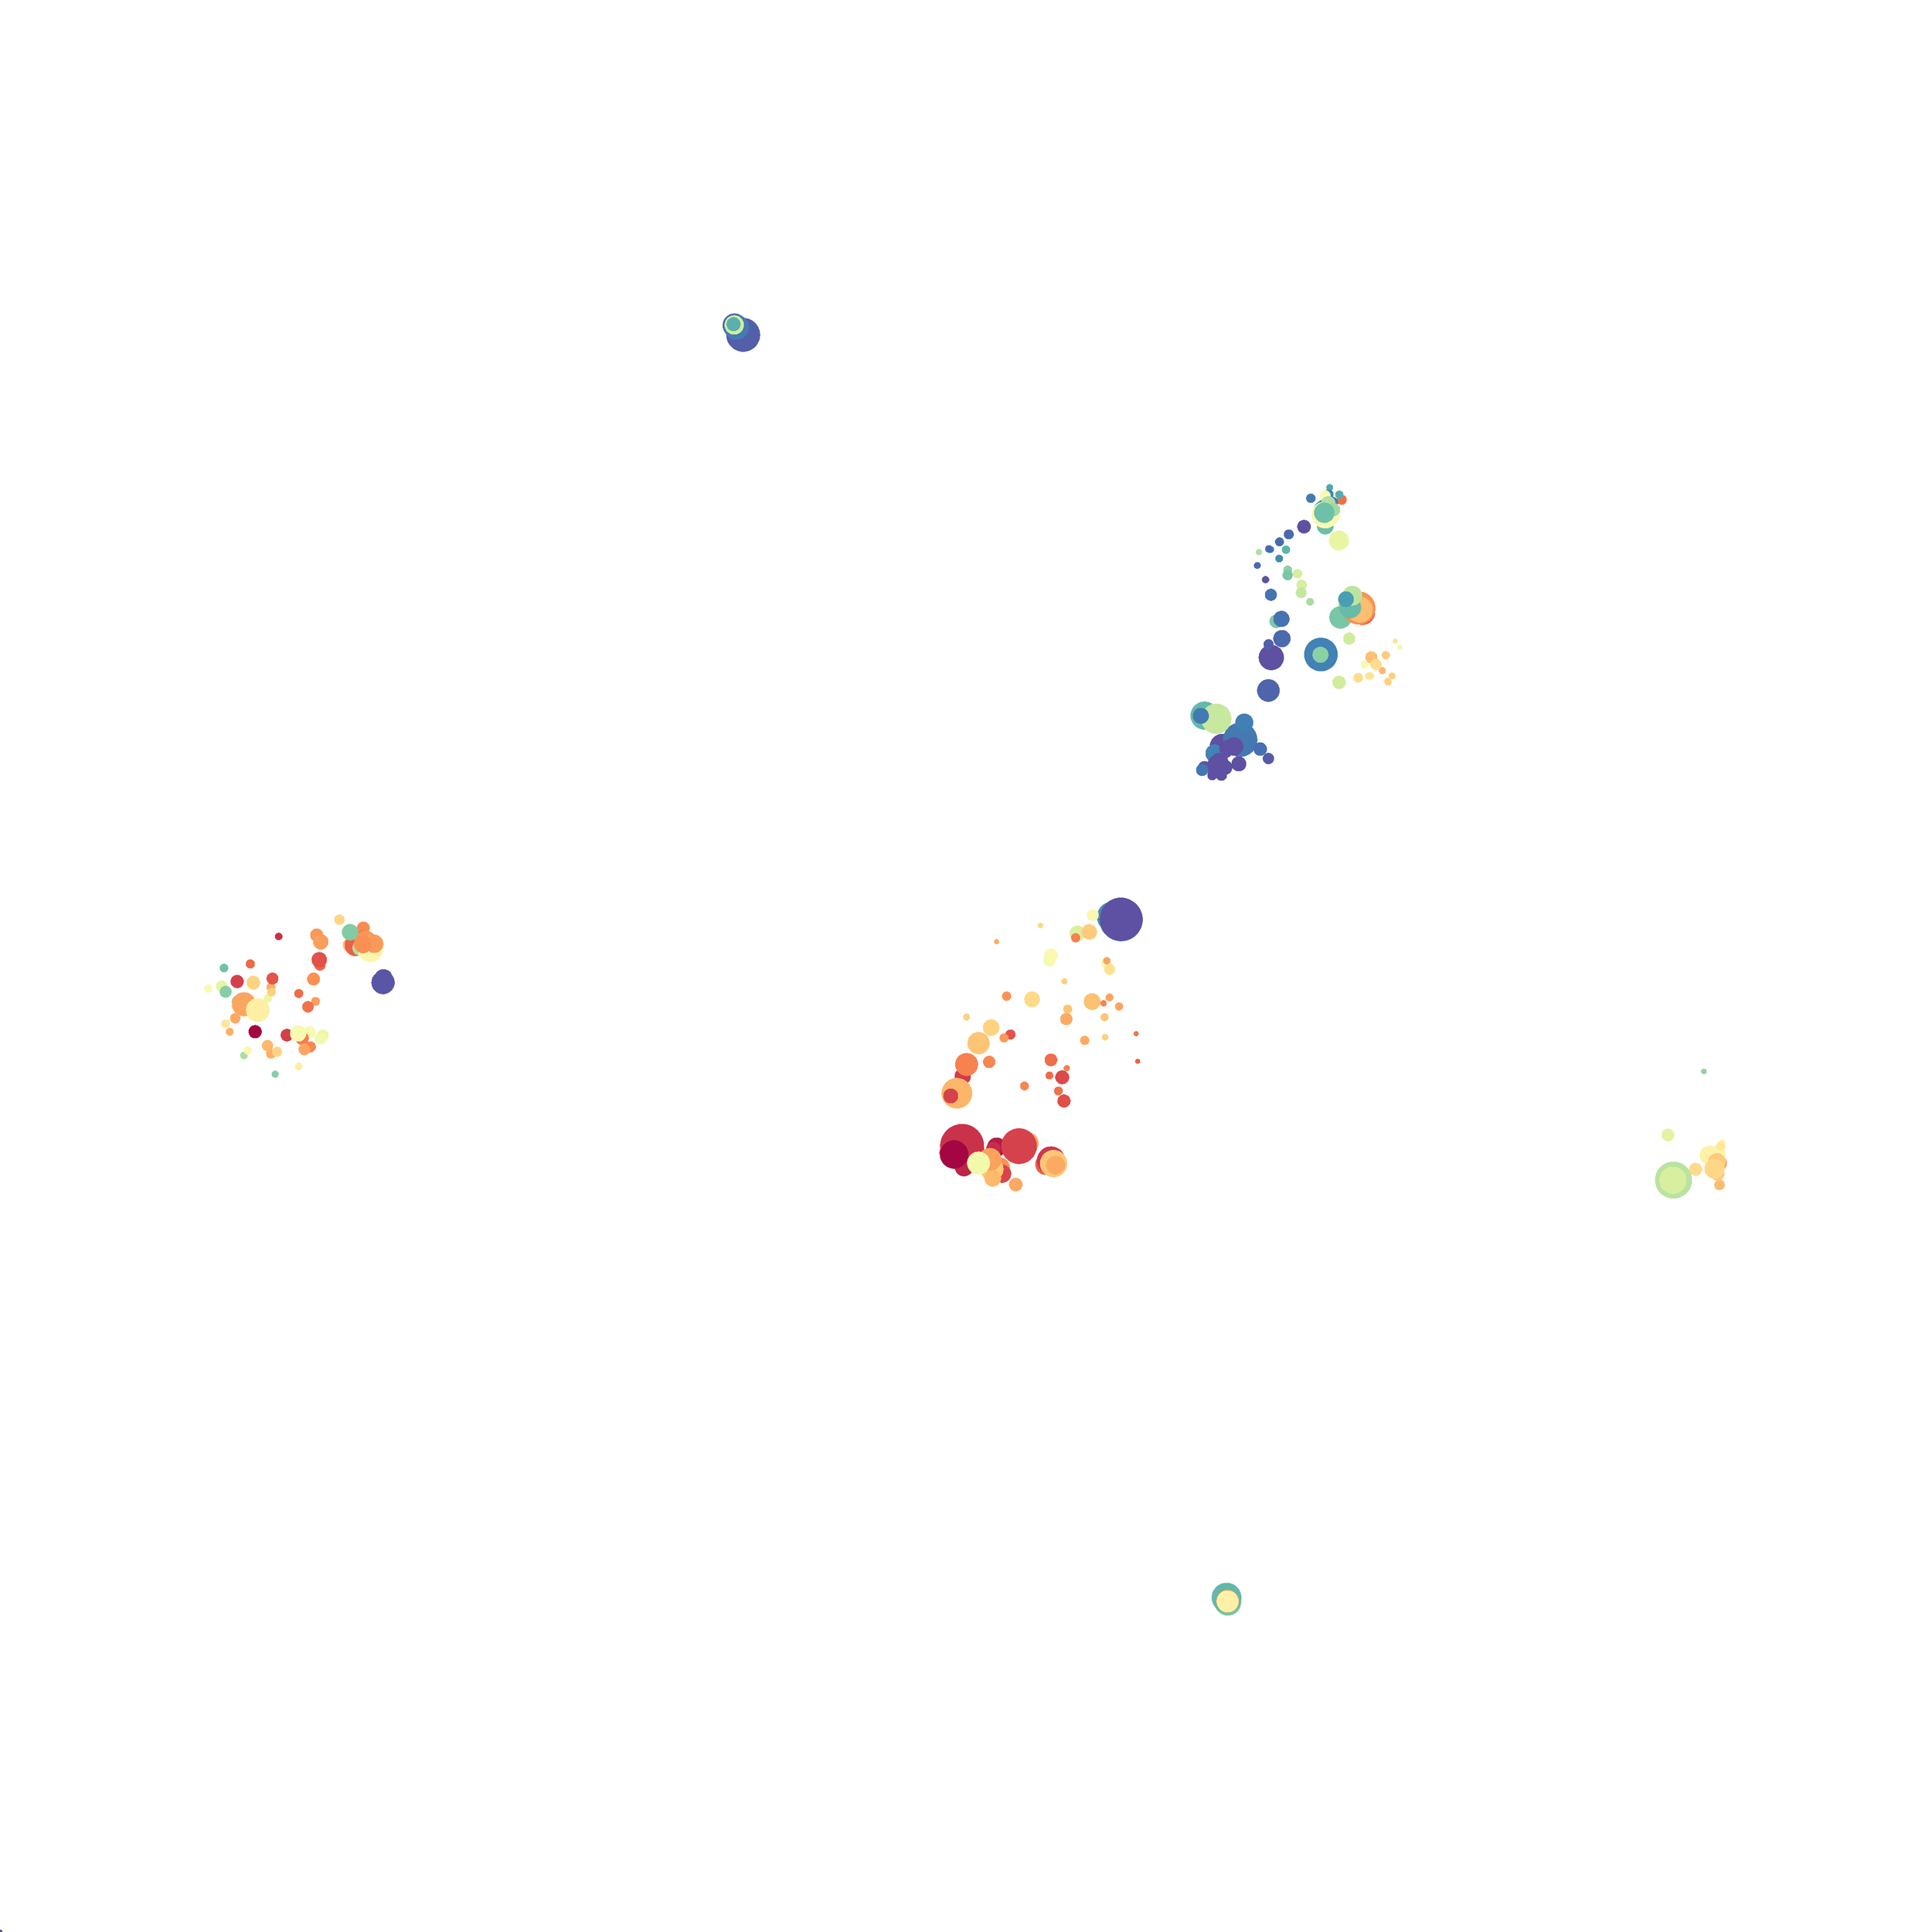
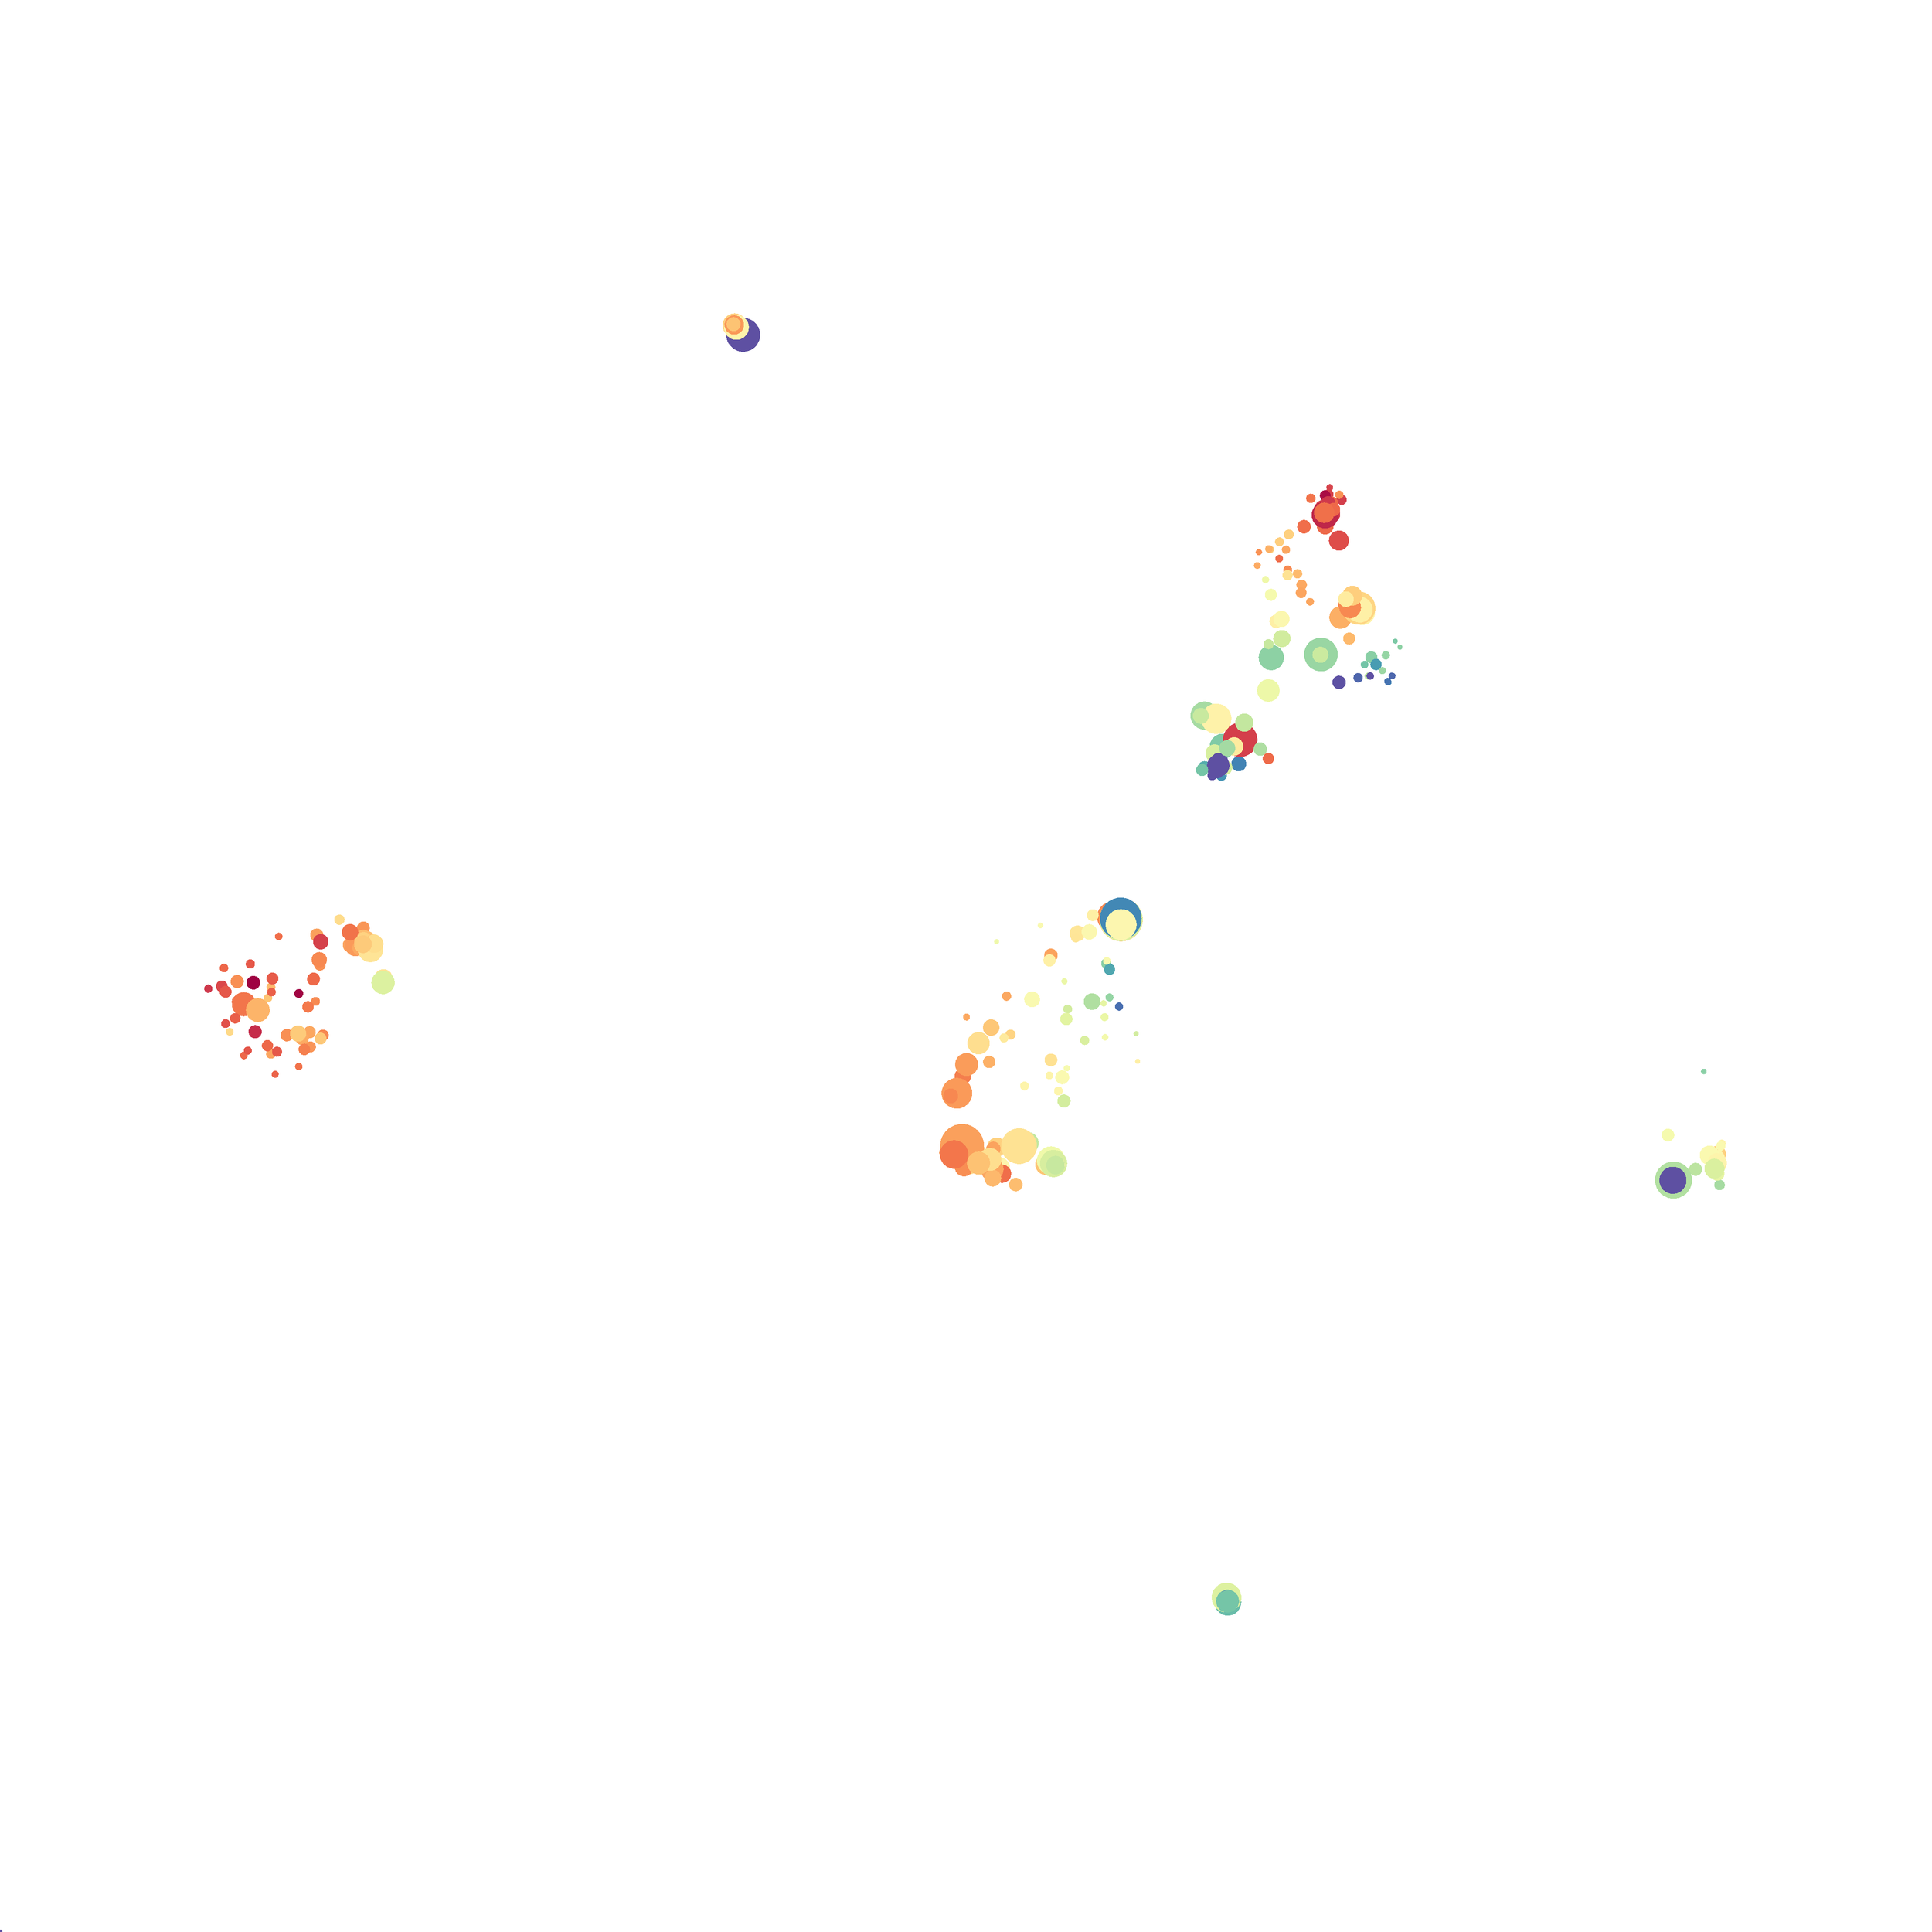
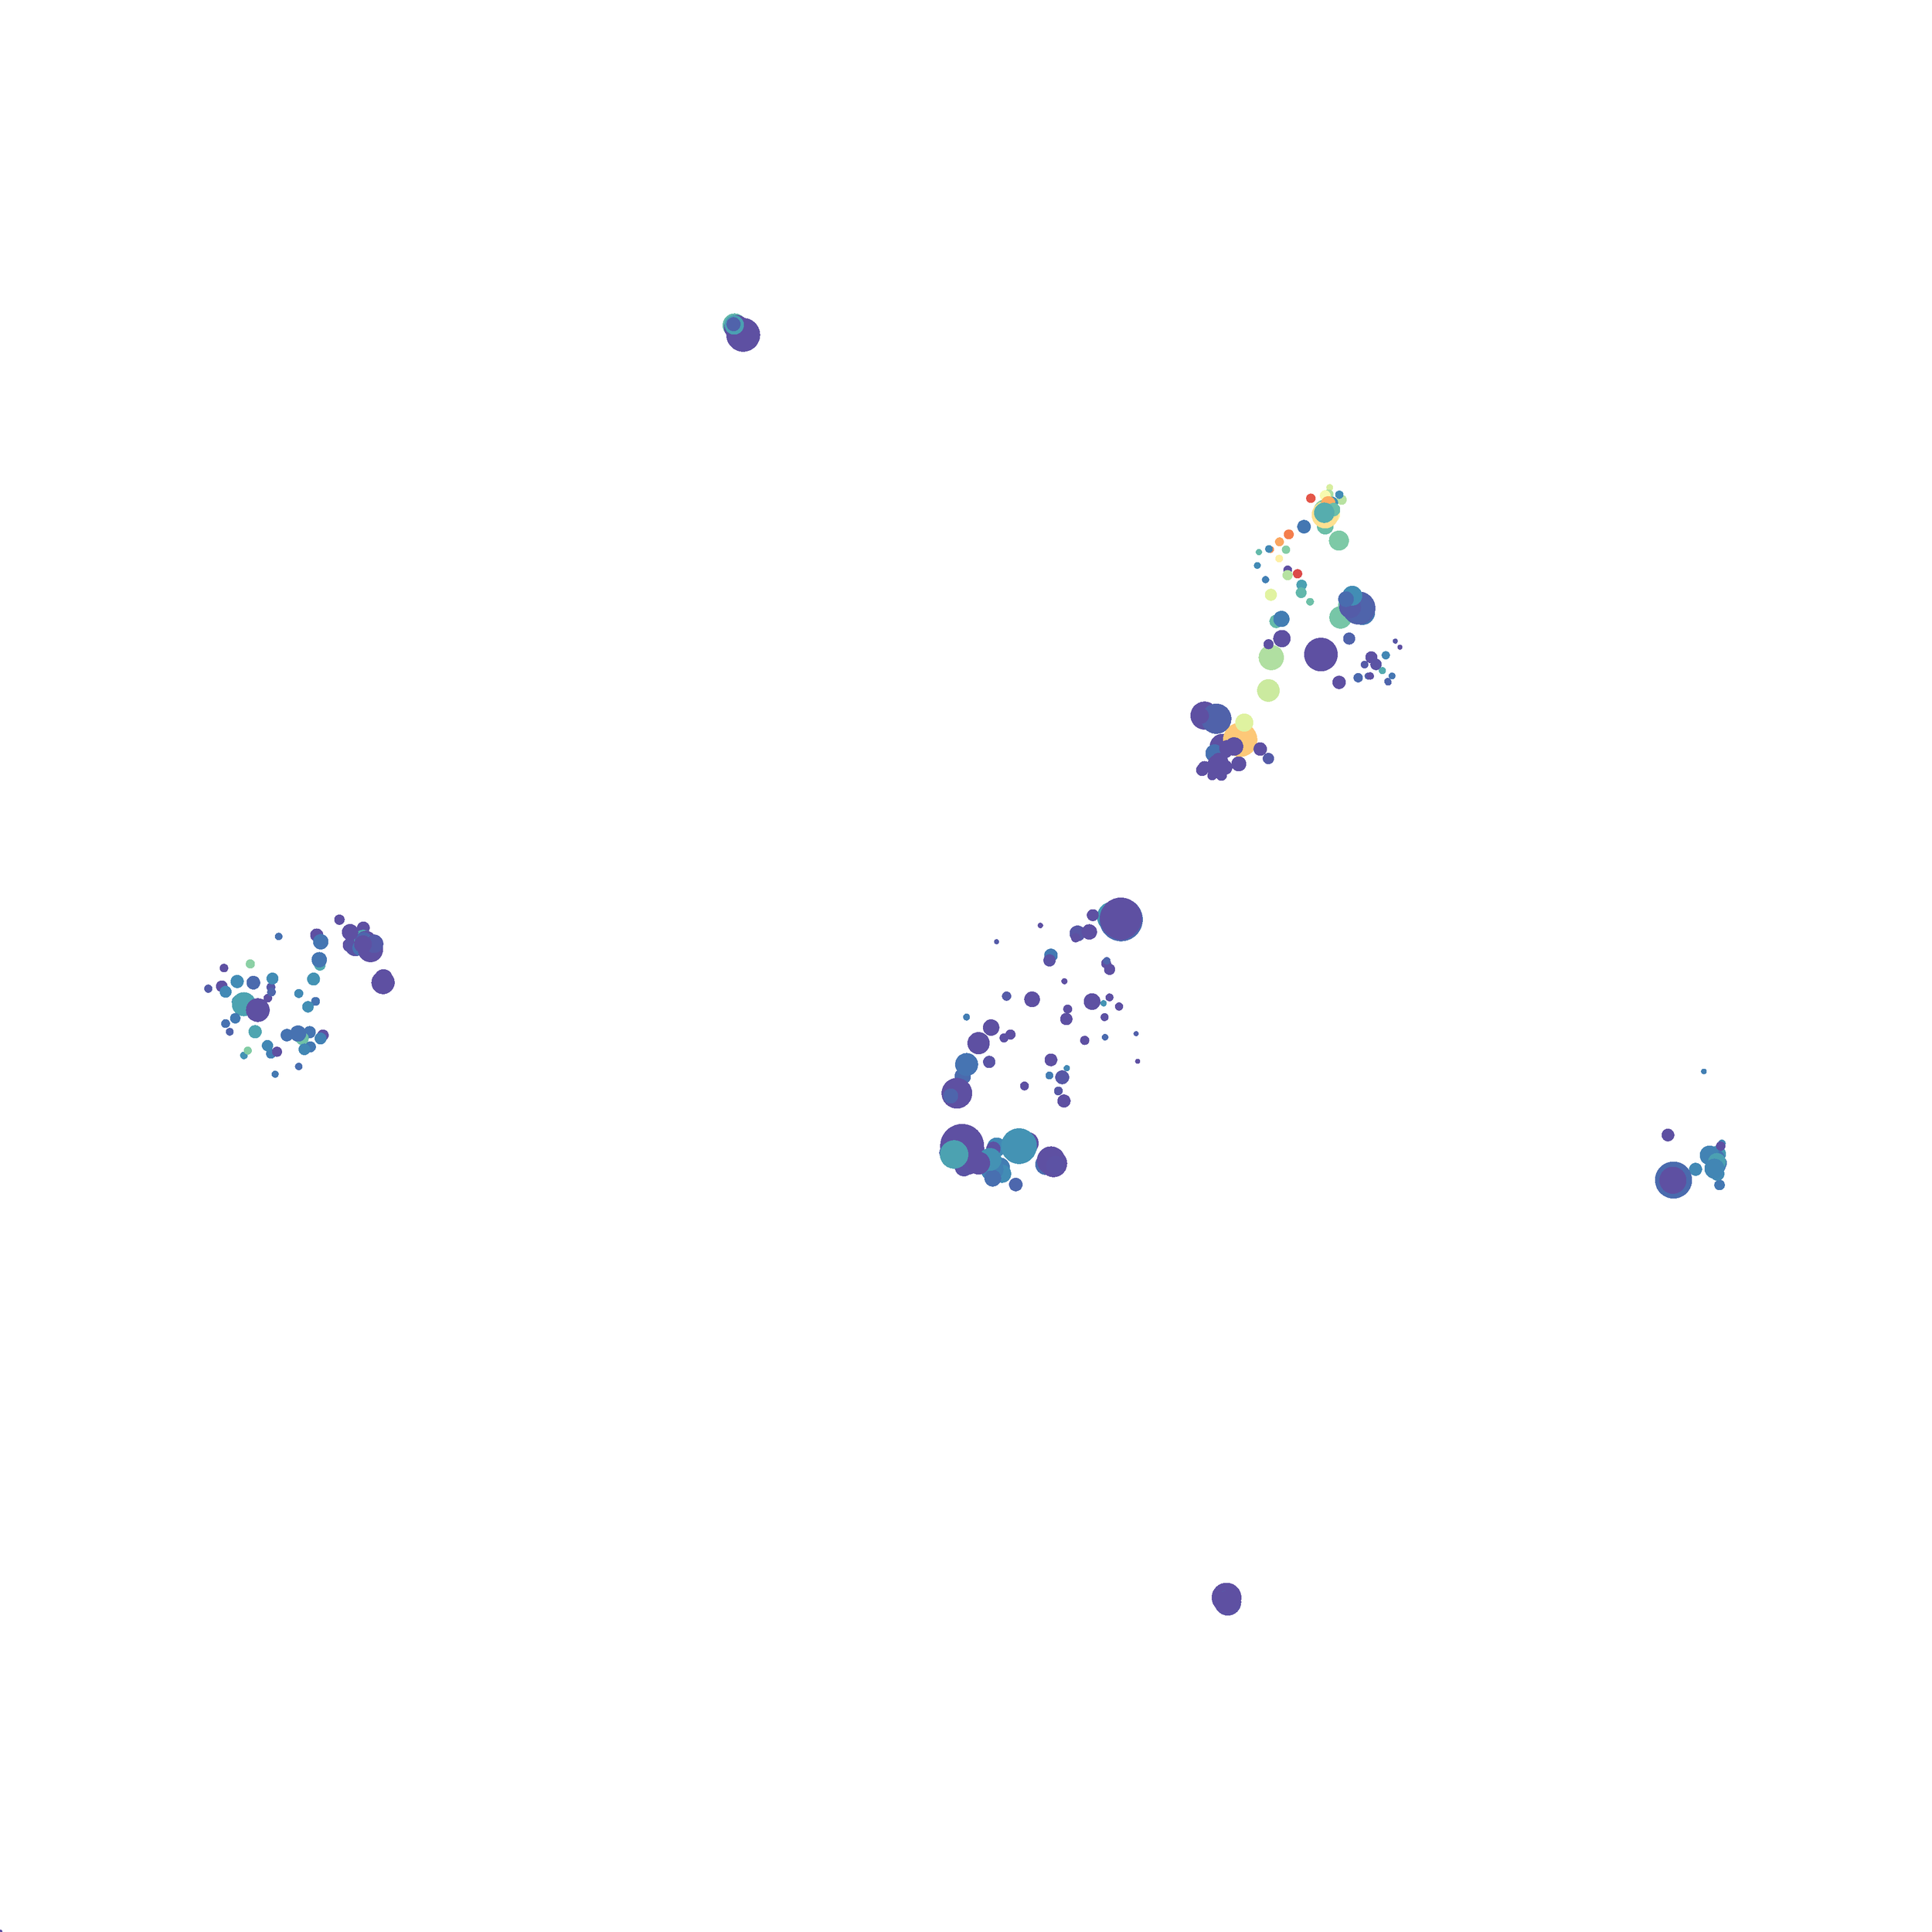
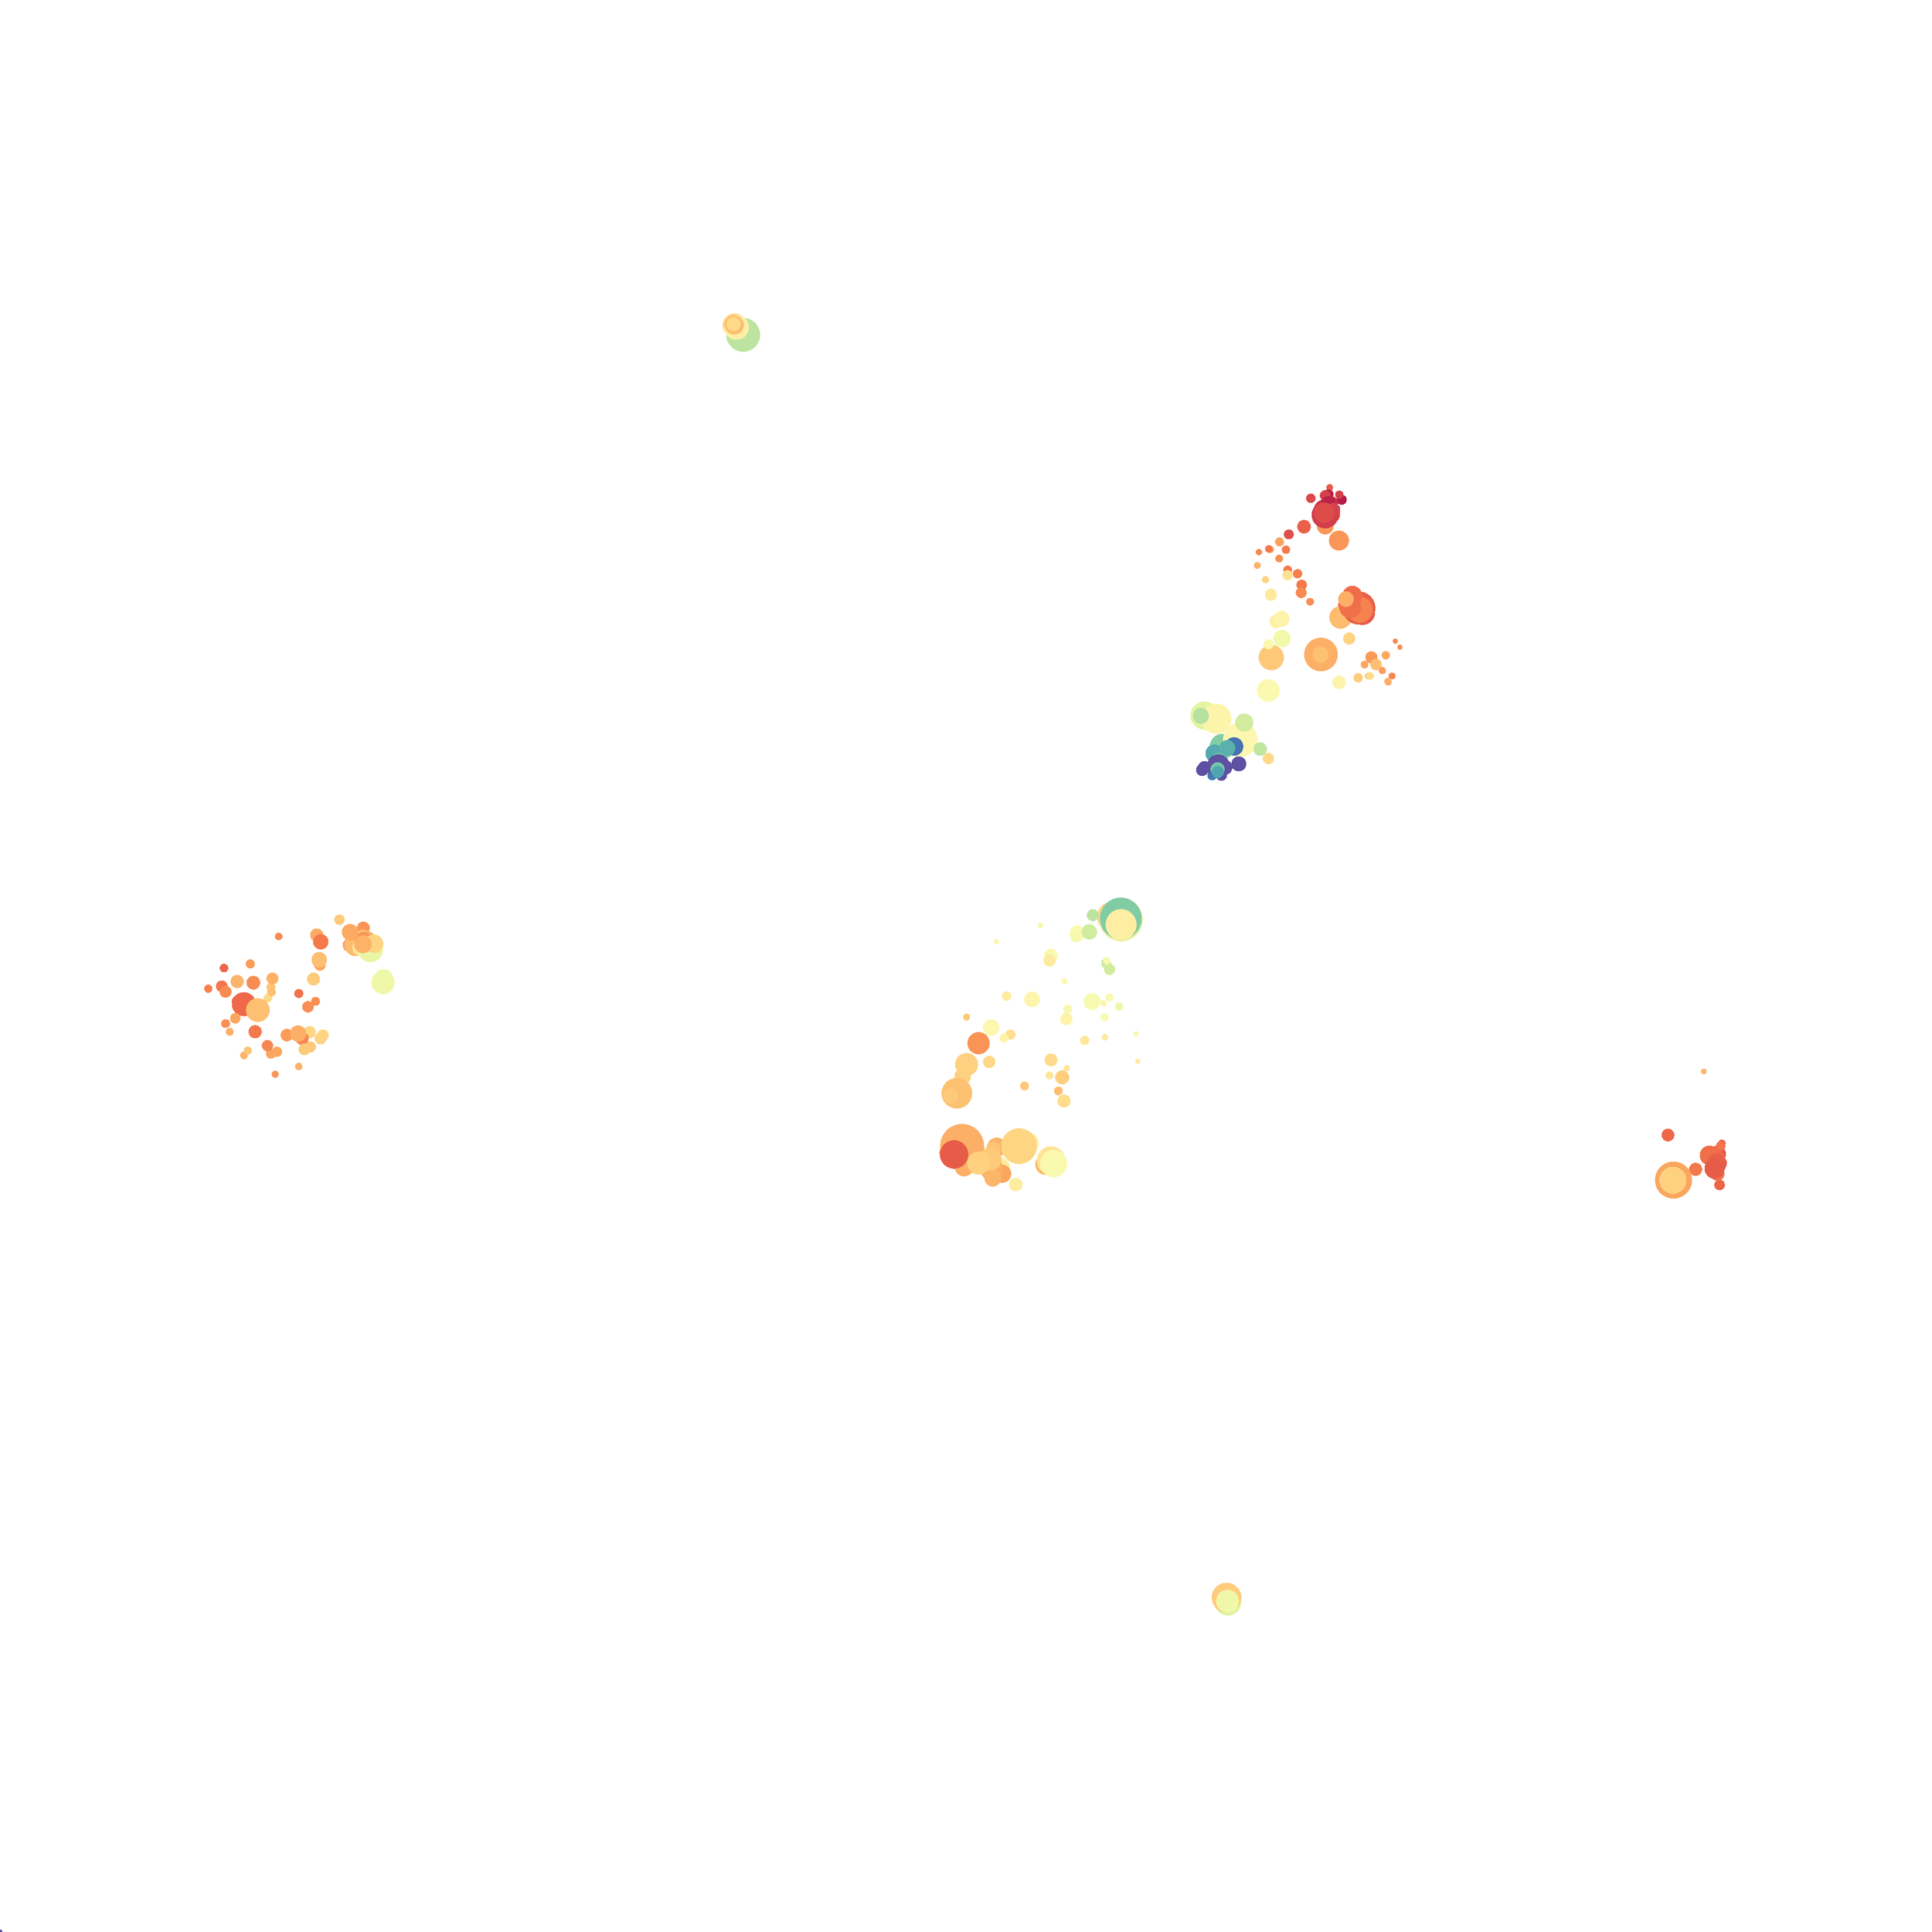
I then colored the events according to a variety of markers:
Cytosplore allows you to rapidly save tSNE plots colored by any parameter as high resolution .png files to your desktop:
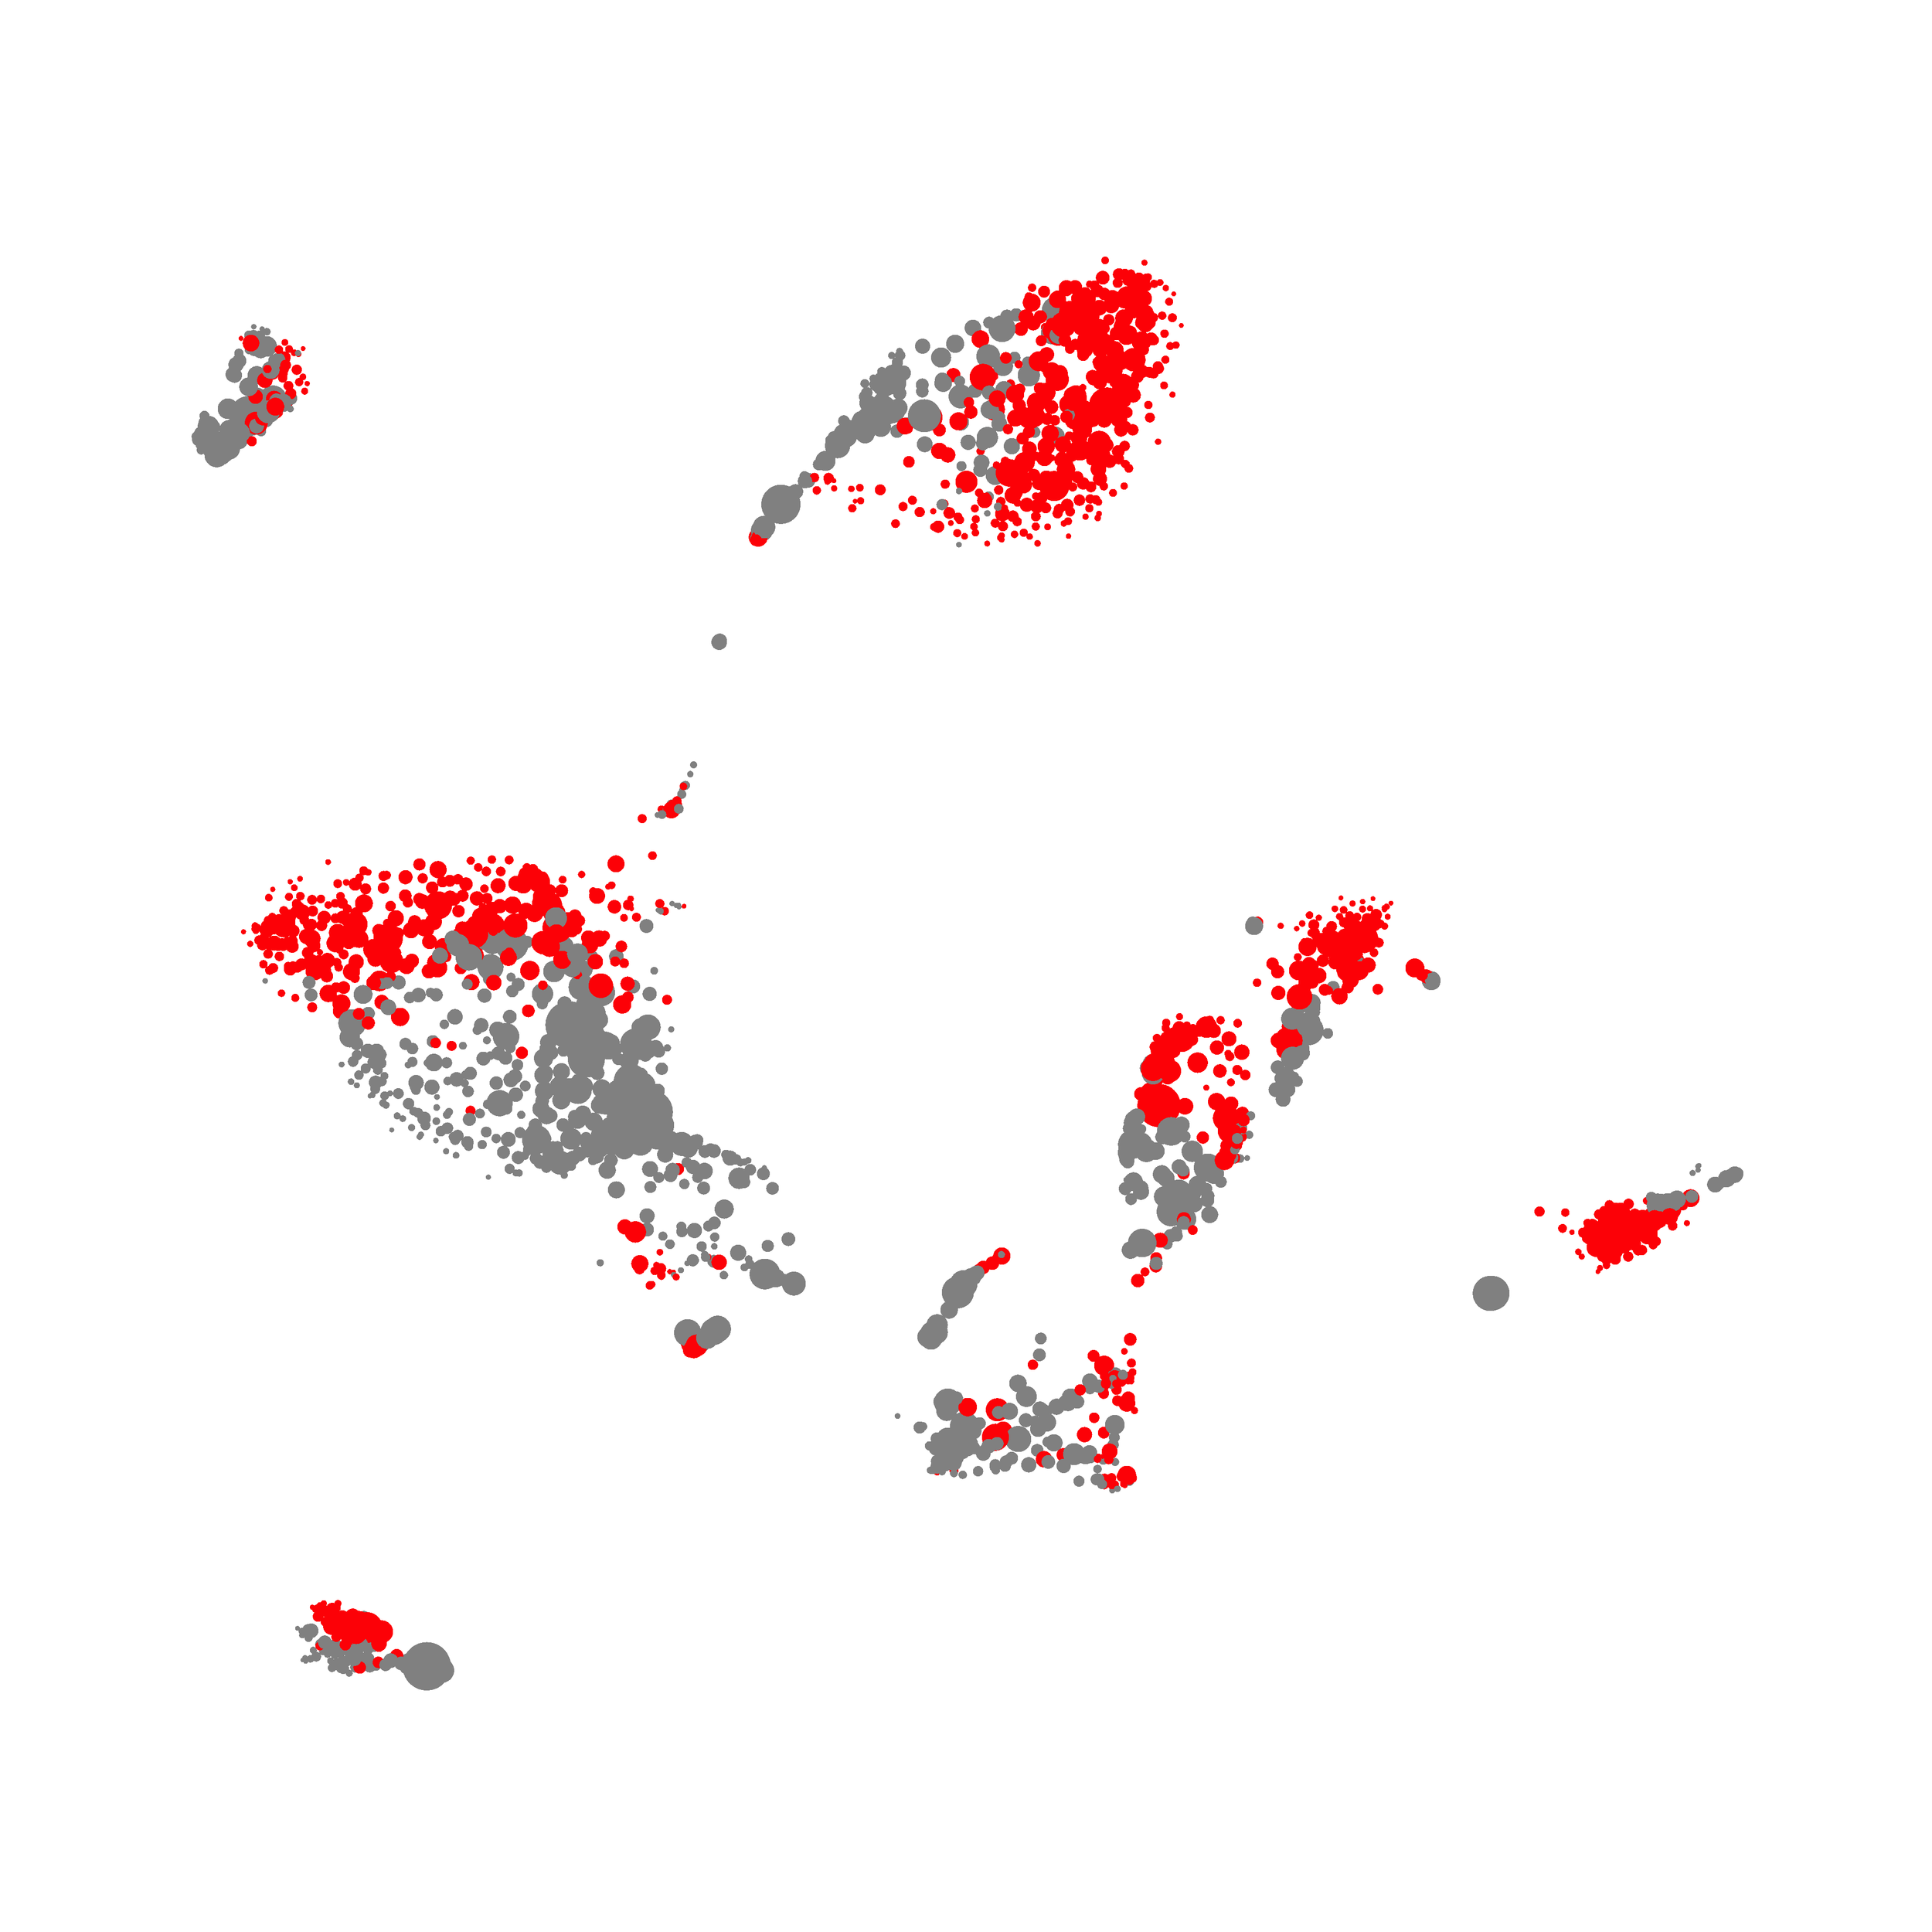
You can also color the tSNE plot by sample ID! Something that has been on my wishlist for a long time as viSNE and PhenoGraph doesn’t have this feature. Much like PhenoGraph, you can also check on and off certain samples, so you can visualize particular events on the tSNE plot.
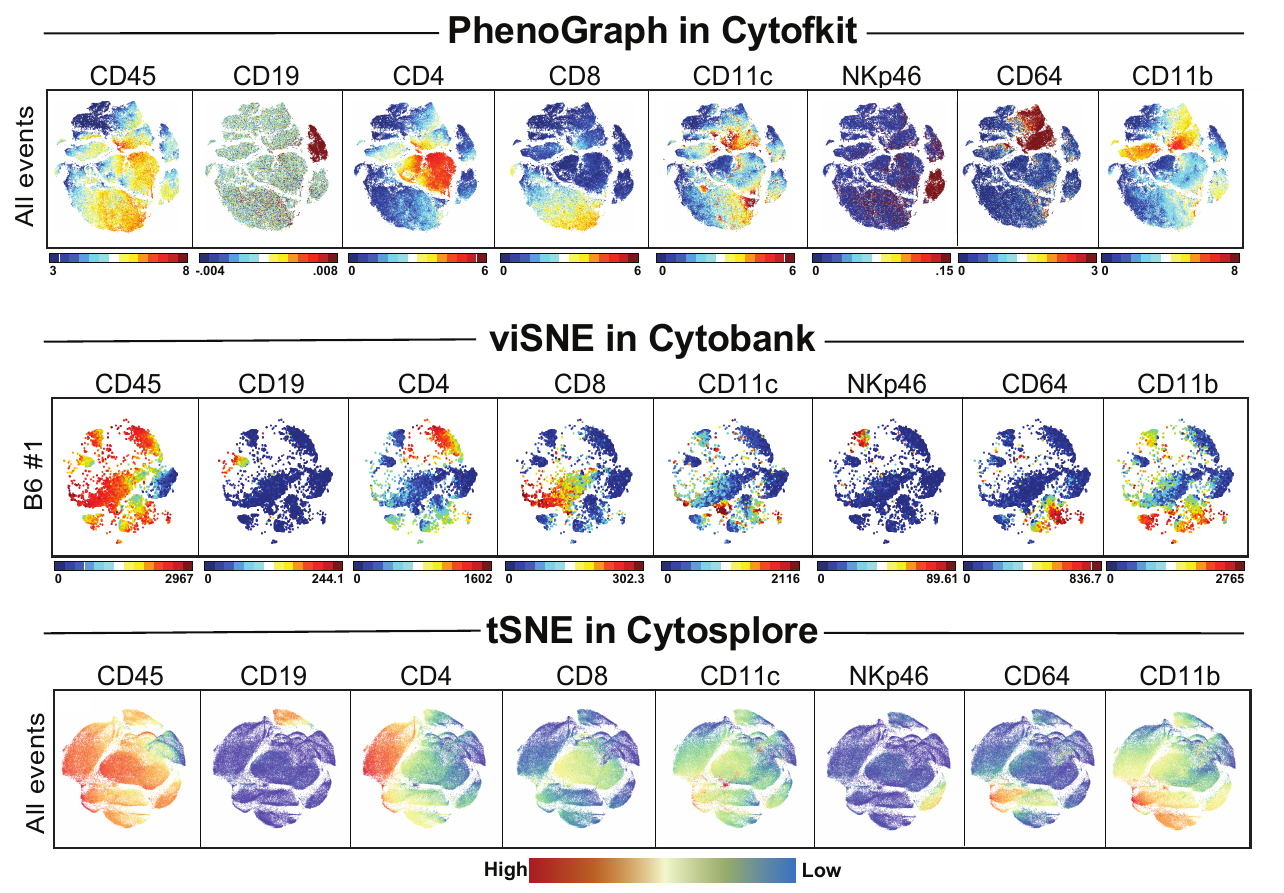
I wanted to compare how these plots look to those generated by viSNE (Cytobank) and PhenoGraph. Overall they look very similar in expression and cluster organization. Cytosplore allows you to customize your expression scale, so you can change the minimum and maximum values.
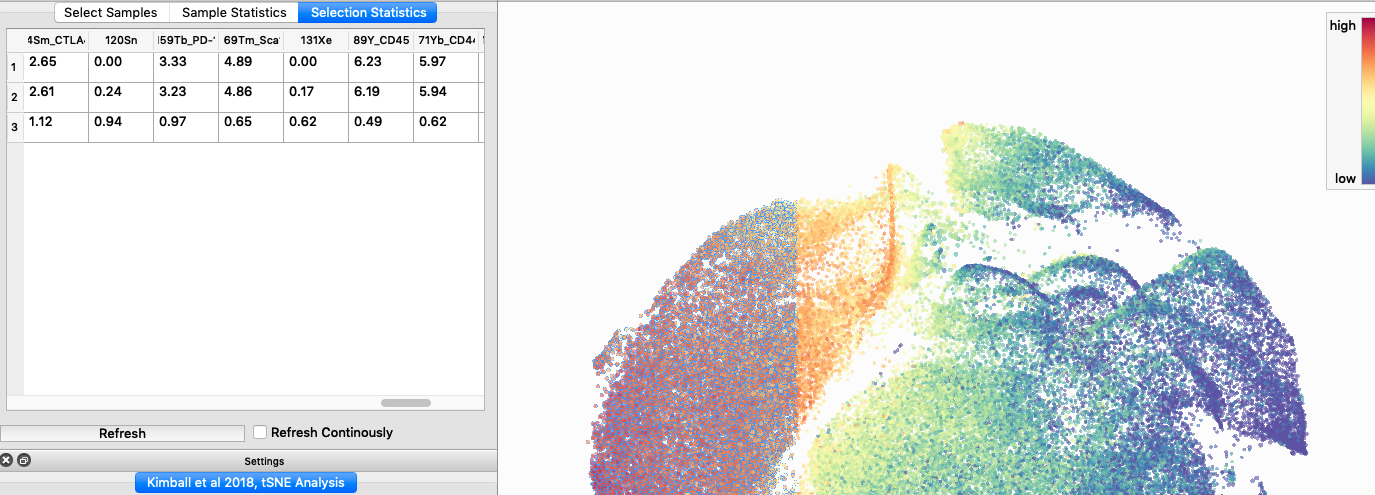
You can also select specific events, look at abundance and expression data, and export this data as a .csv file. This is very useful and intuitive, however, a major complaint I have is that you cannot create a customizable shape for gating events of interest. Instead, you must select them using a rectangular/square shape, this limits the users dexterity to pick specific events of interest.

Using the HSNE Algorithm in Cytosplore
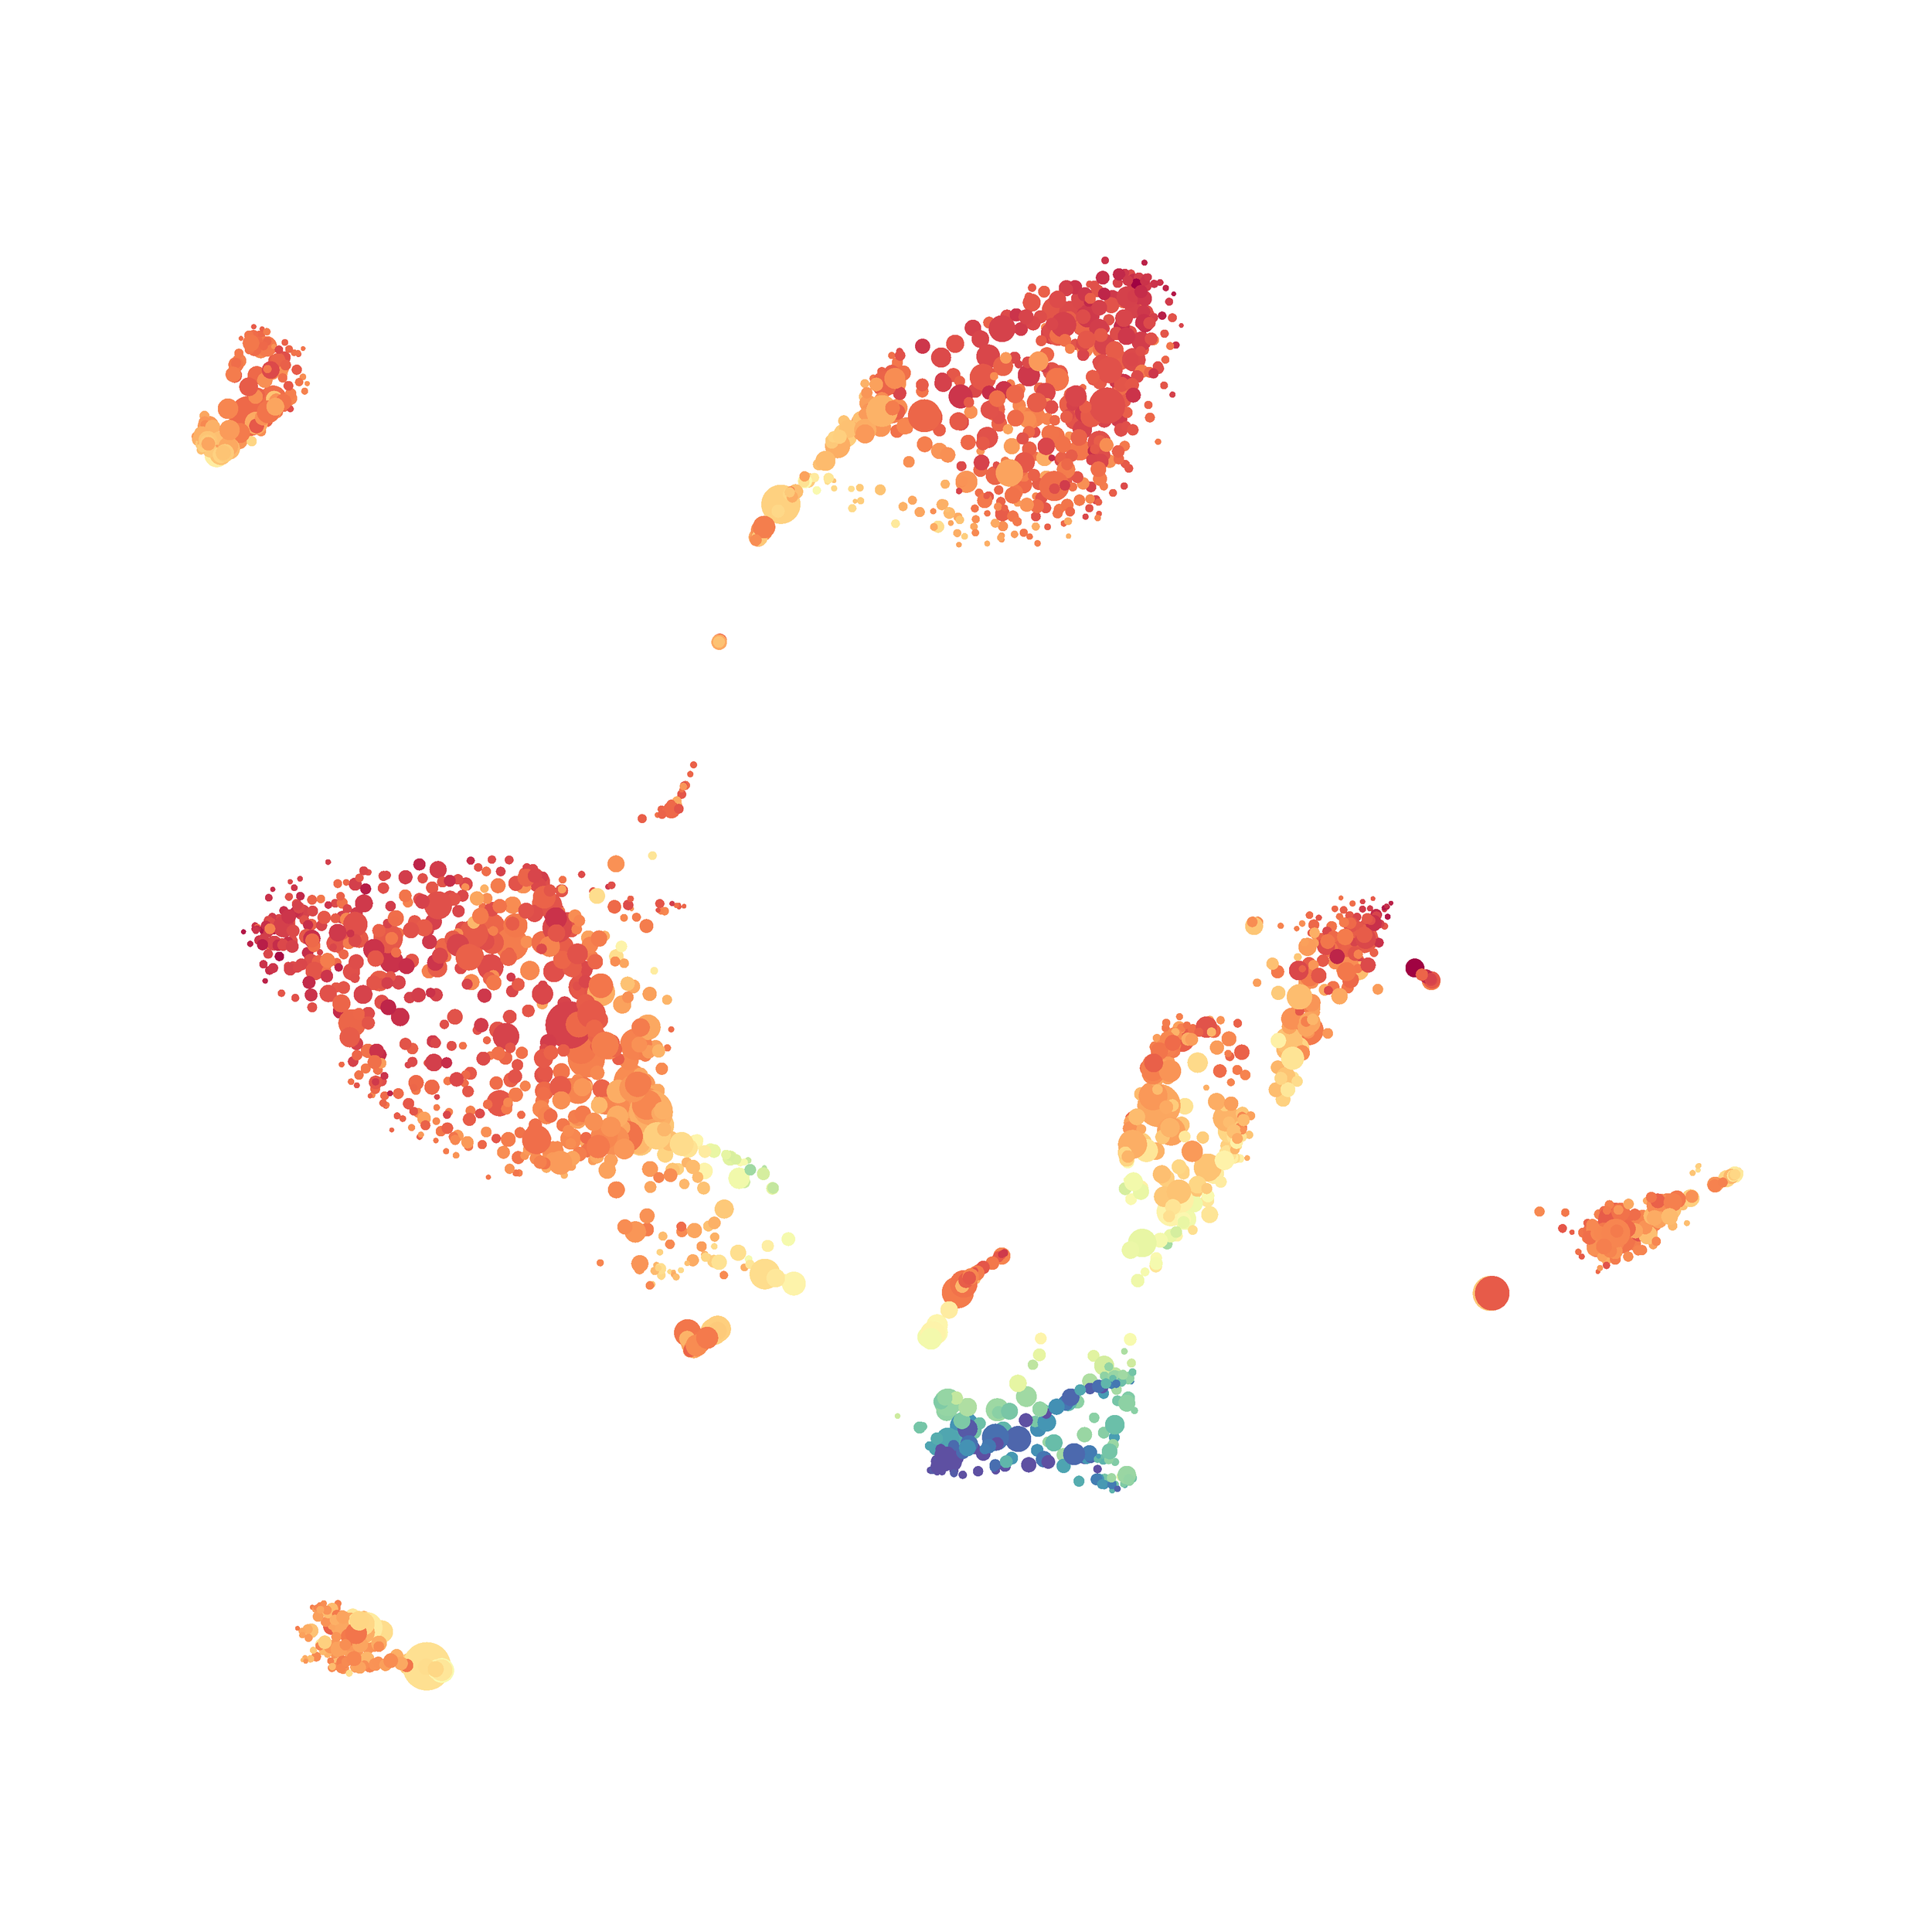
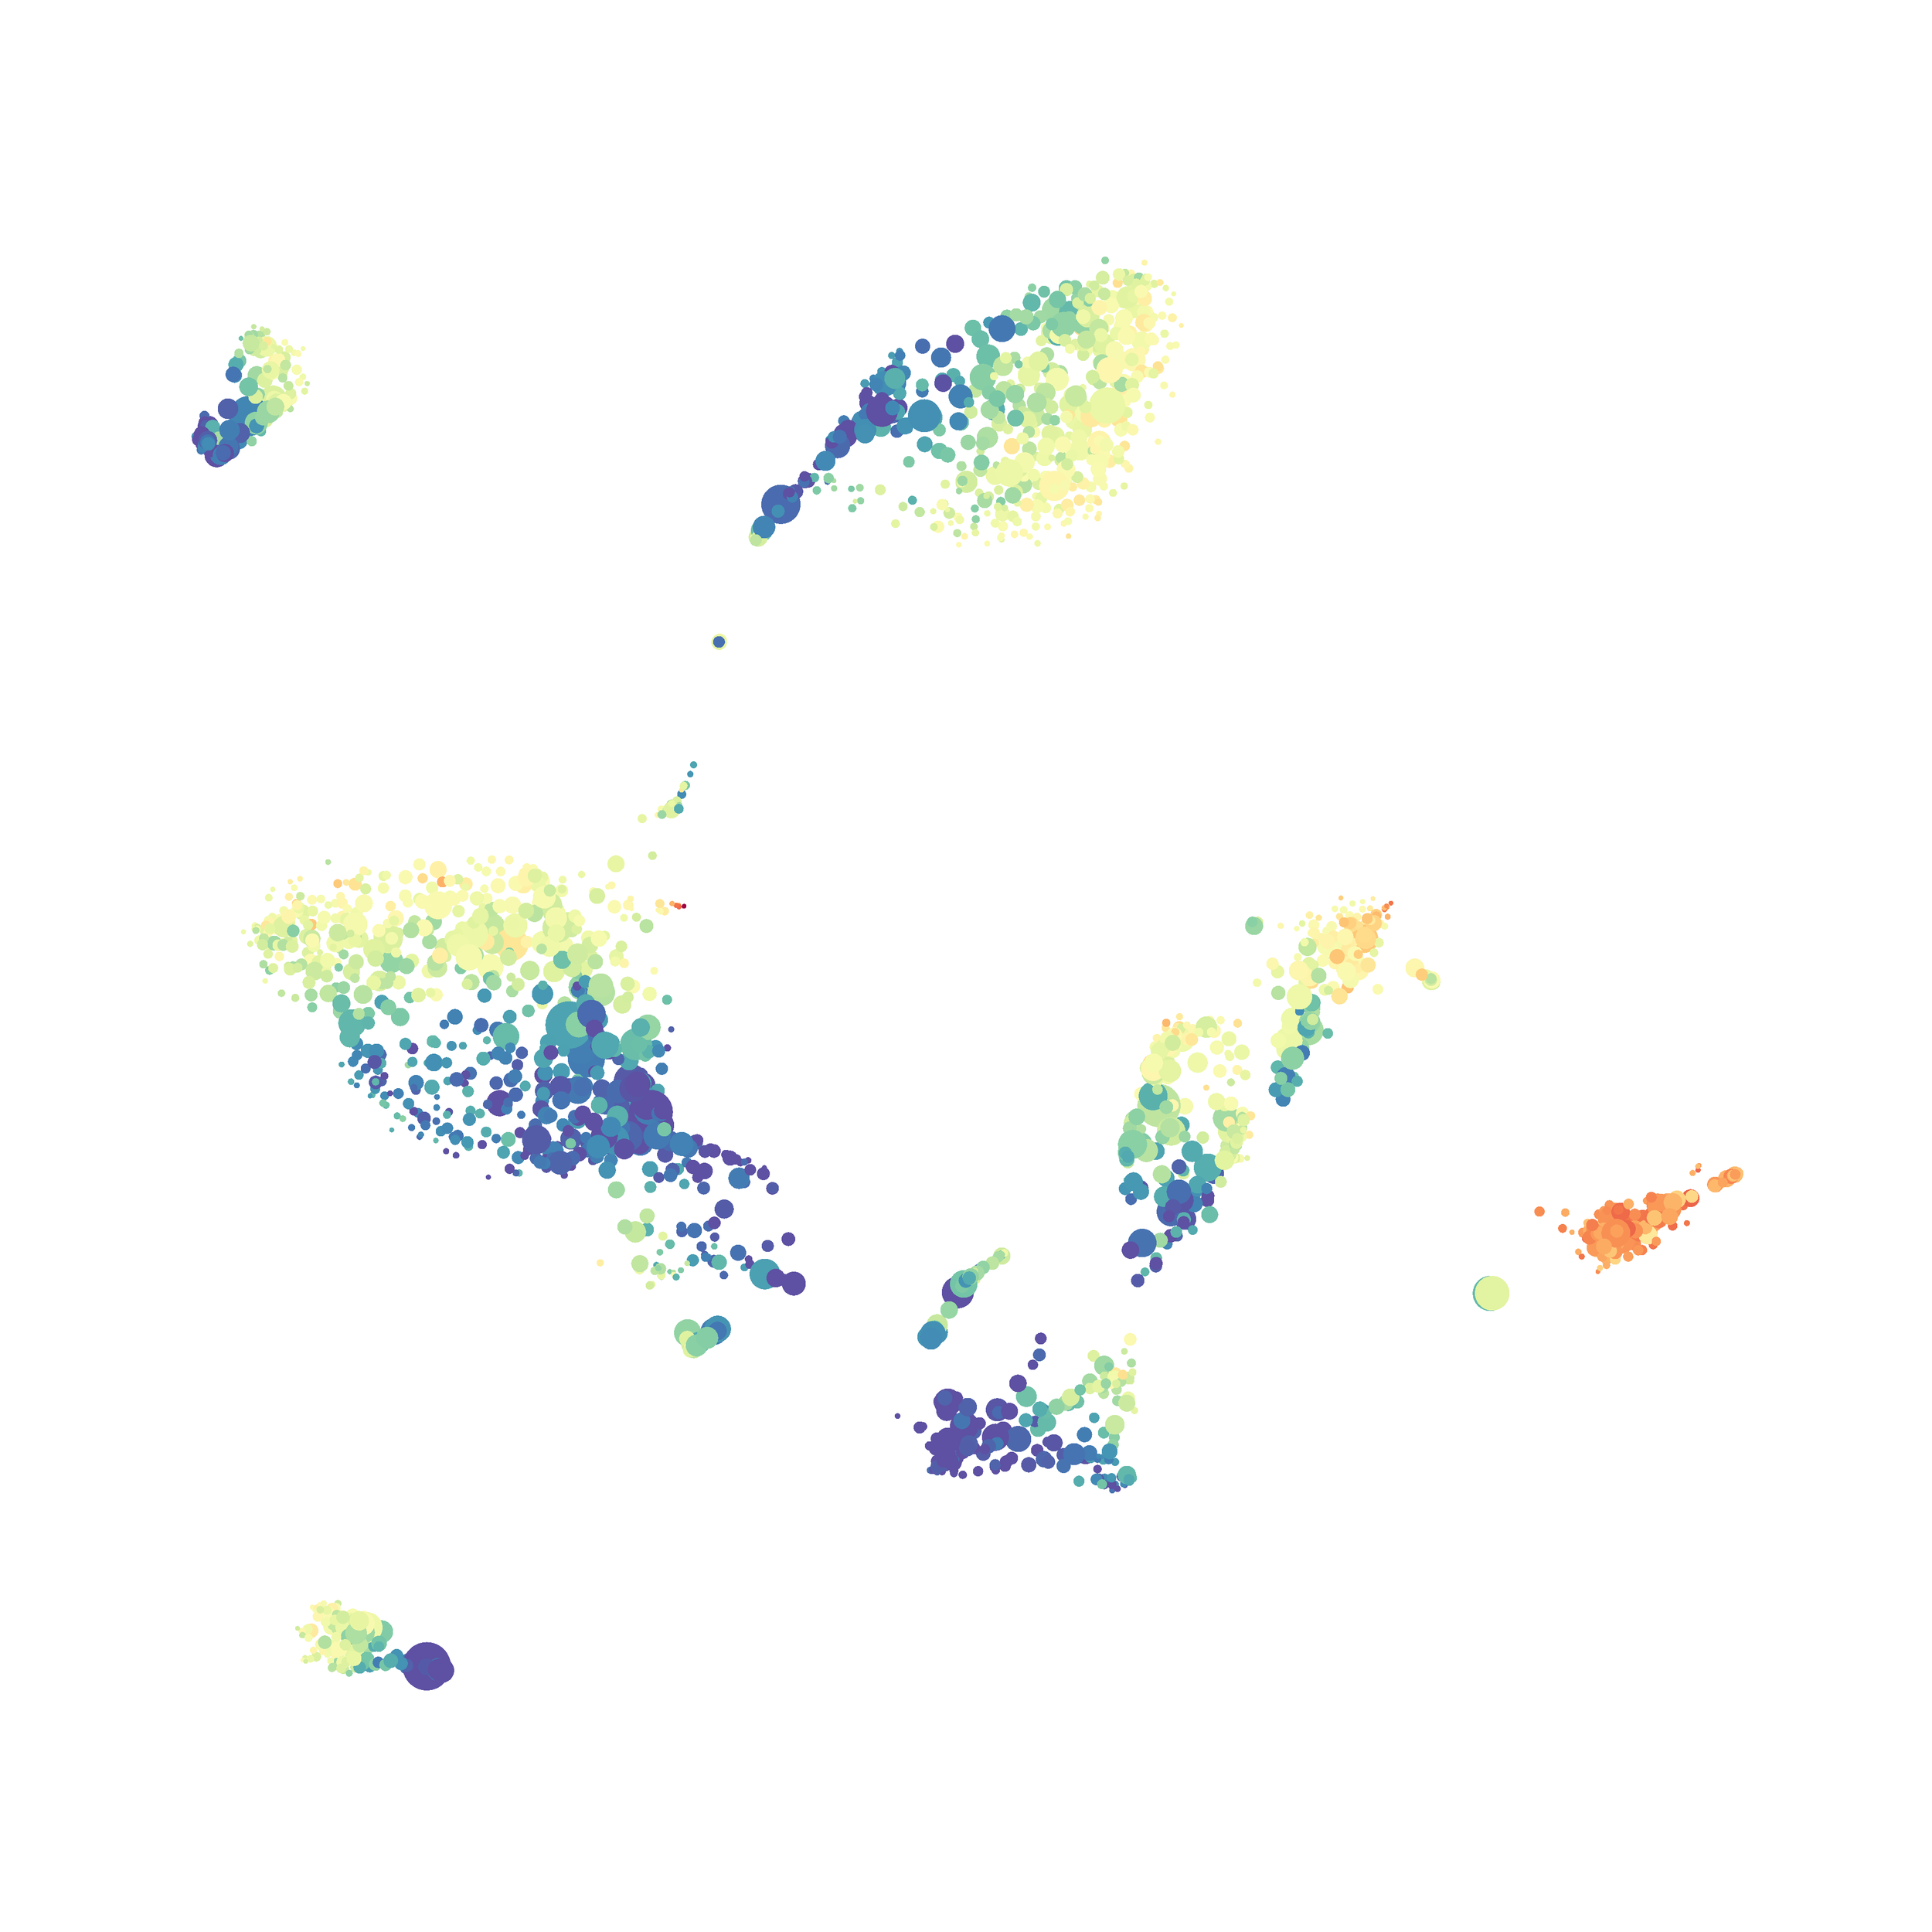
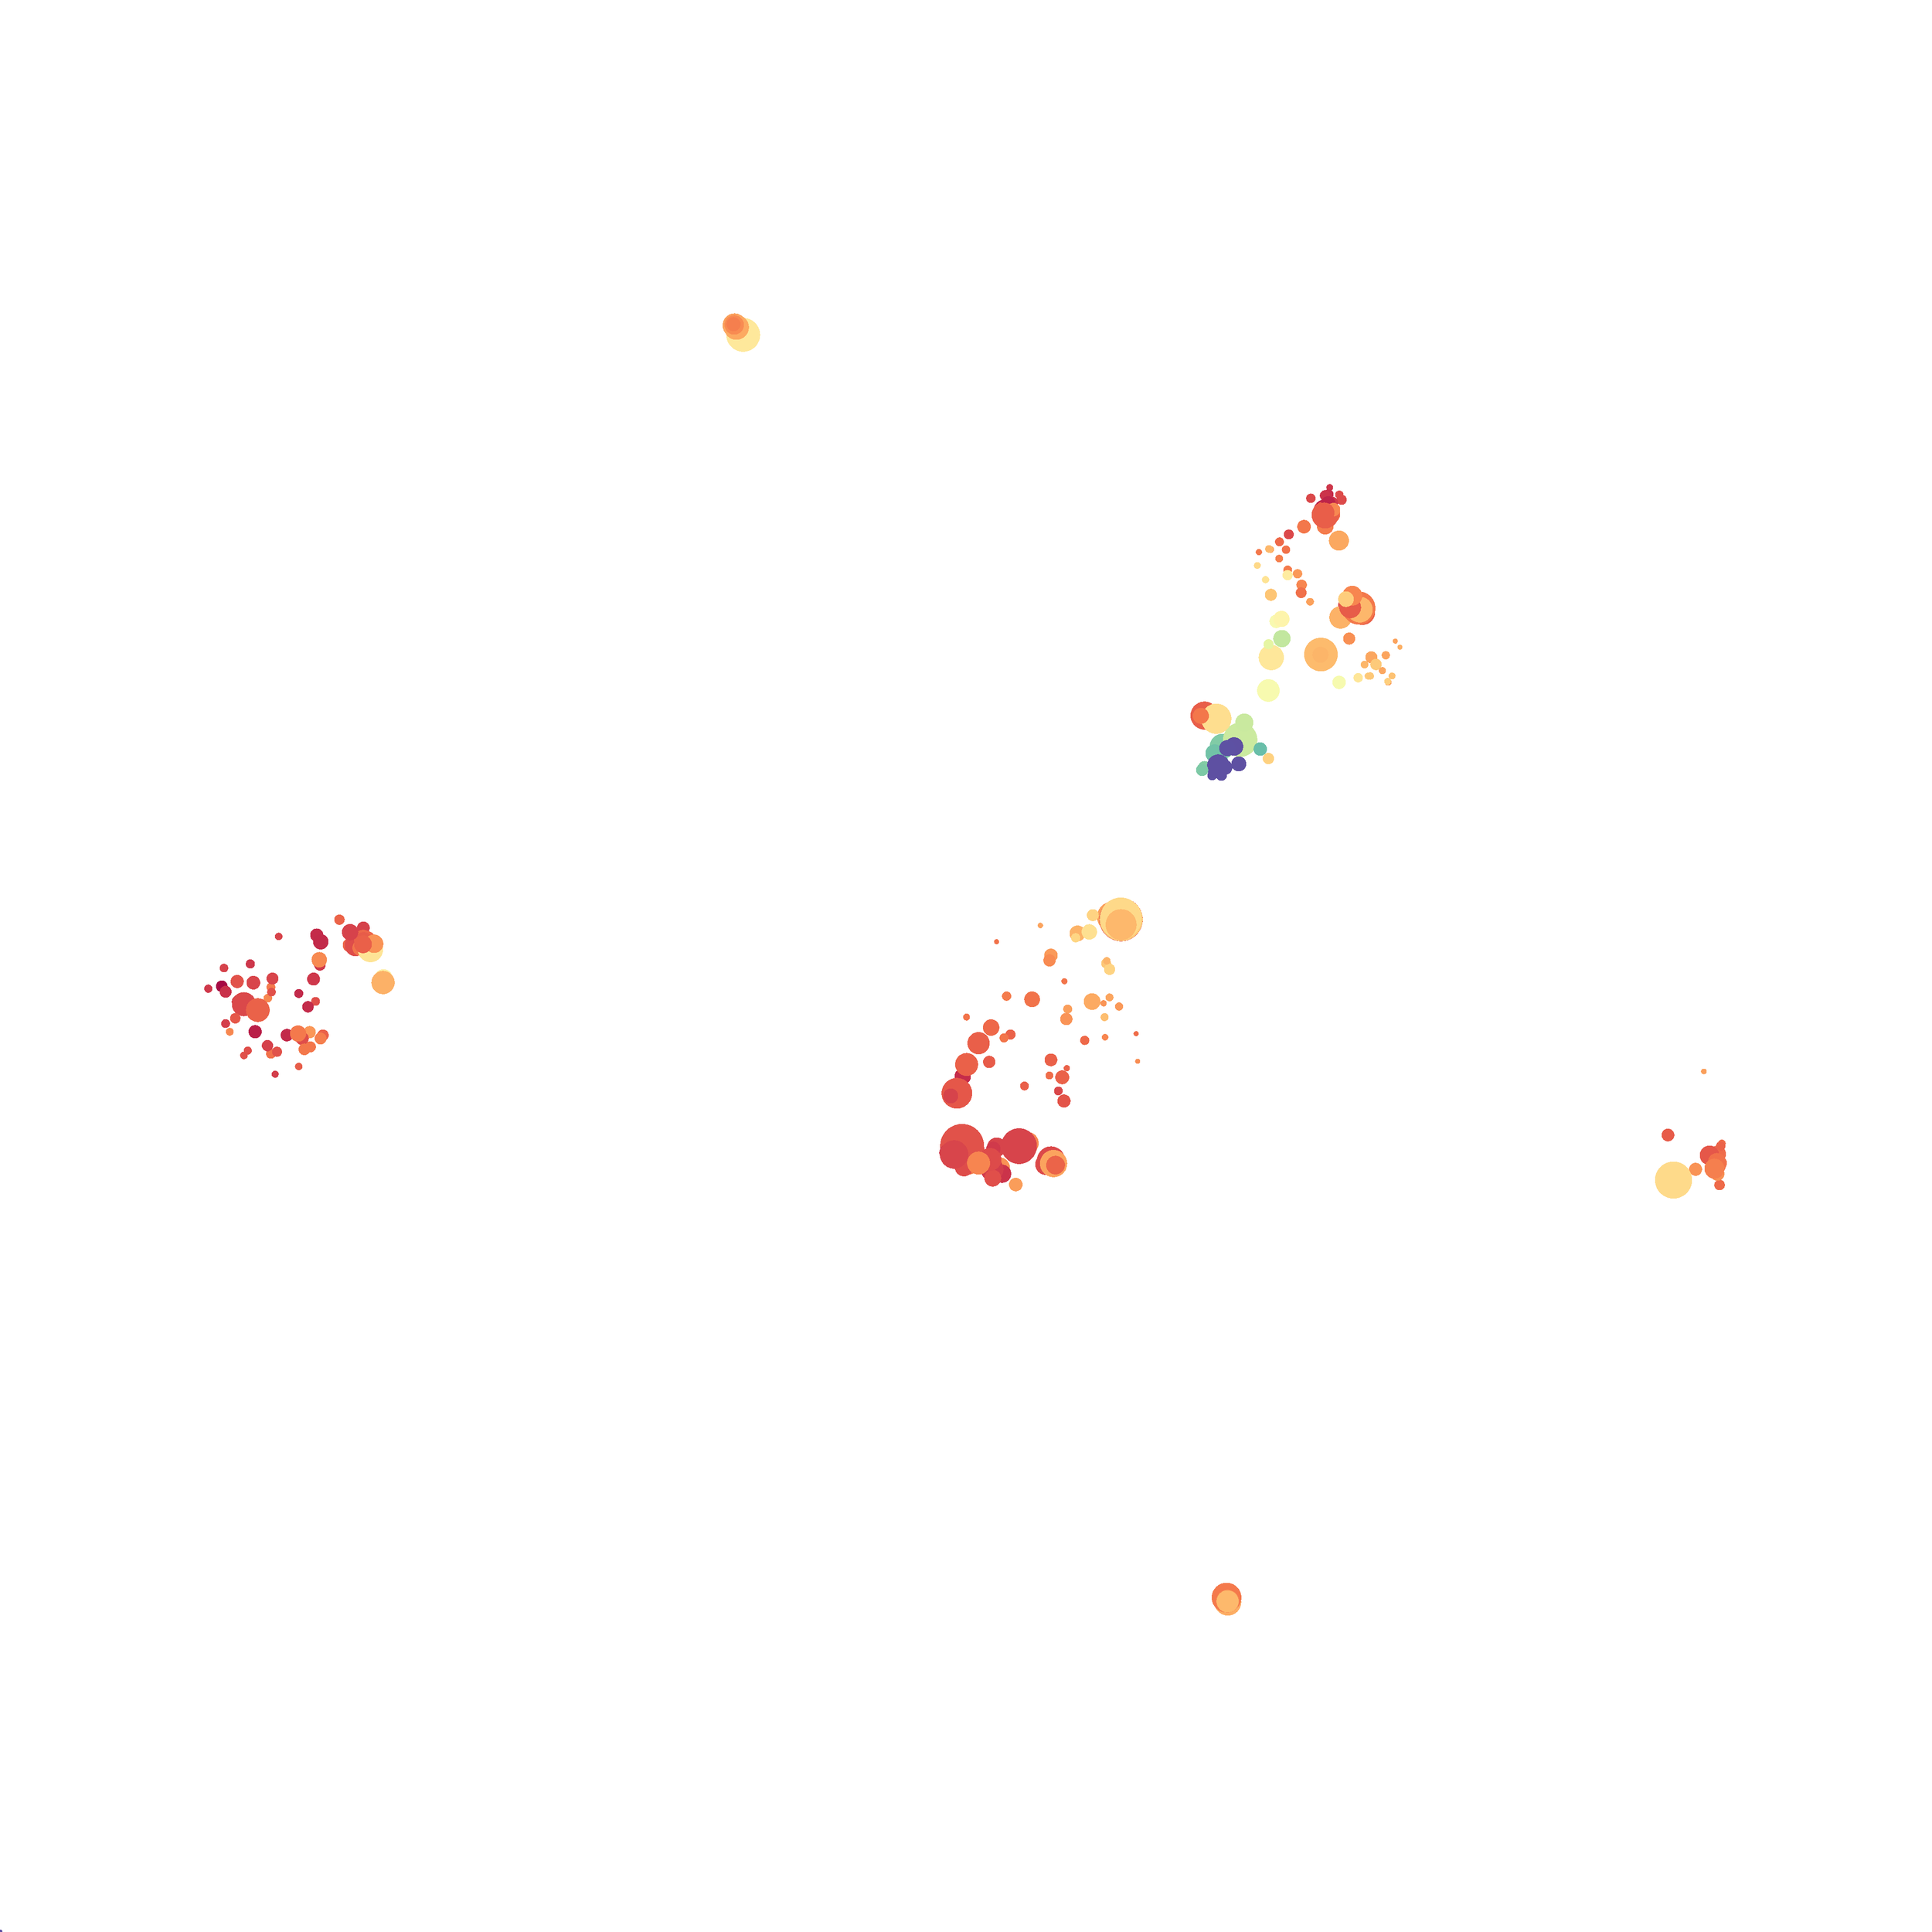
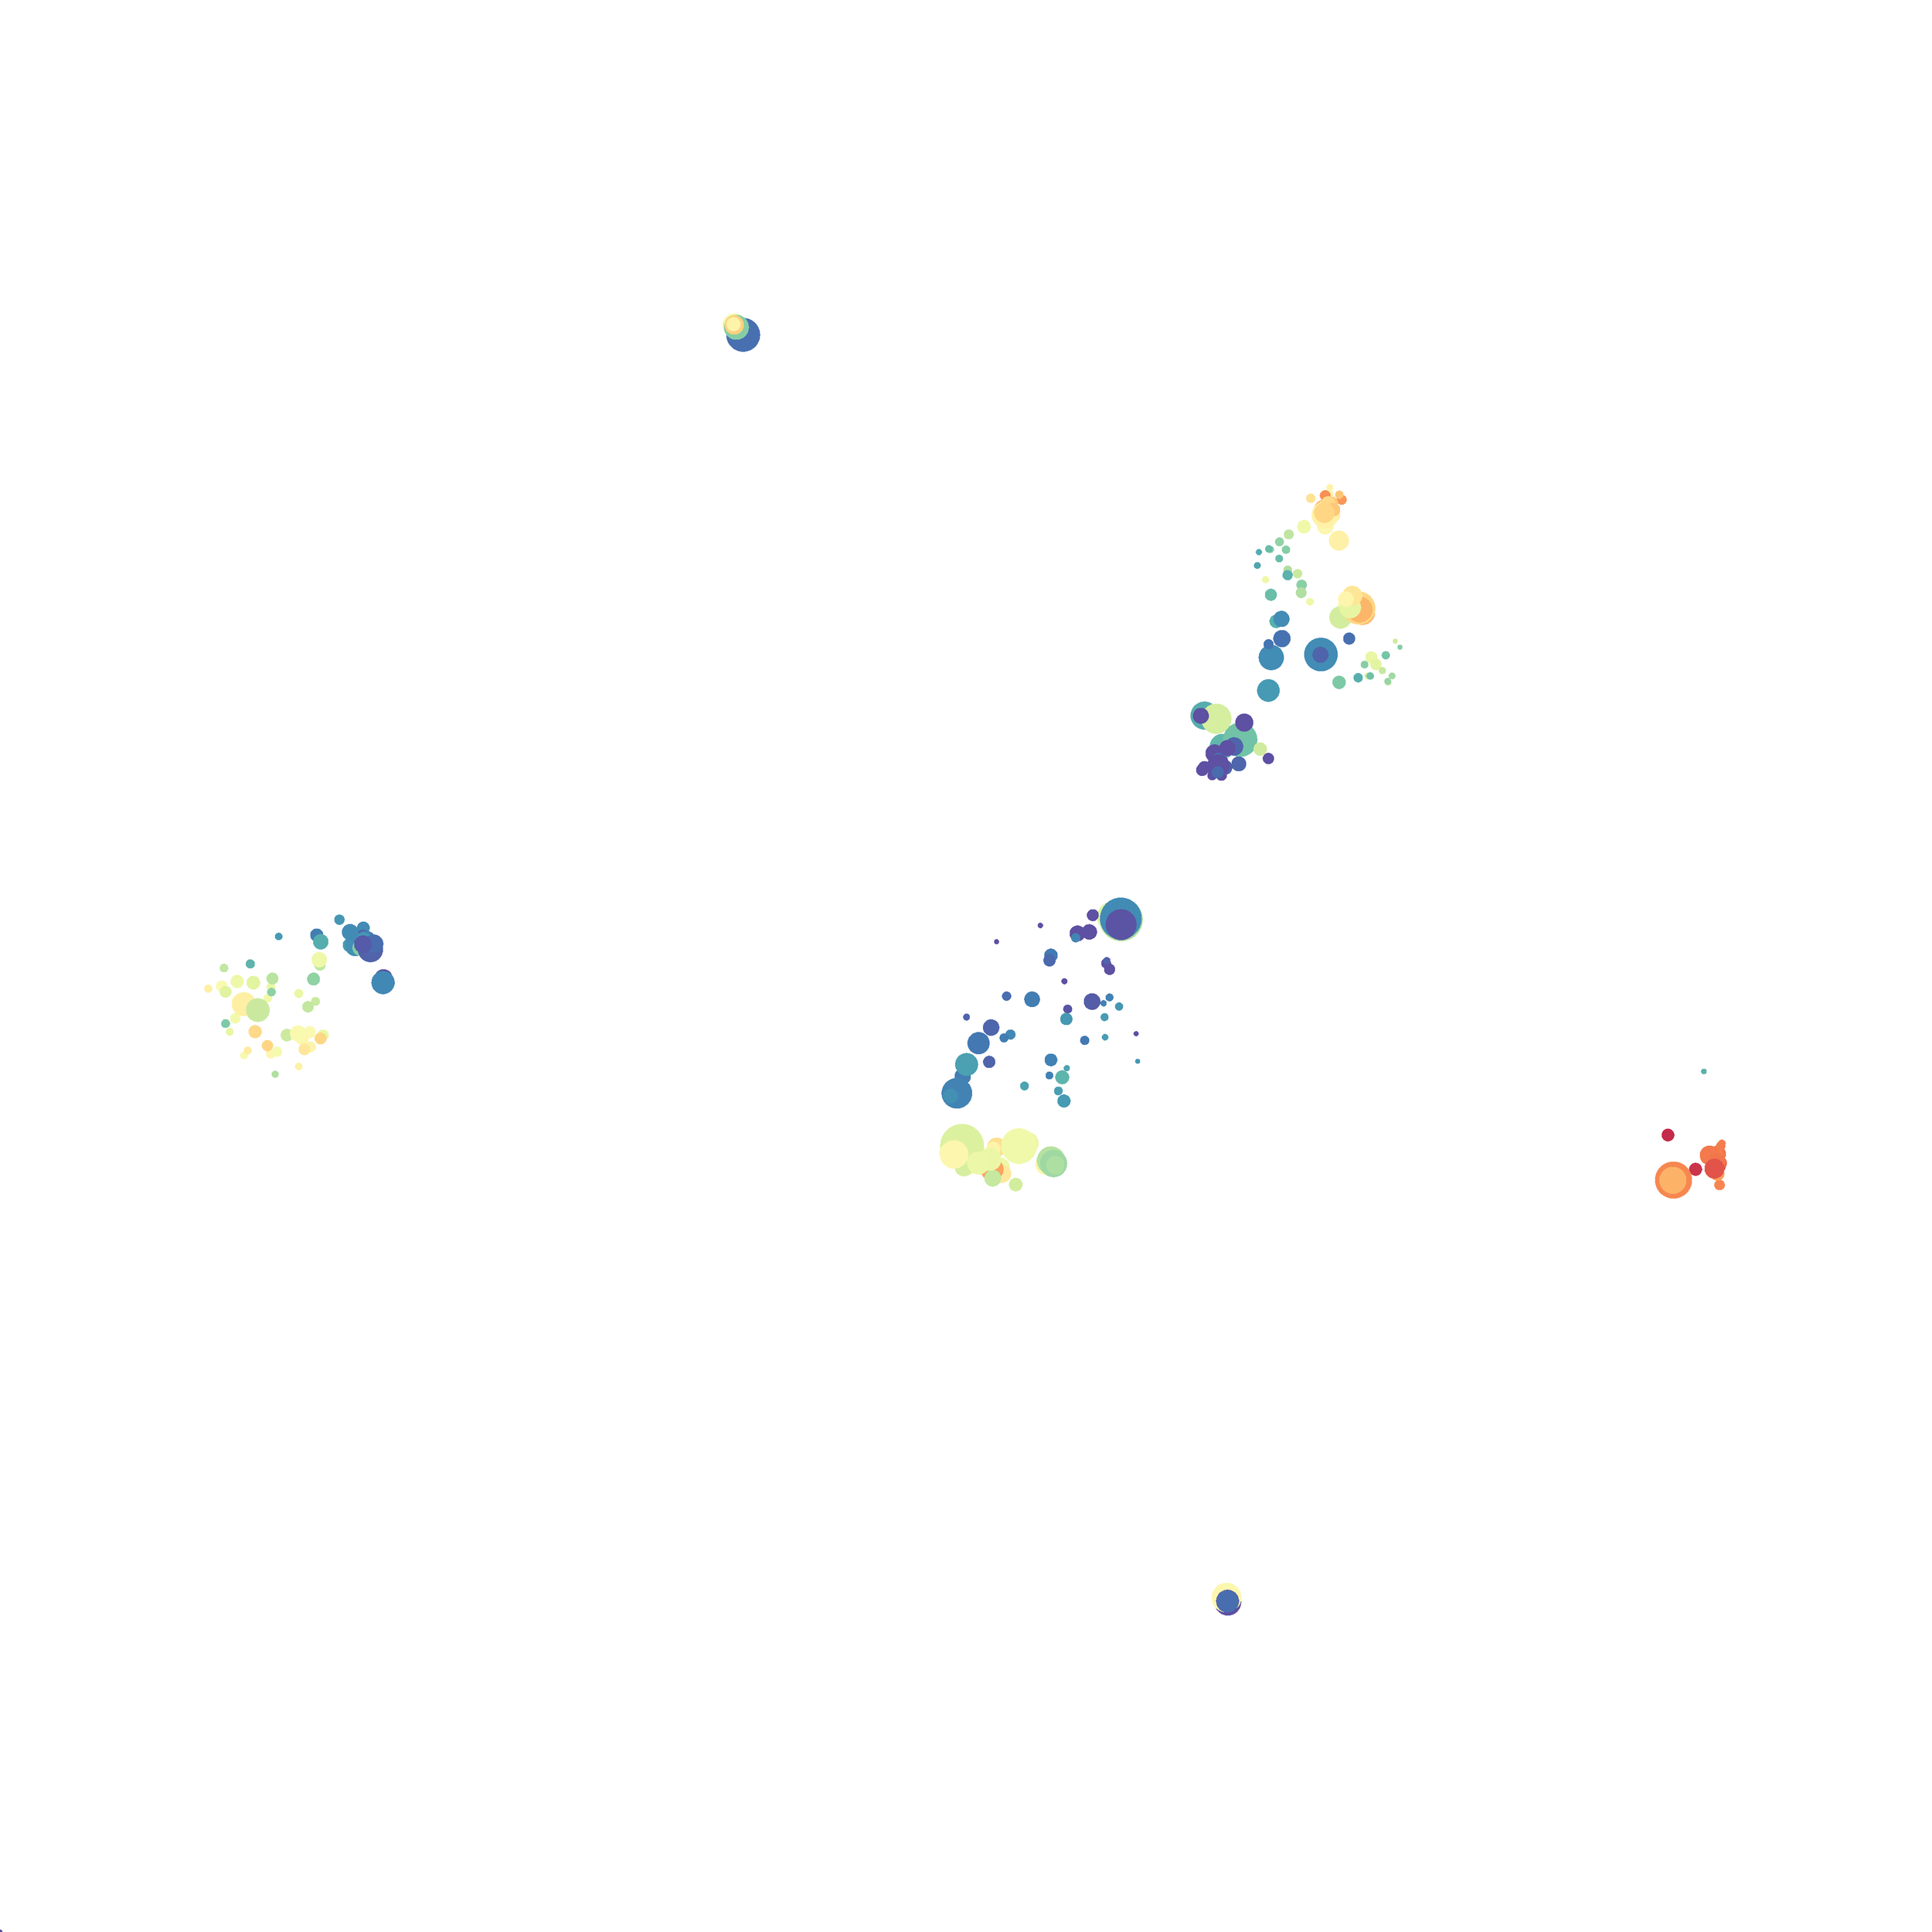
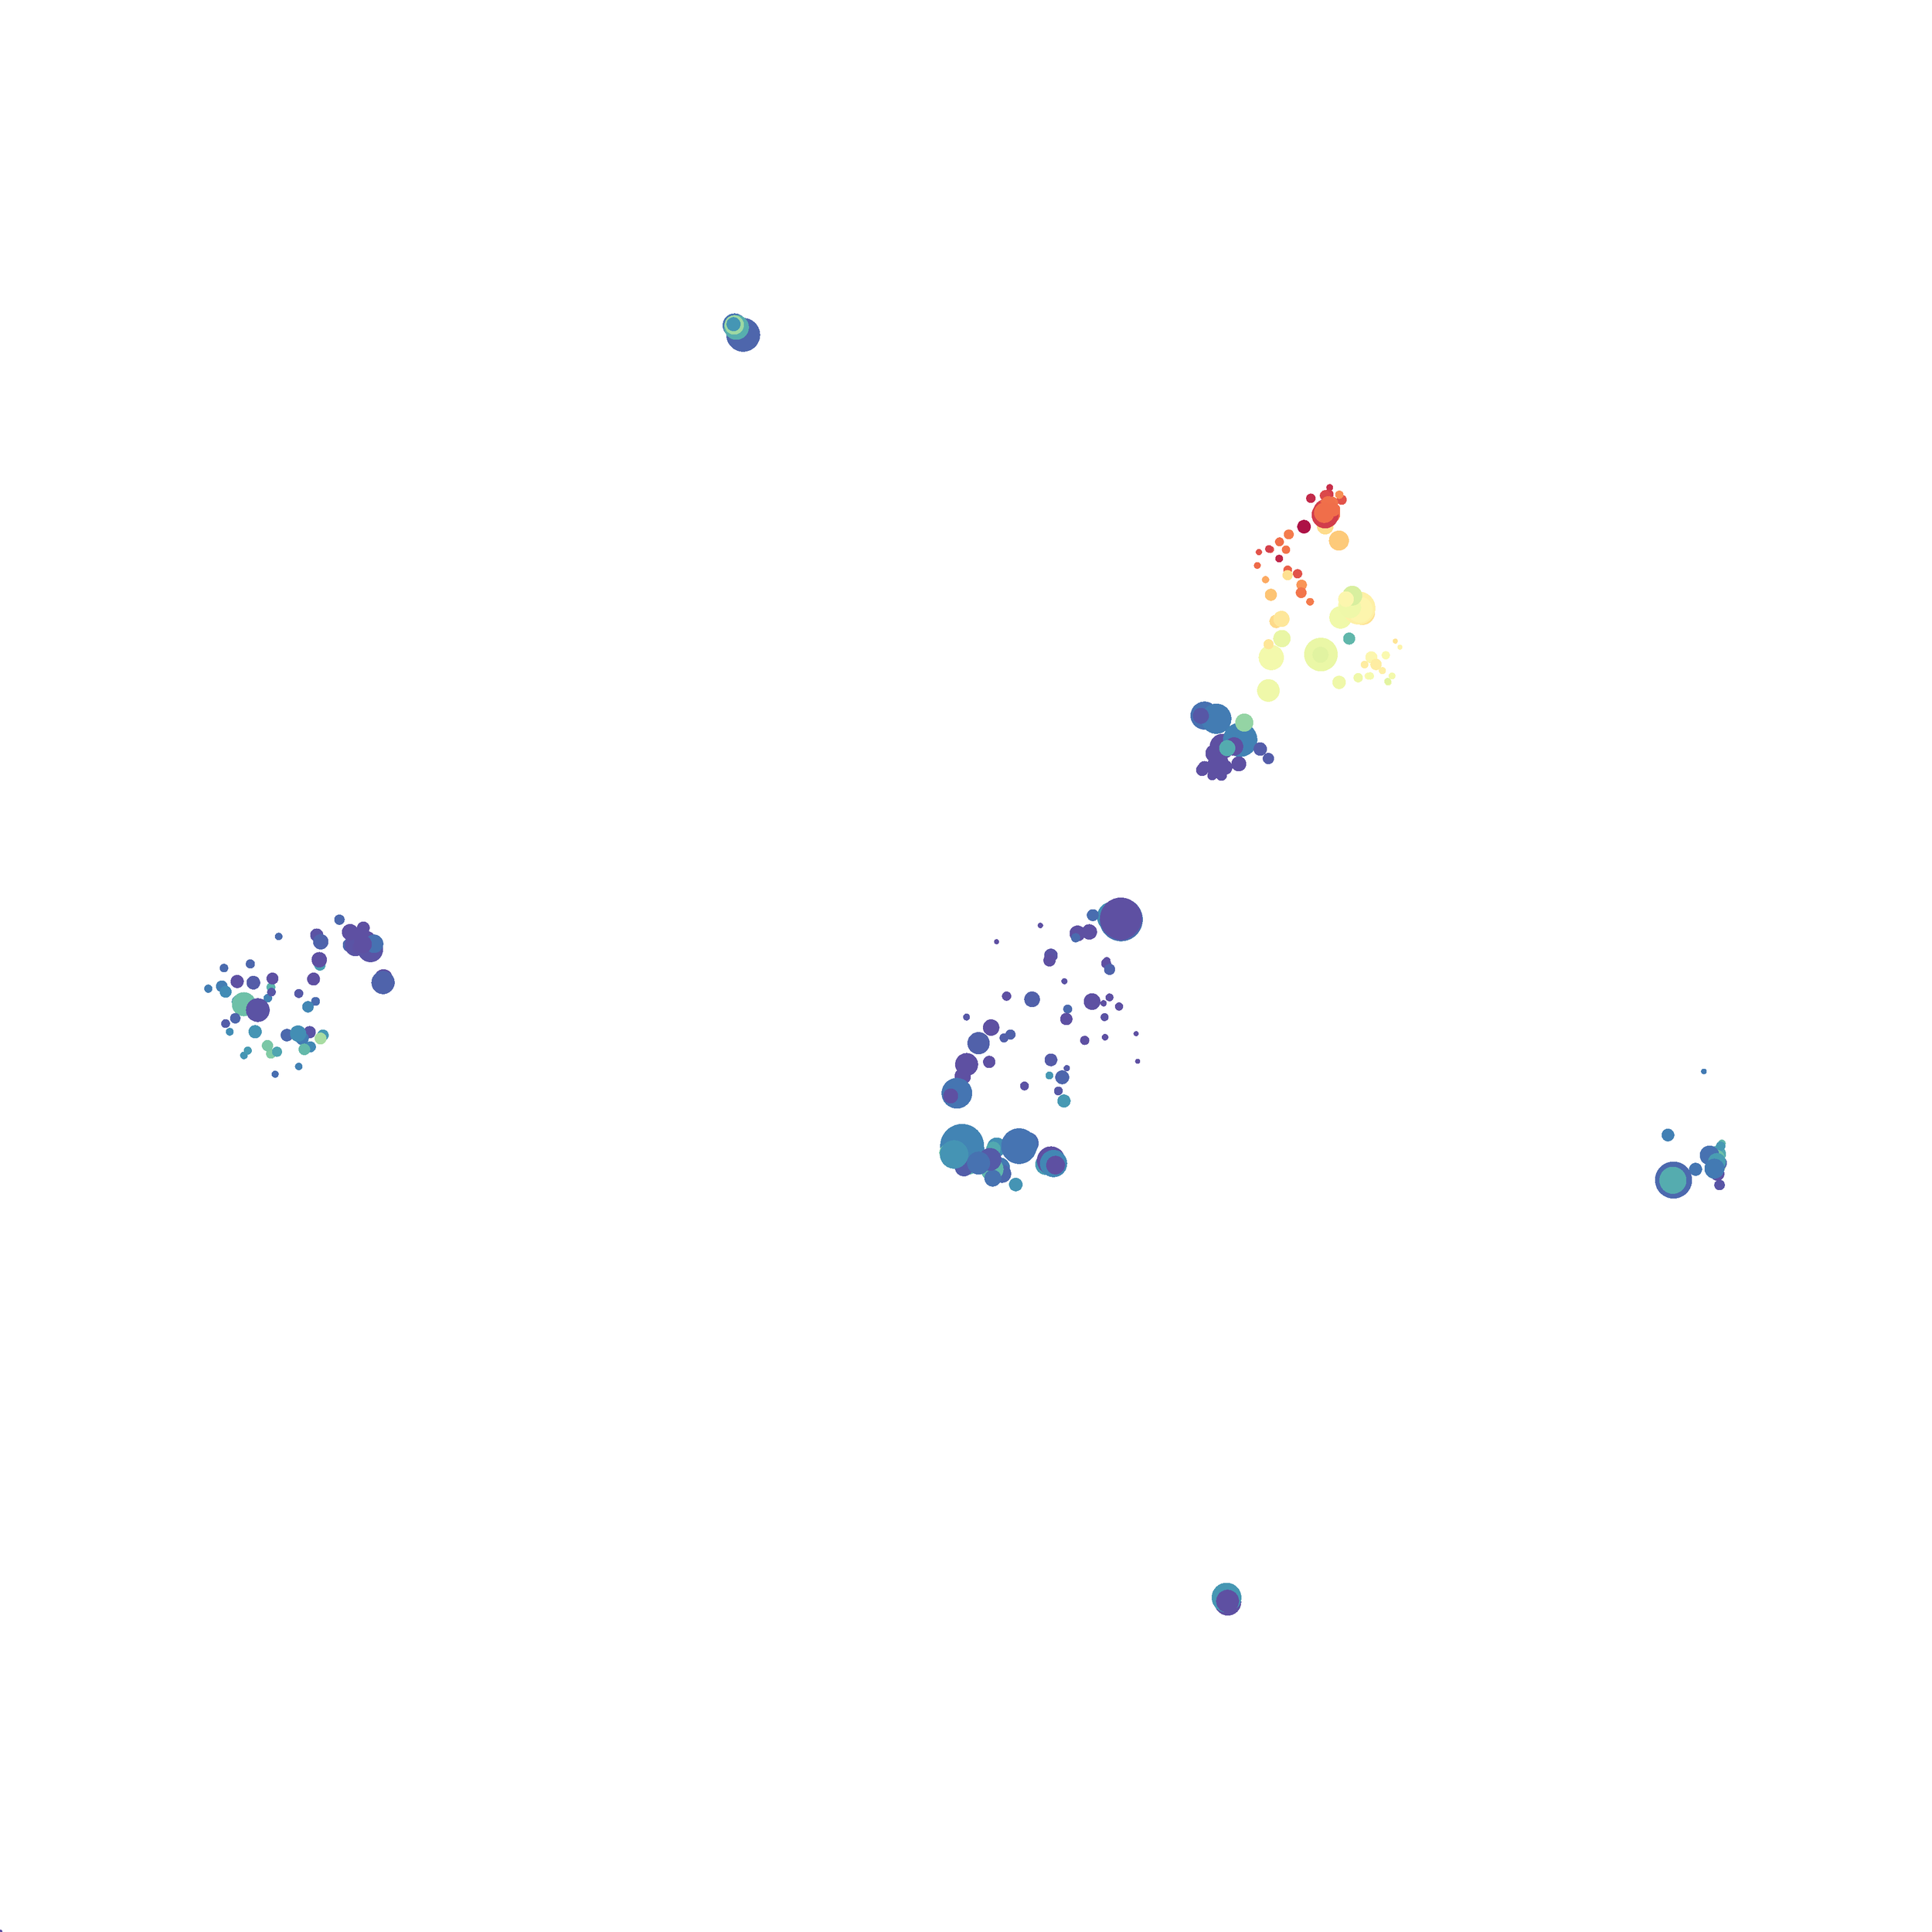
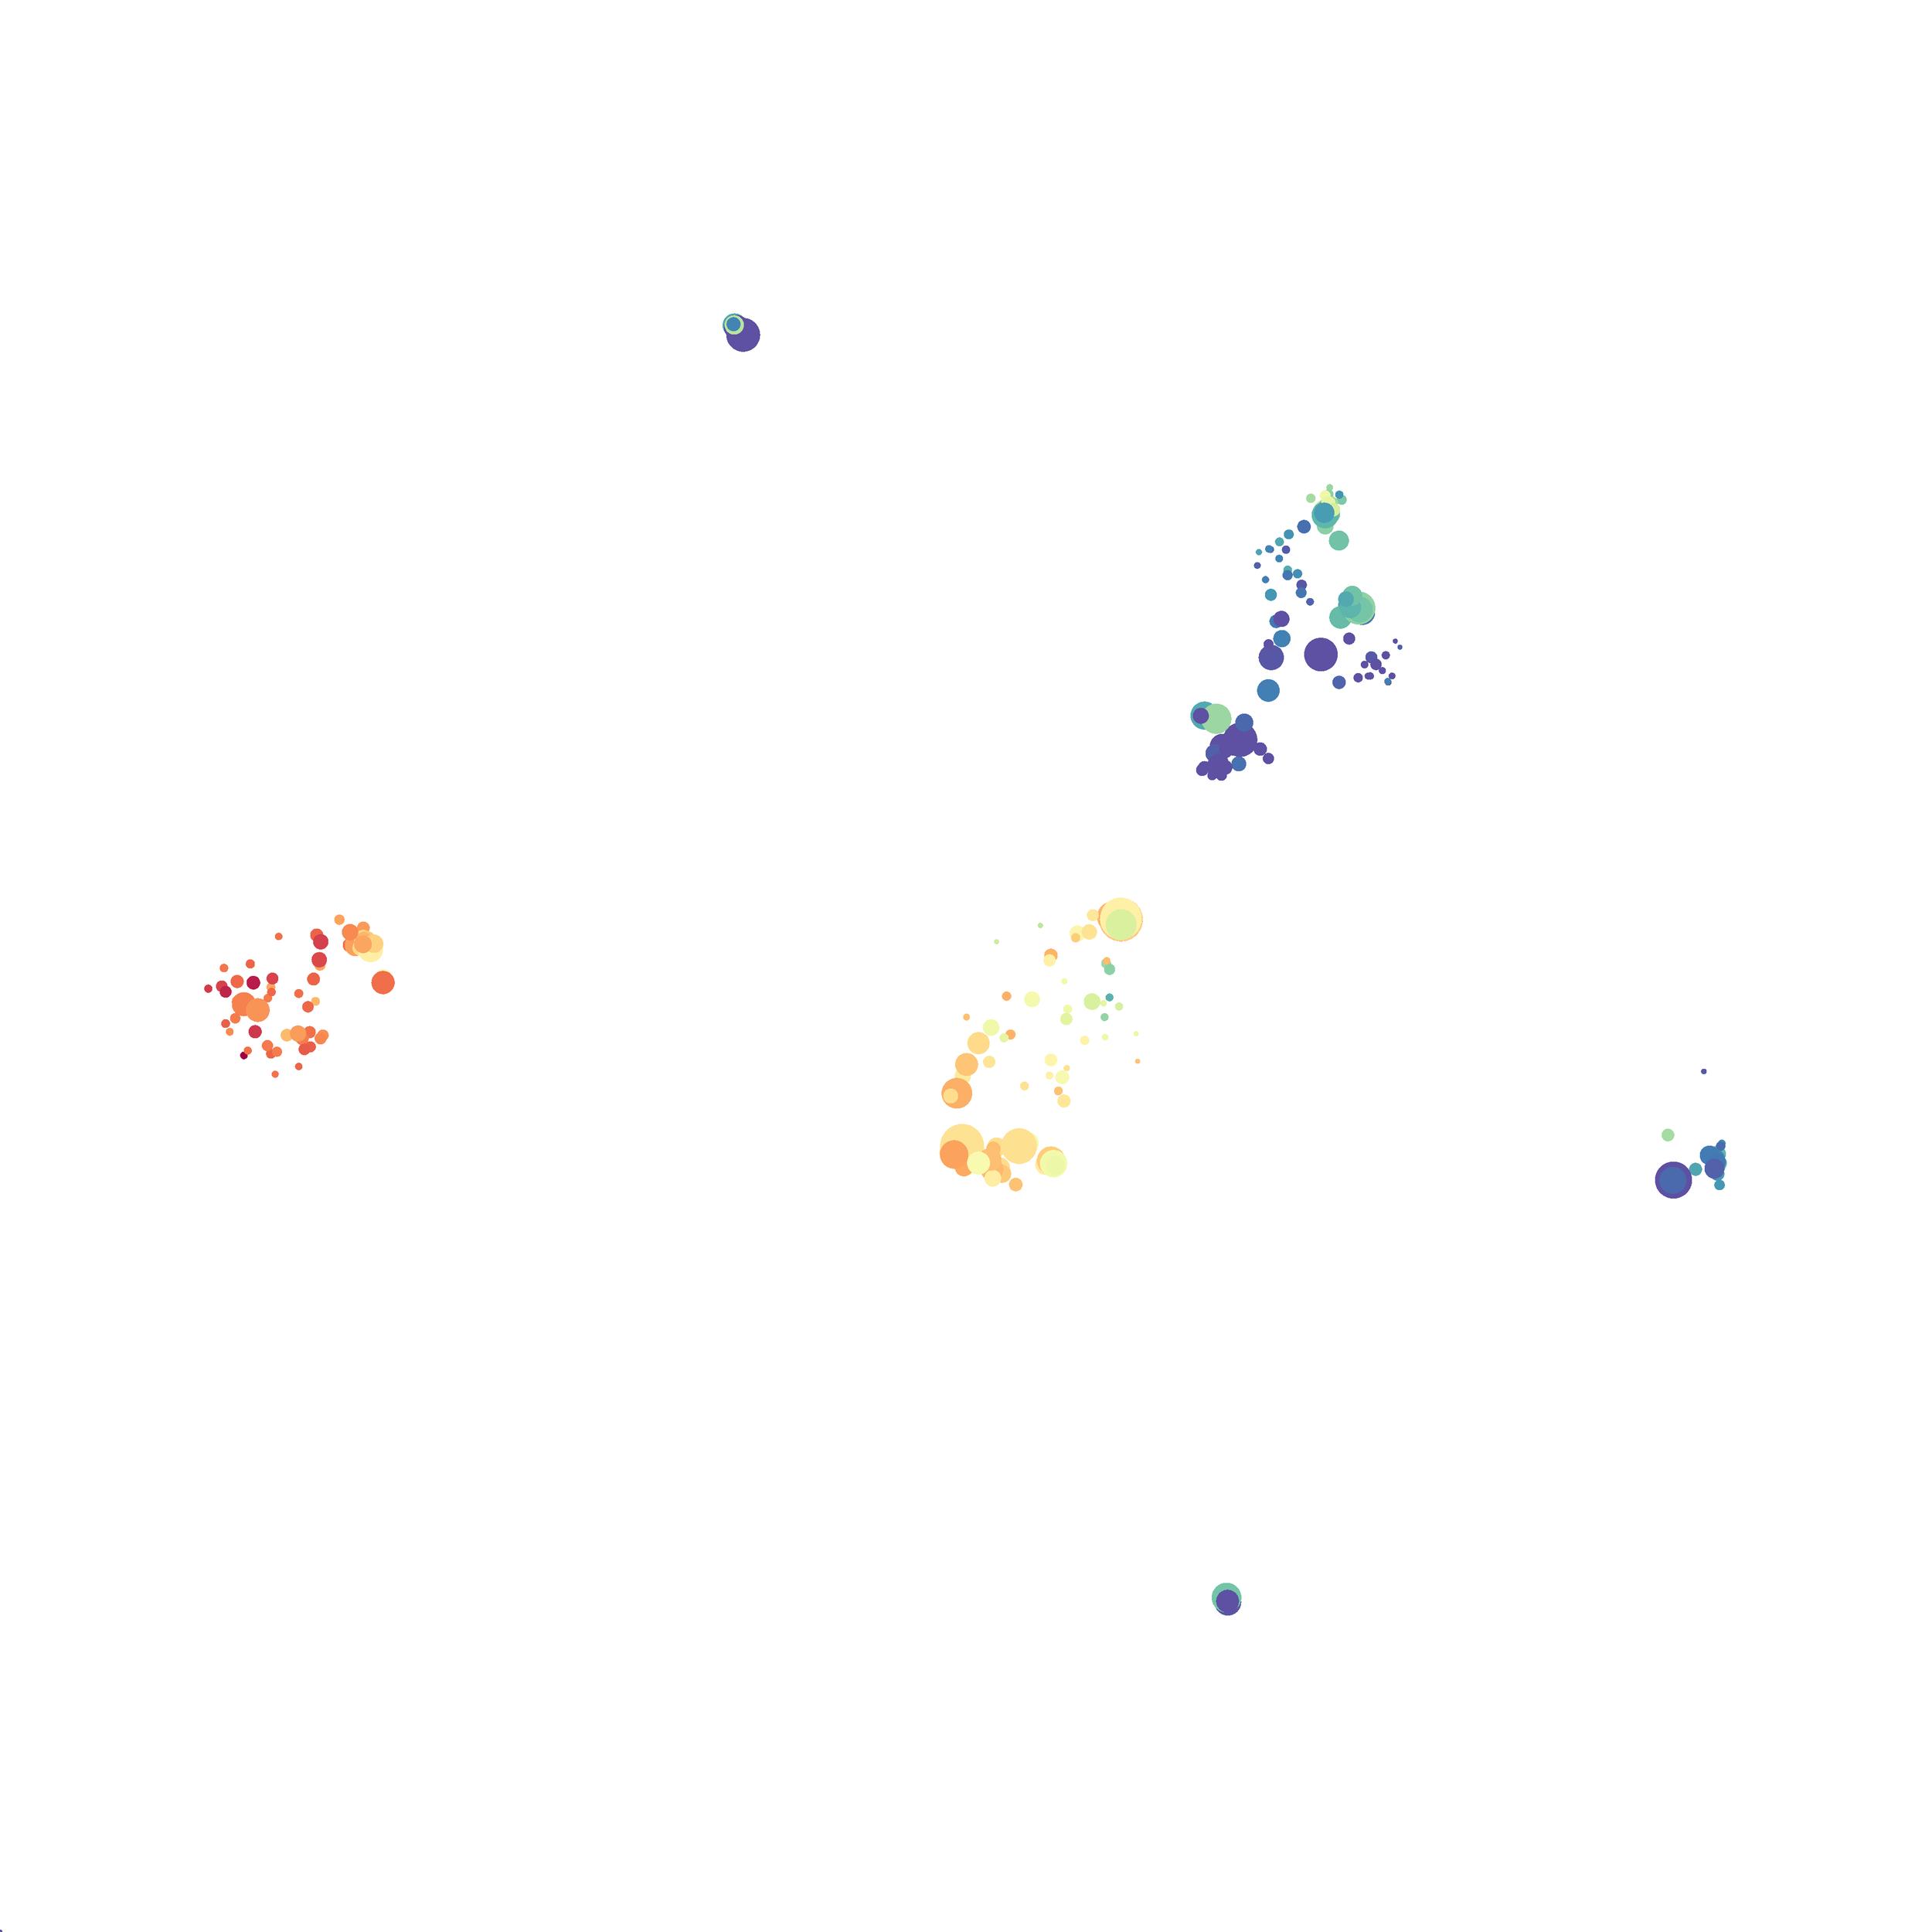
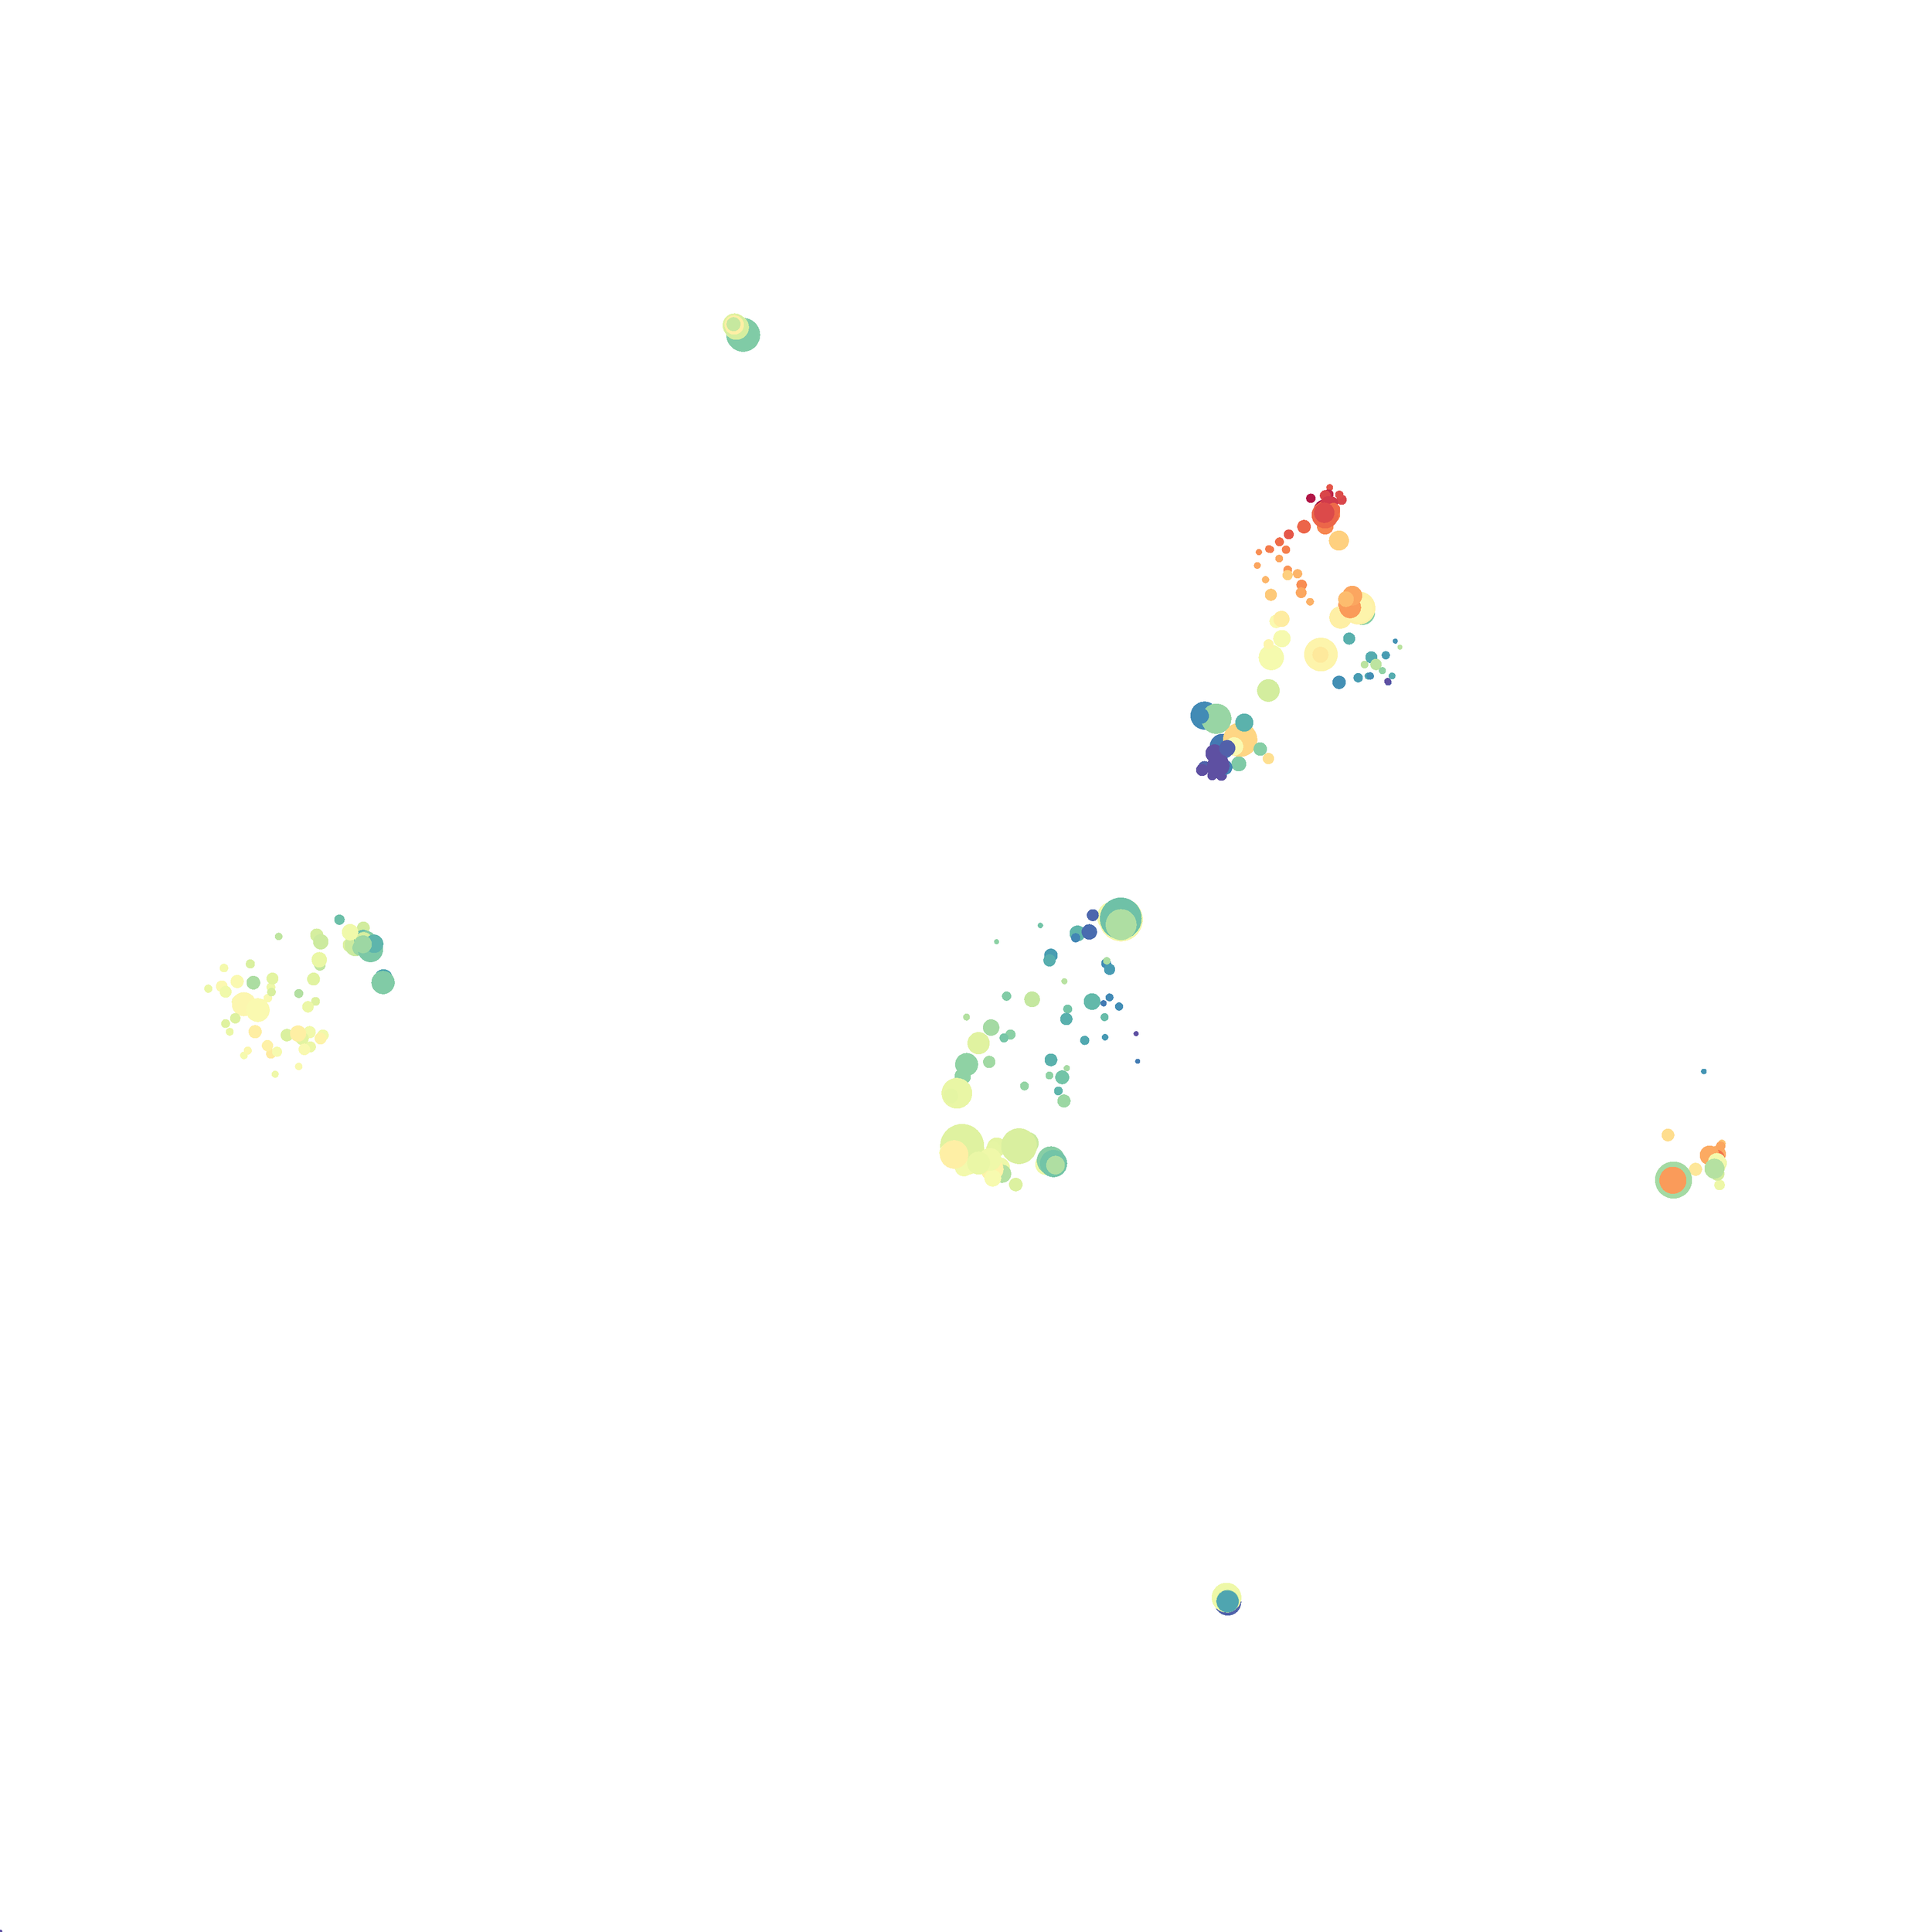
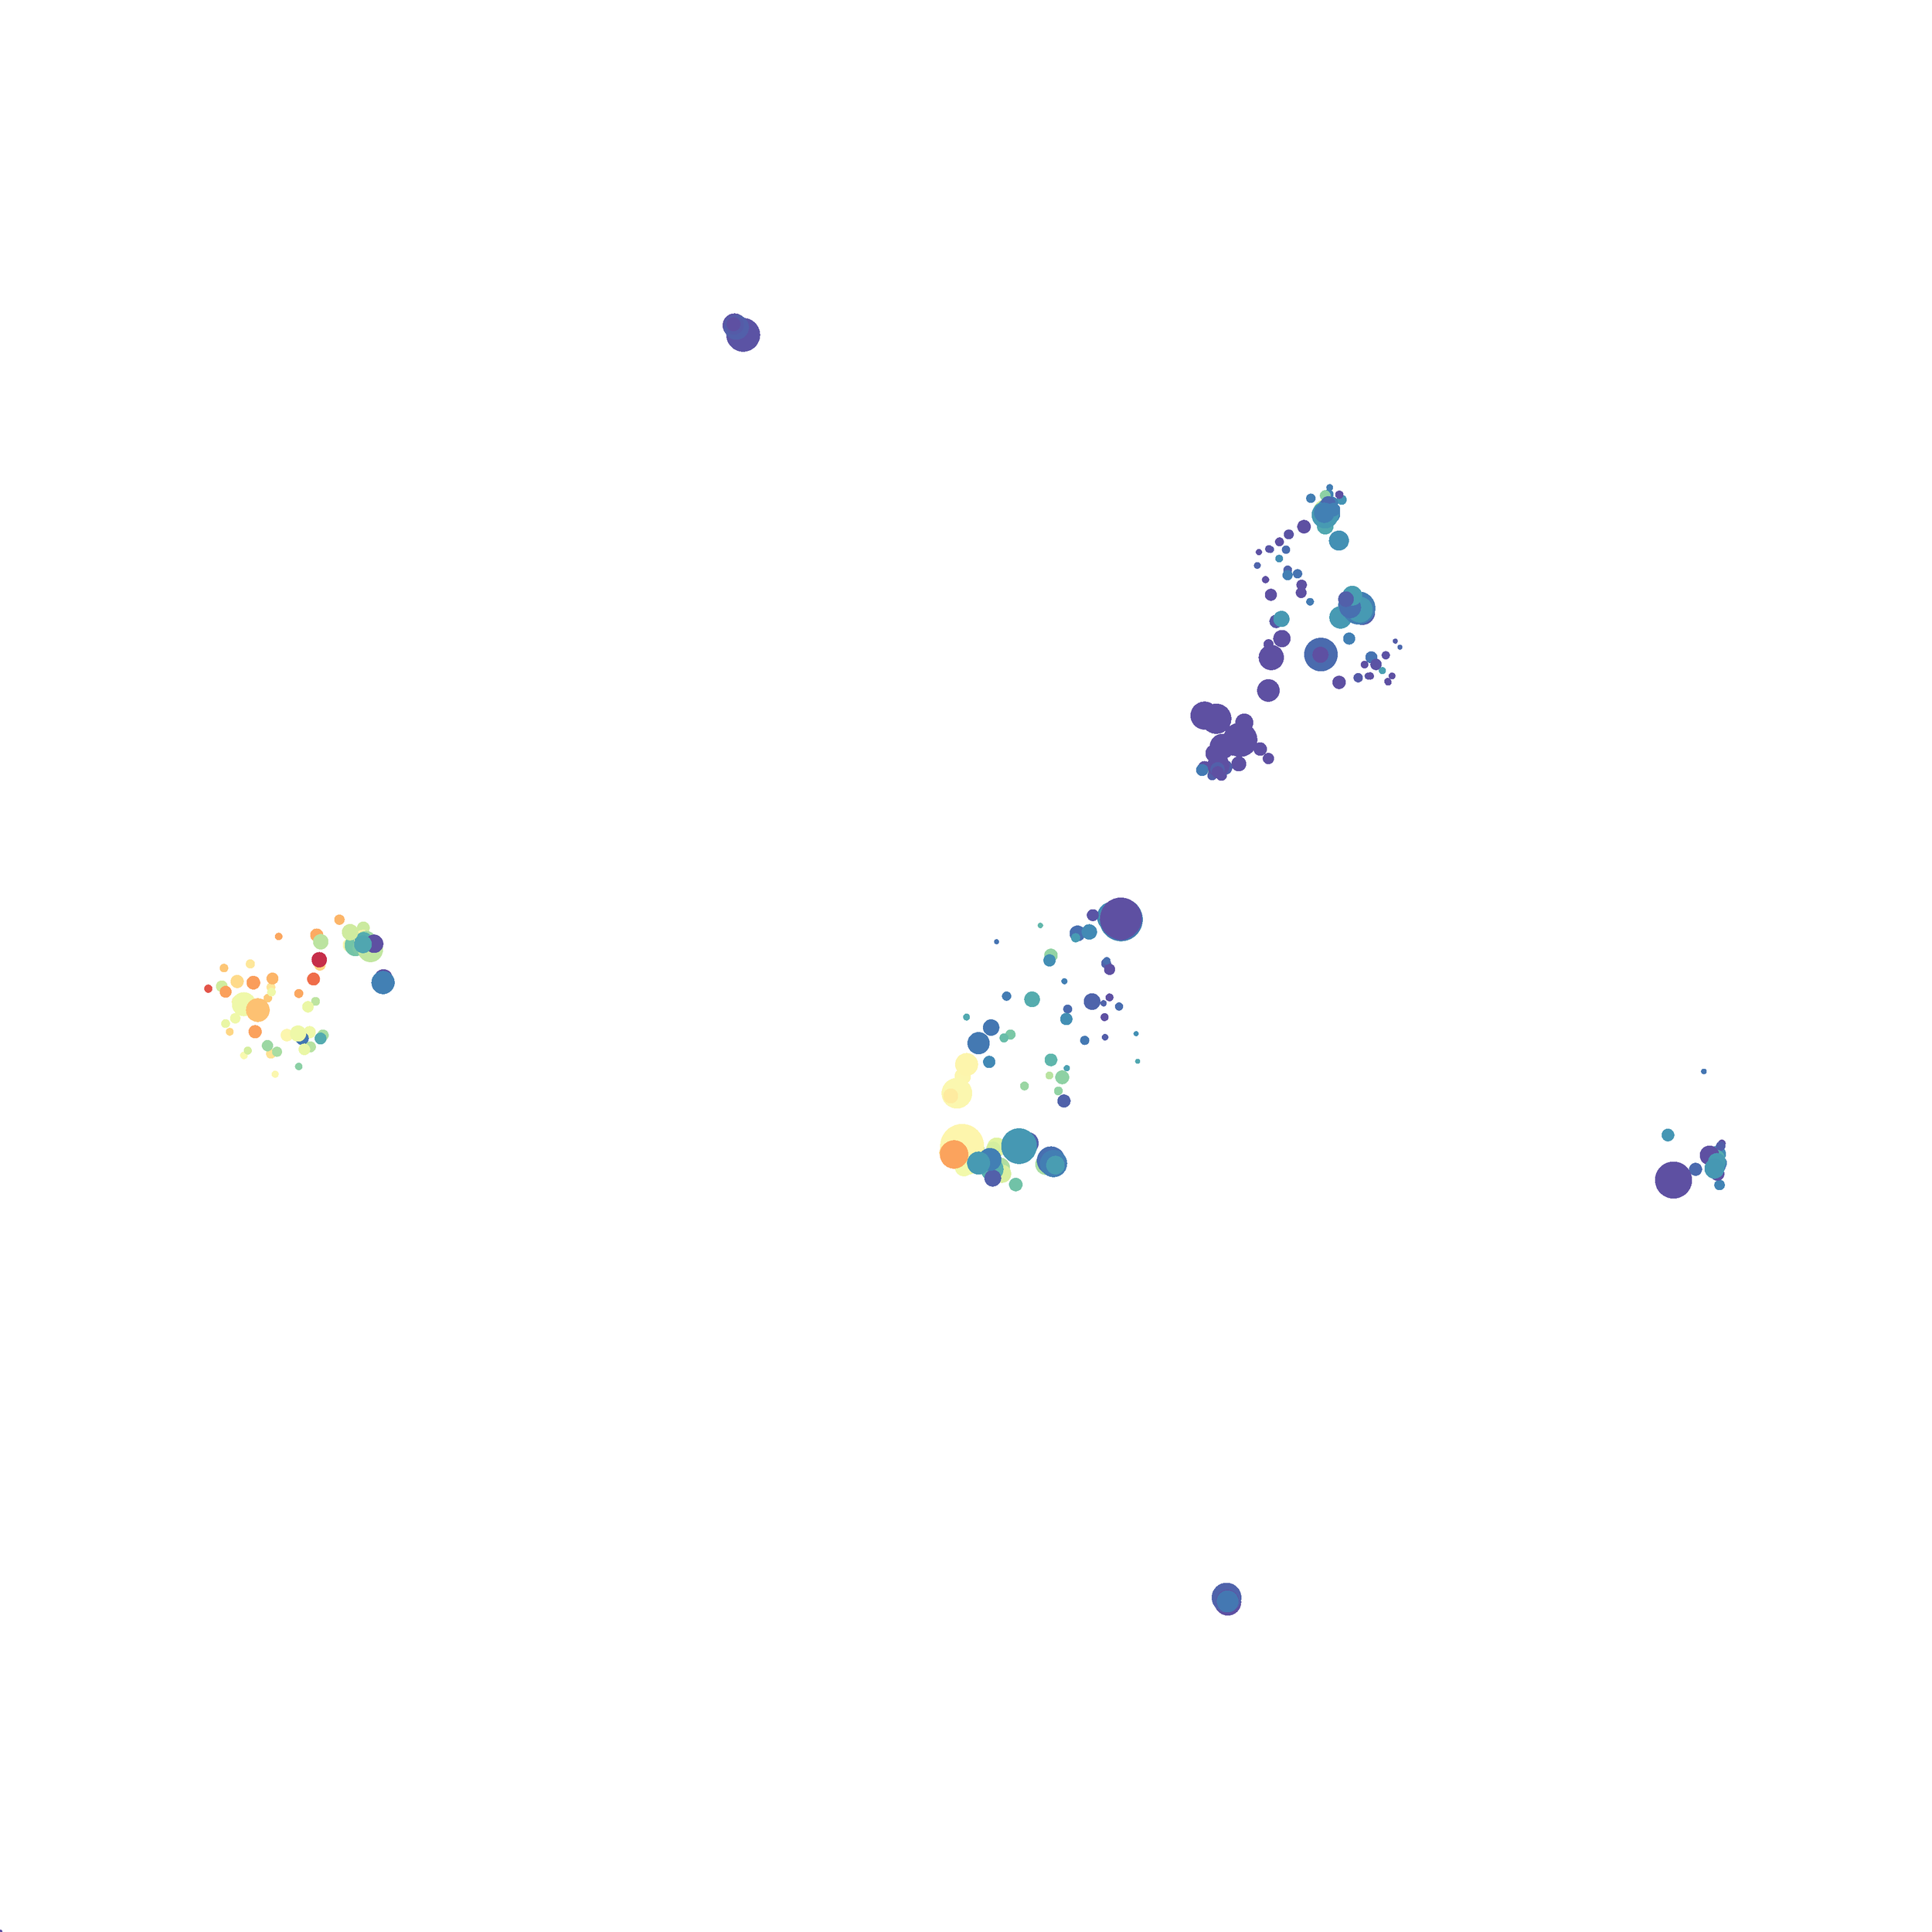
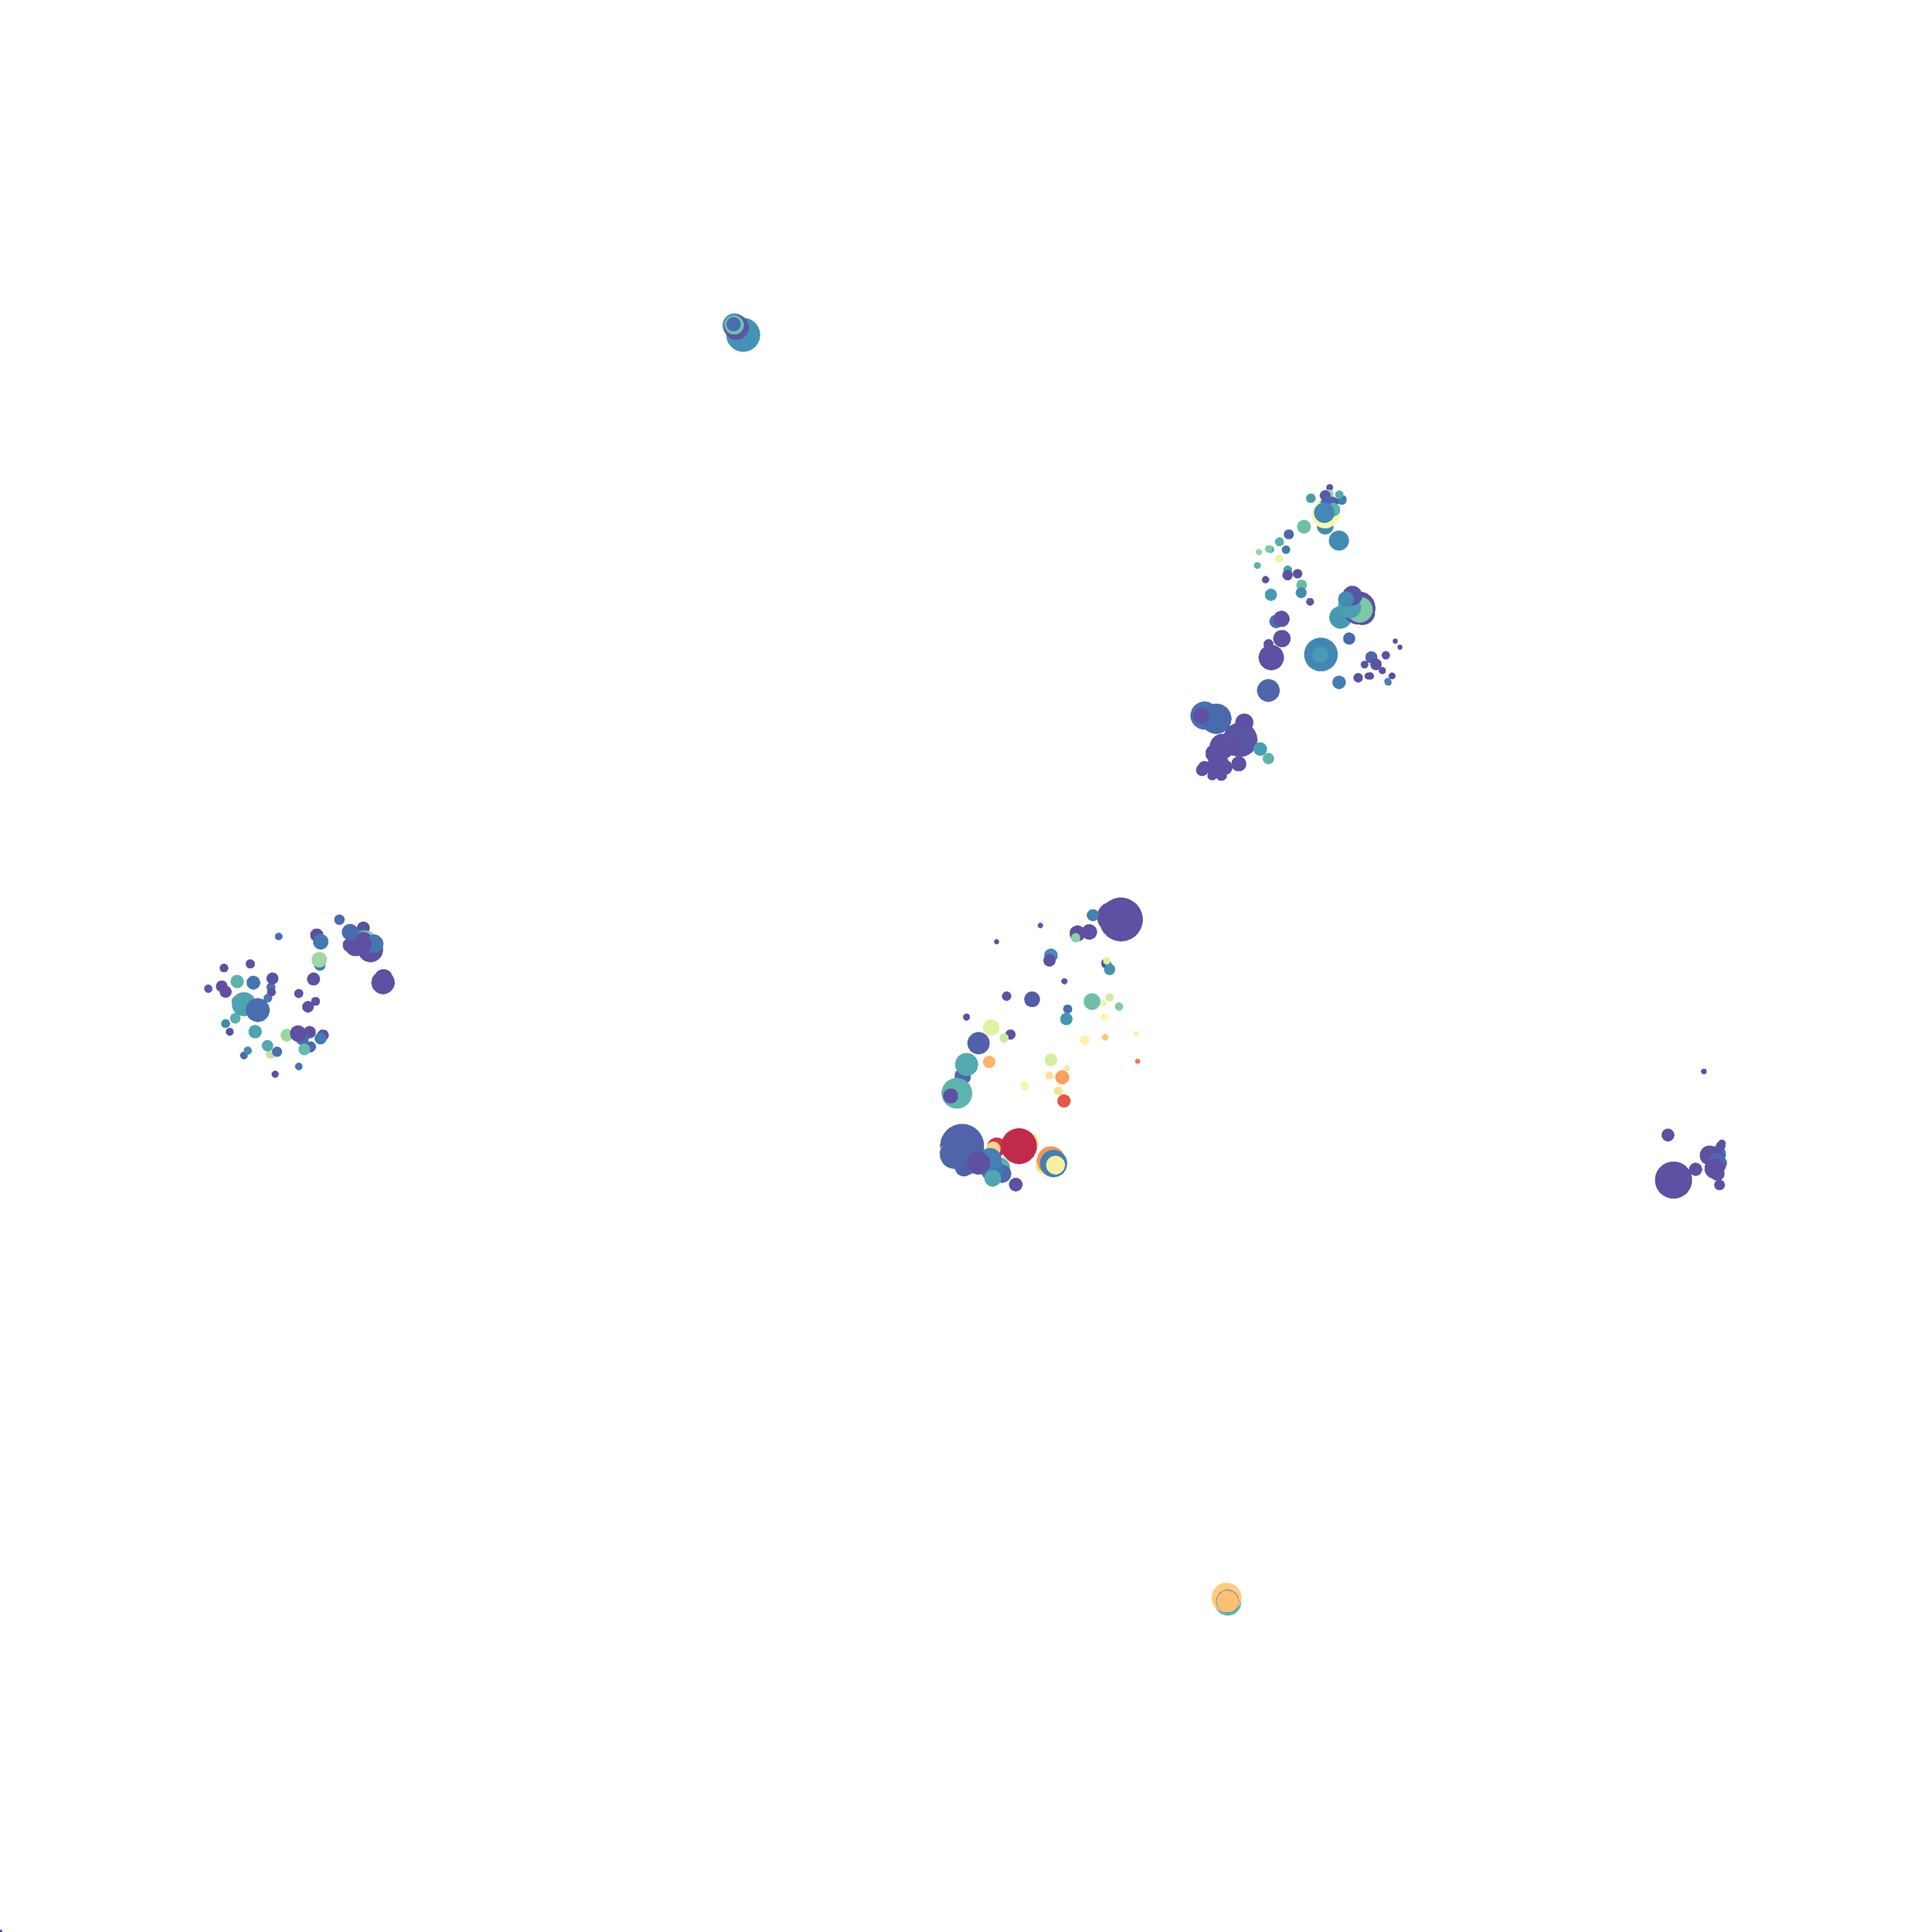
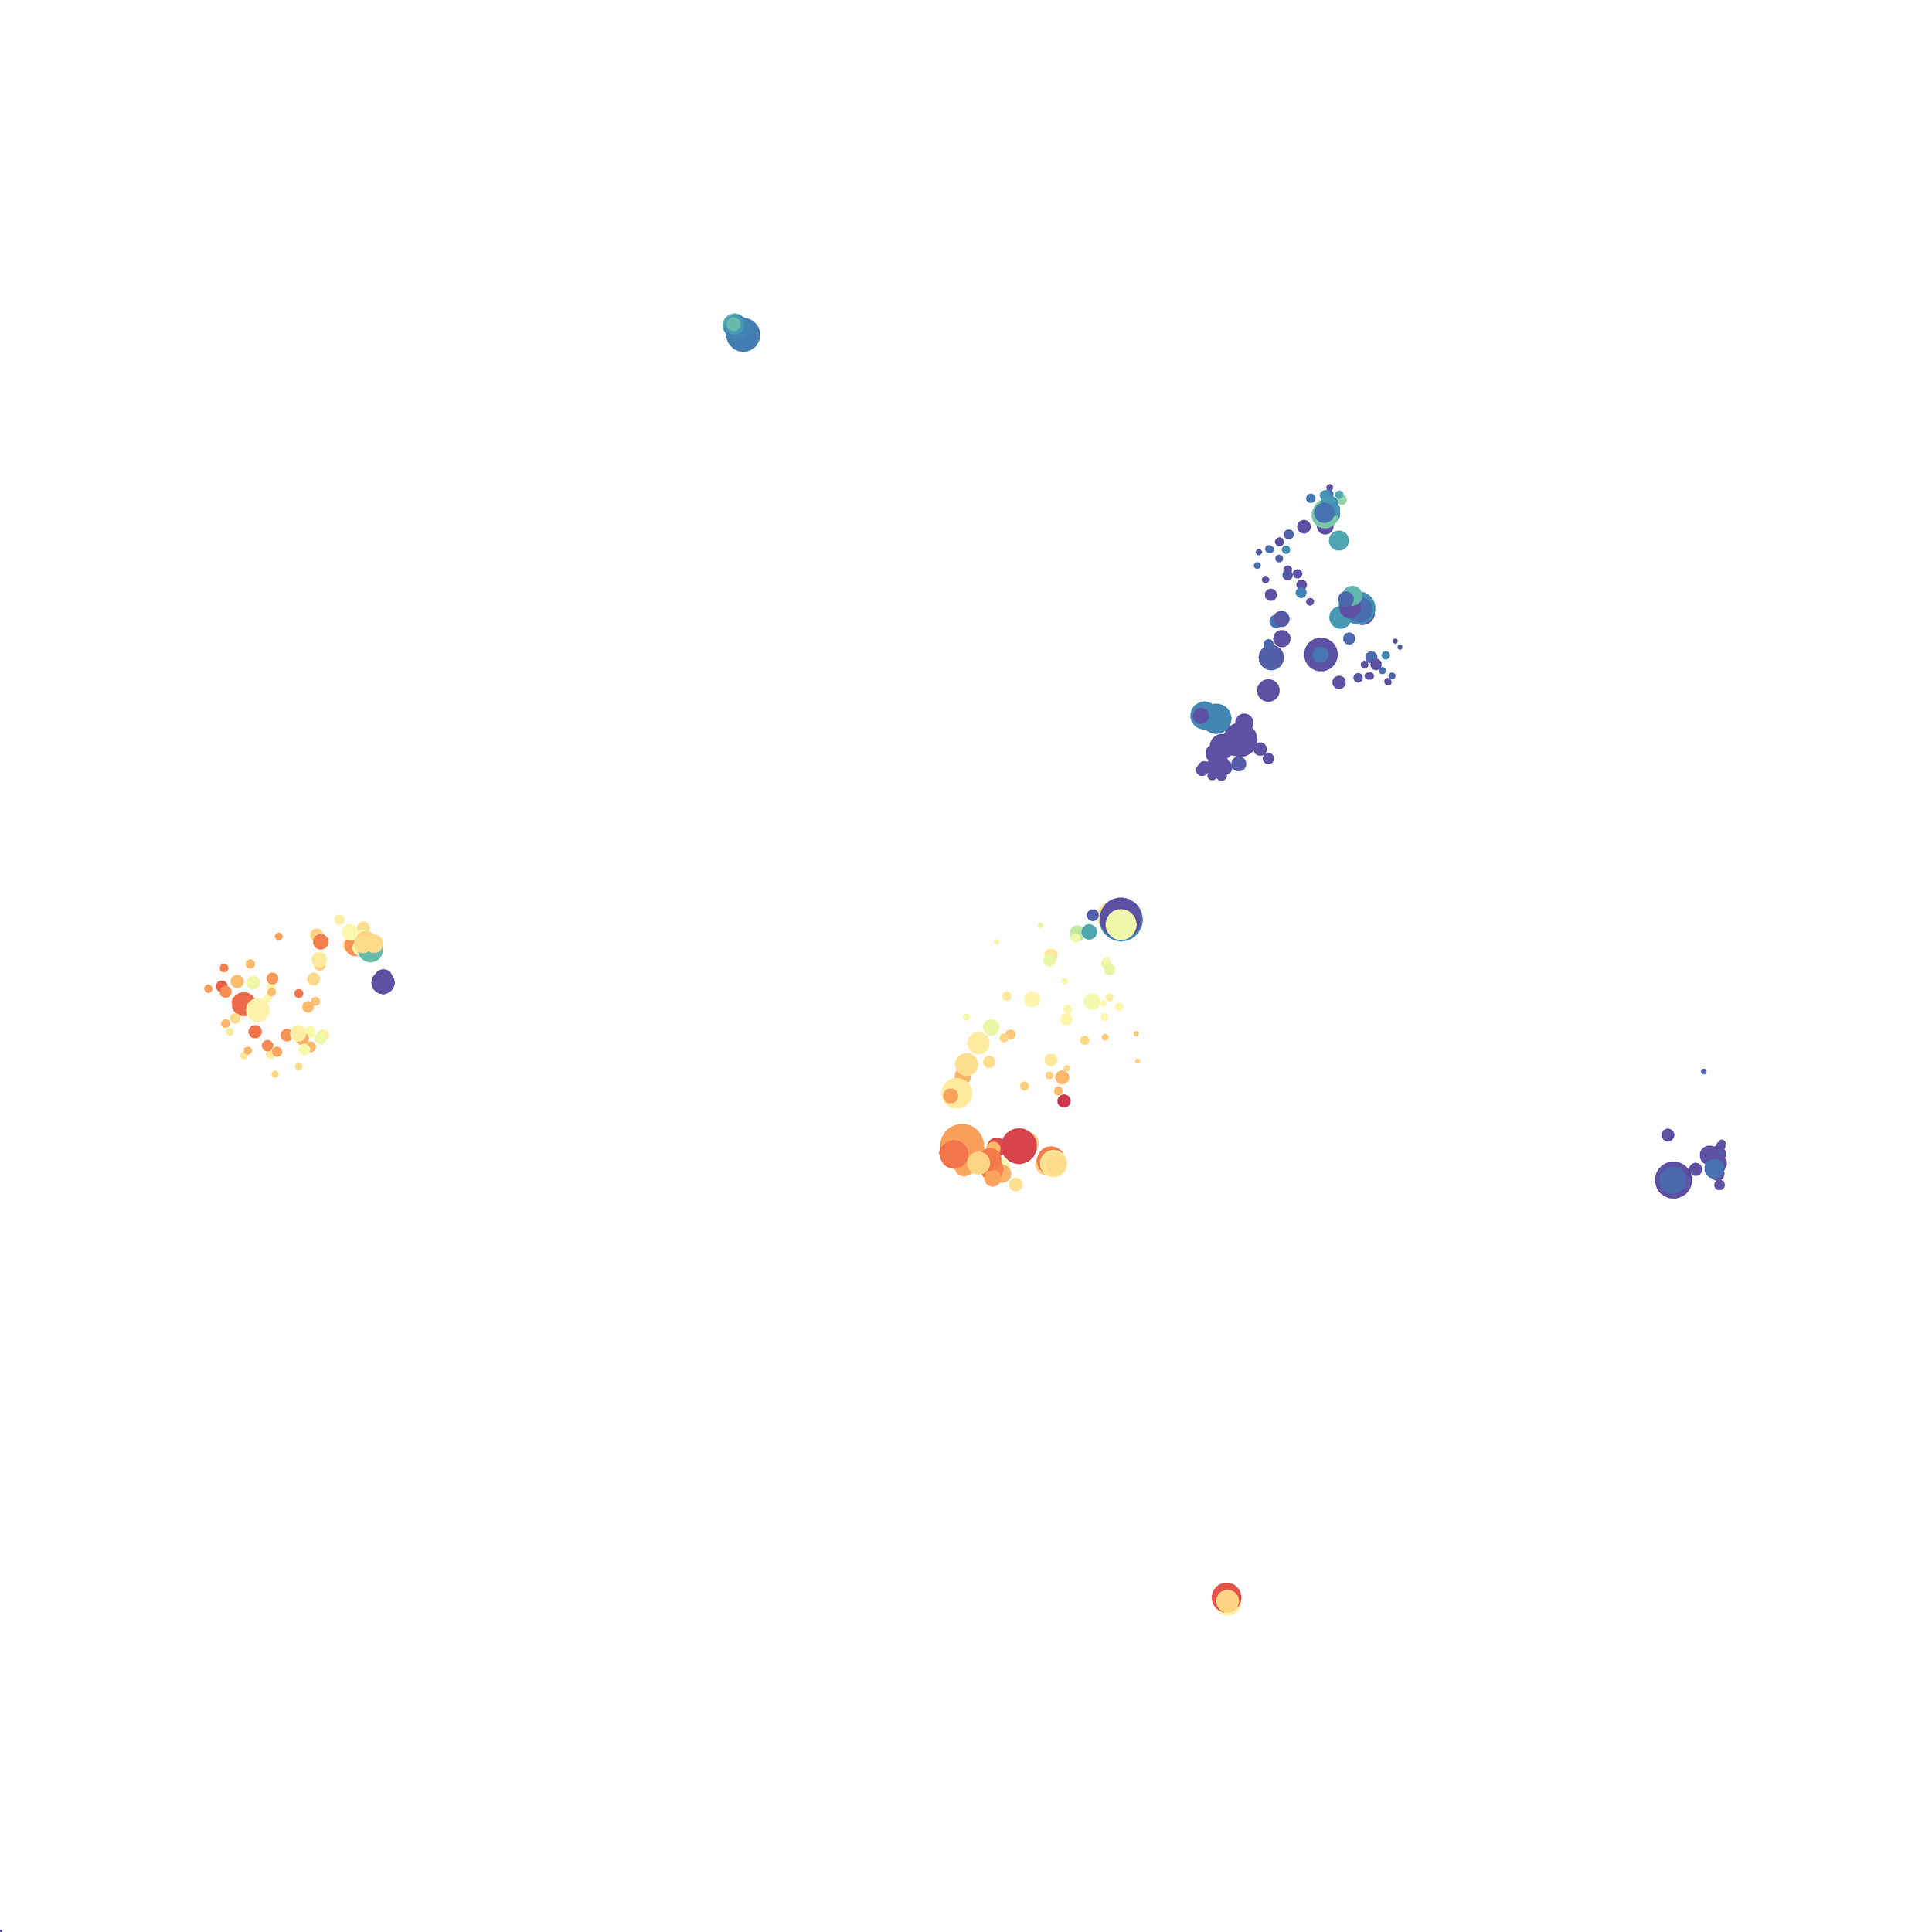
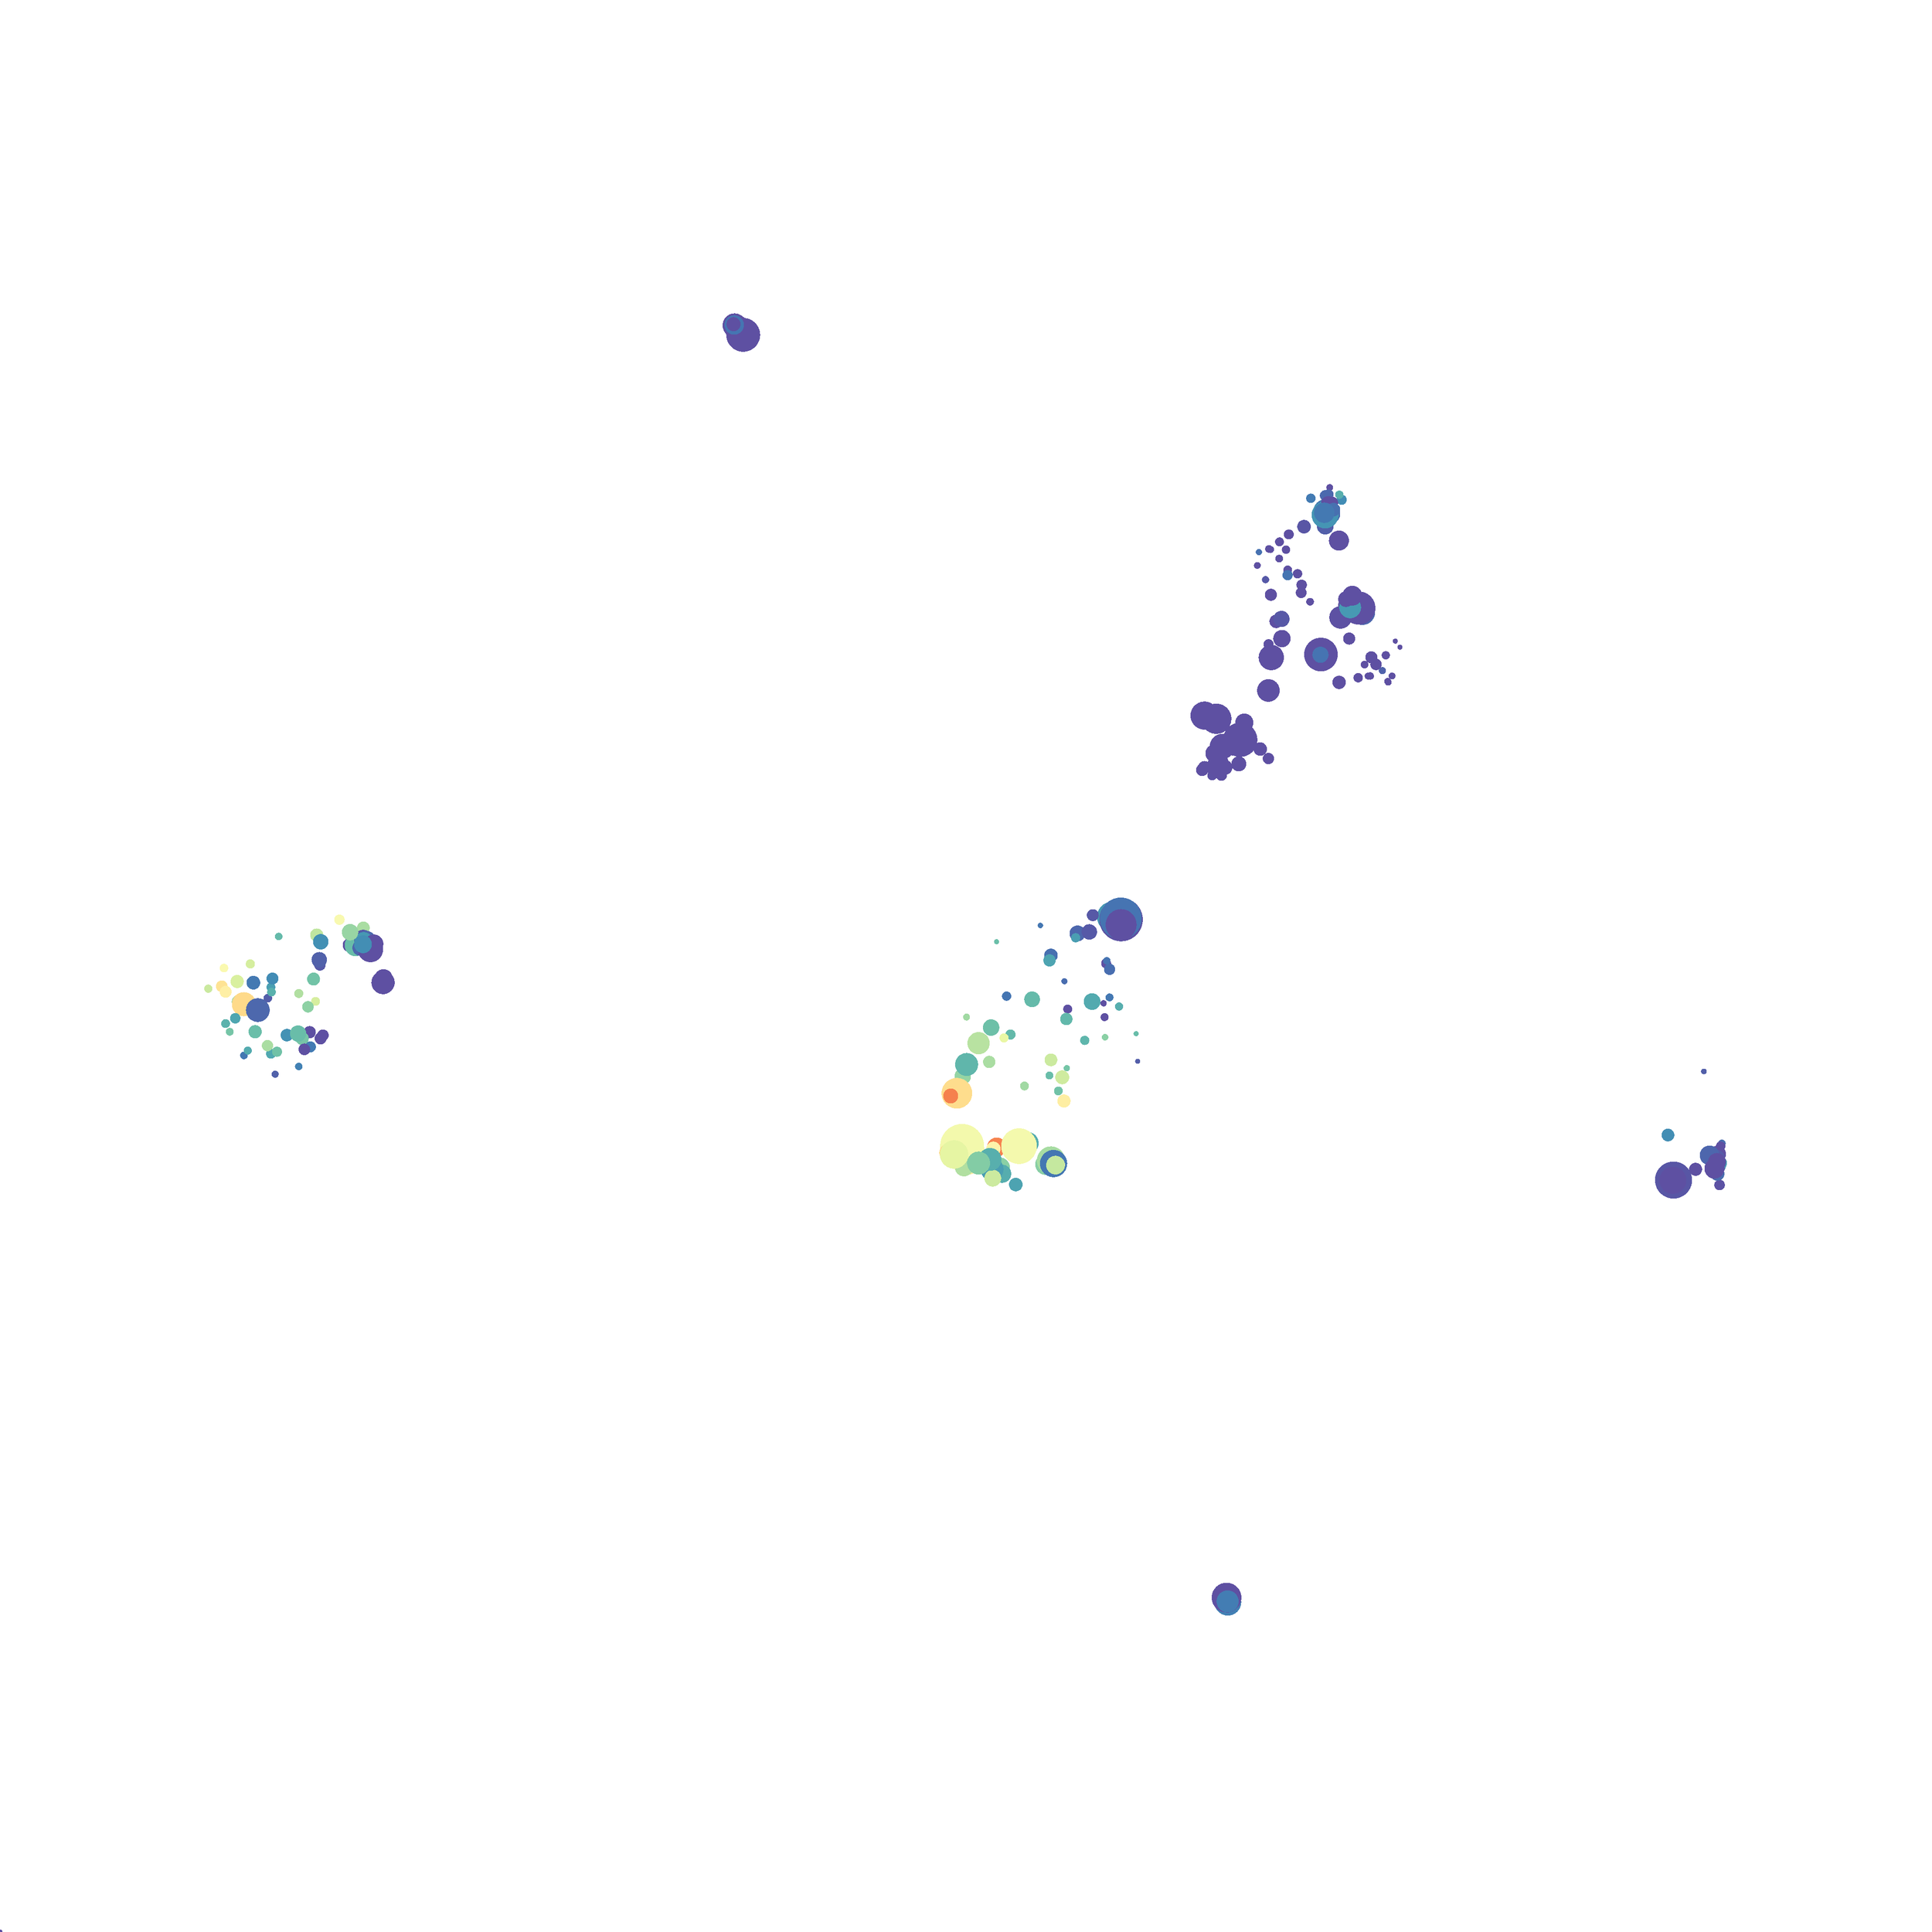
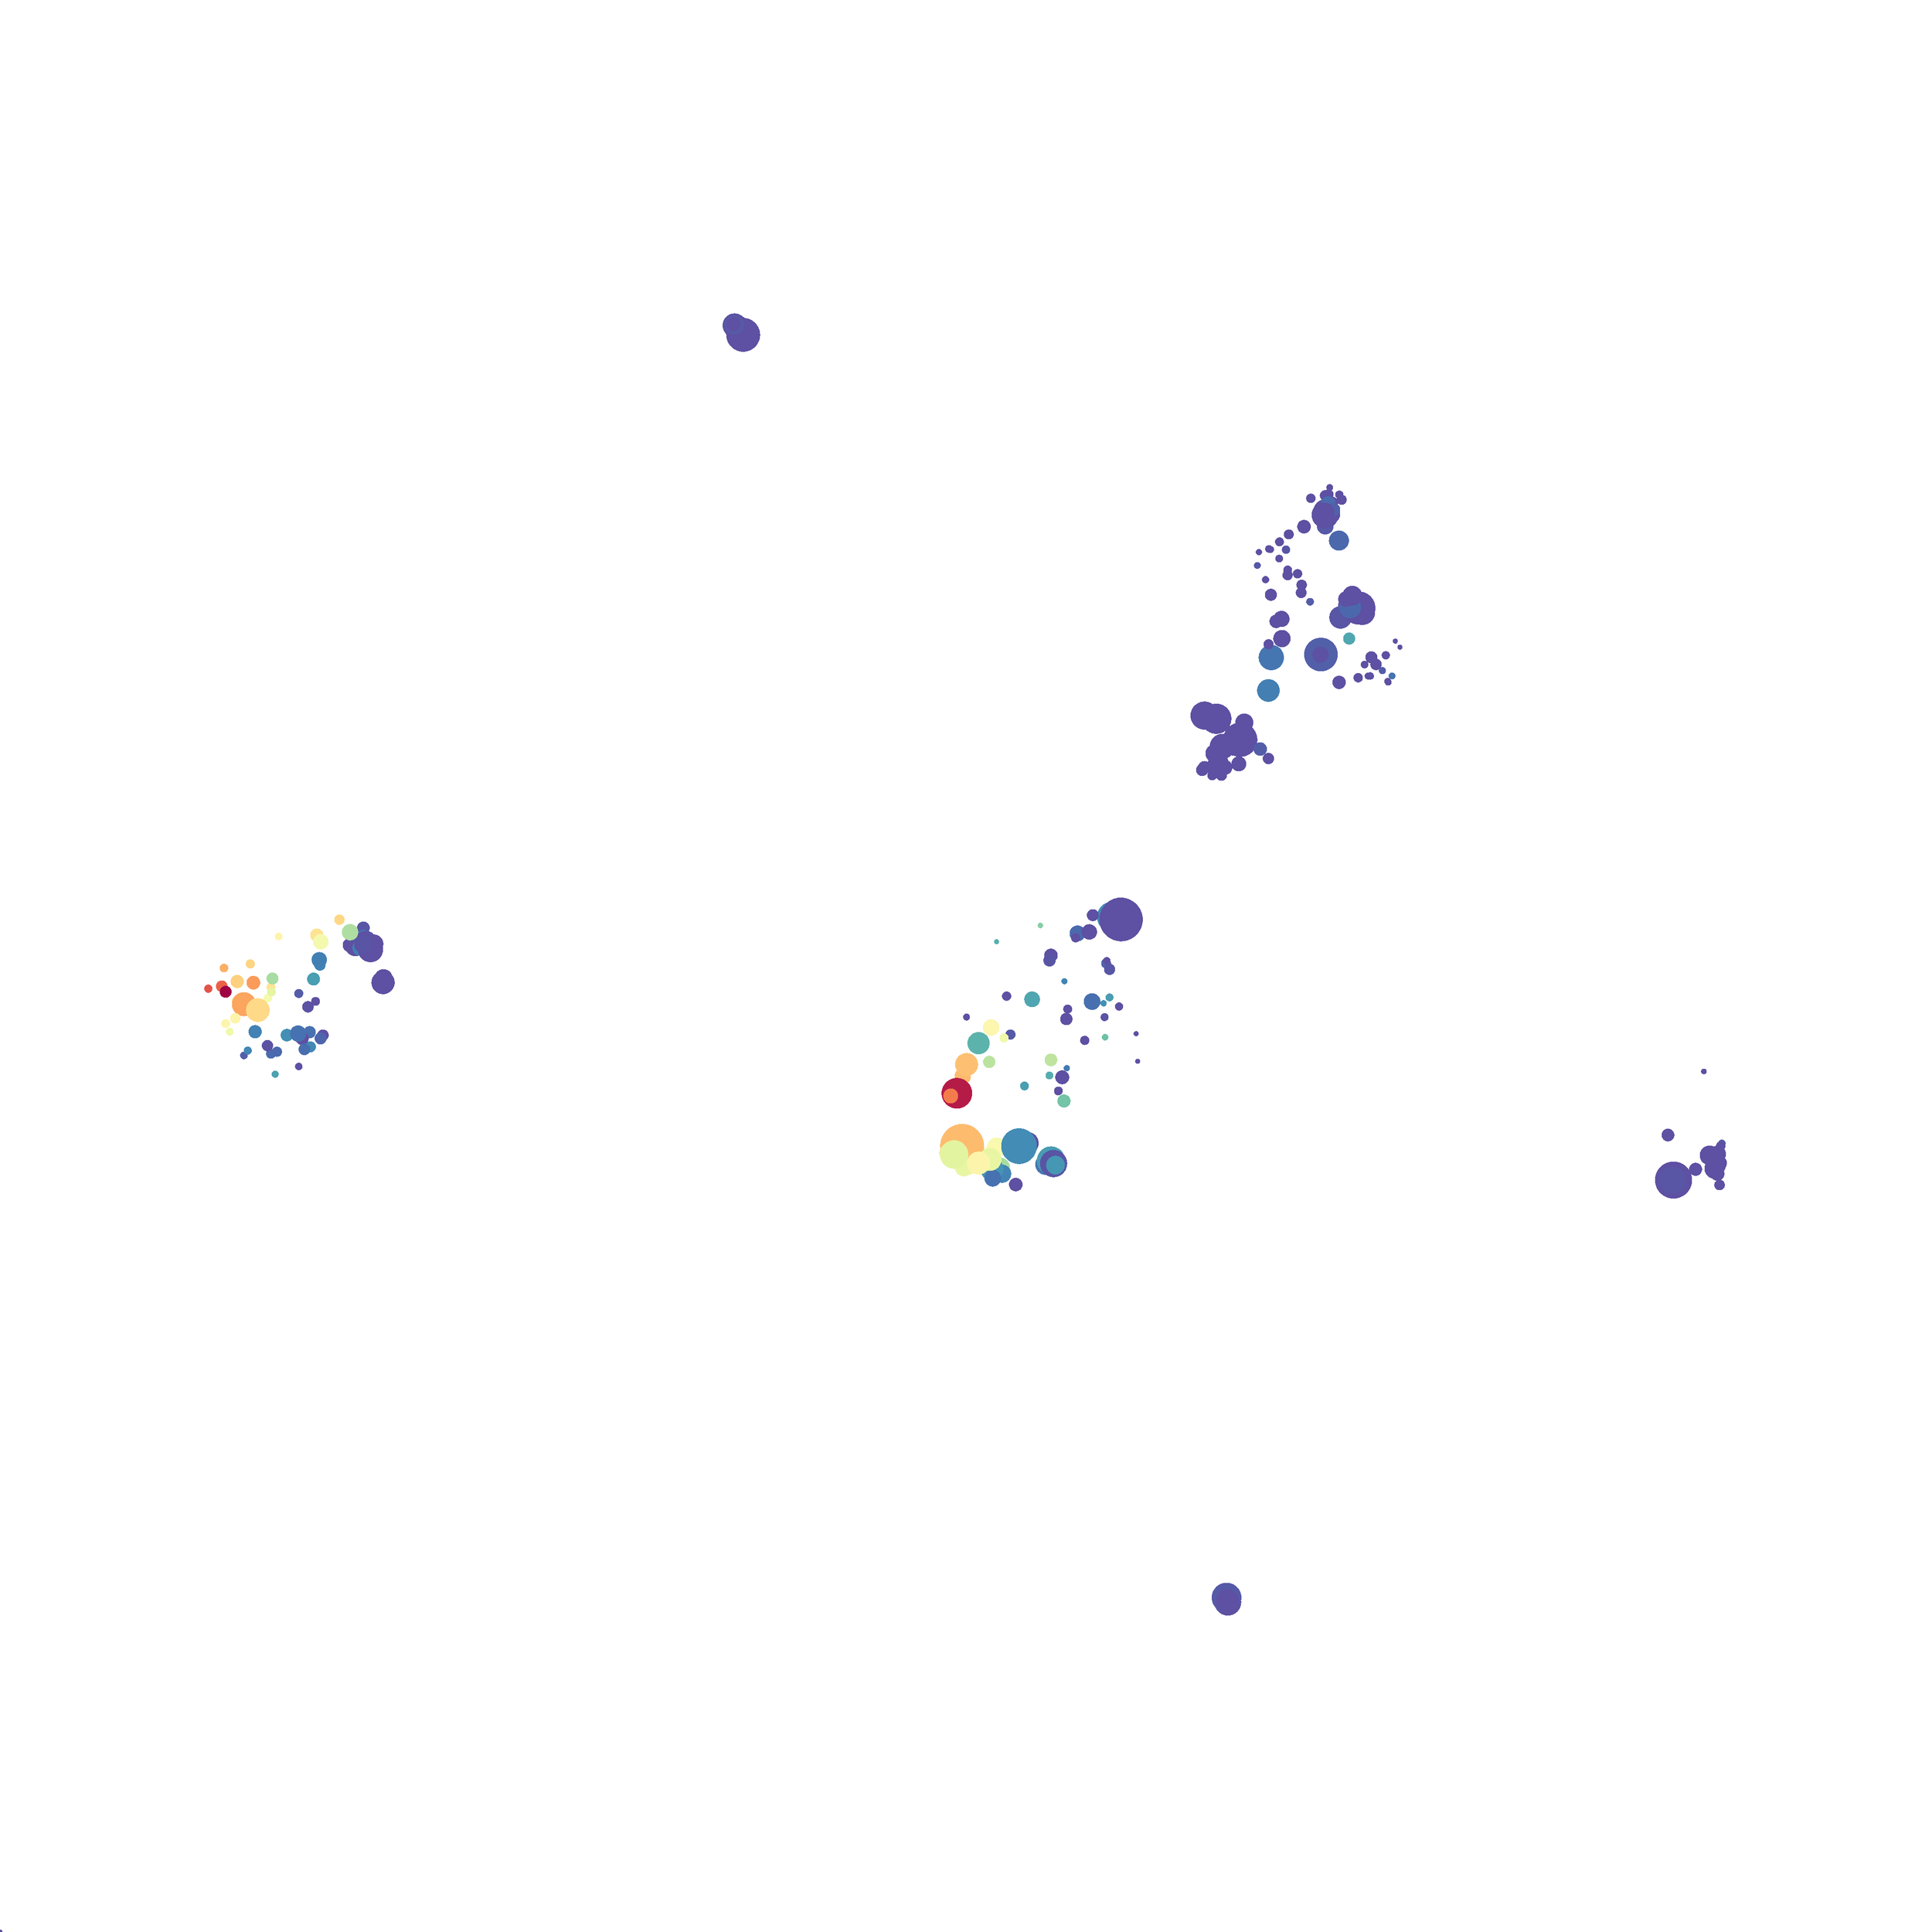
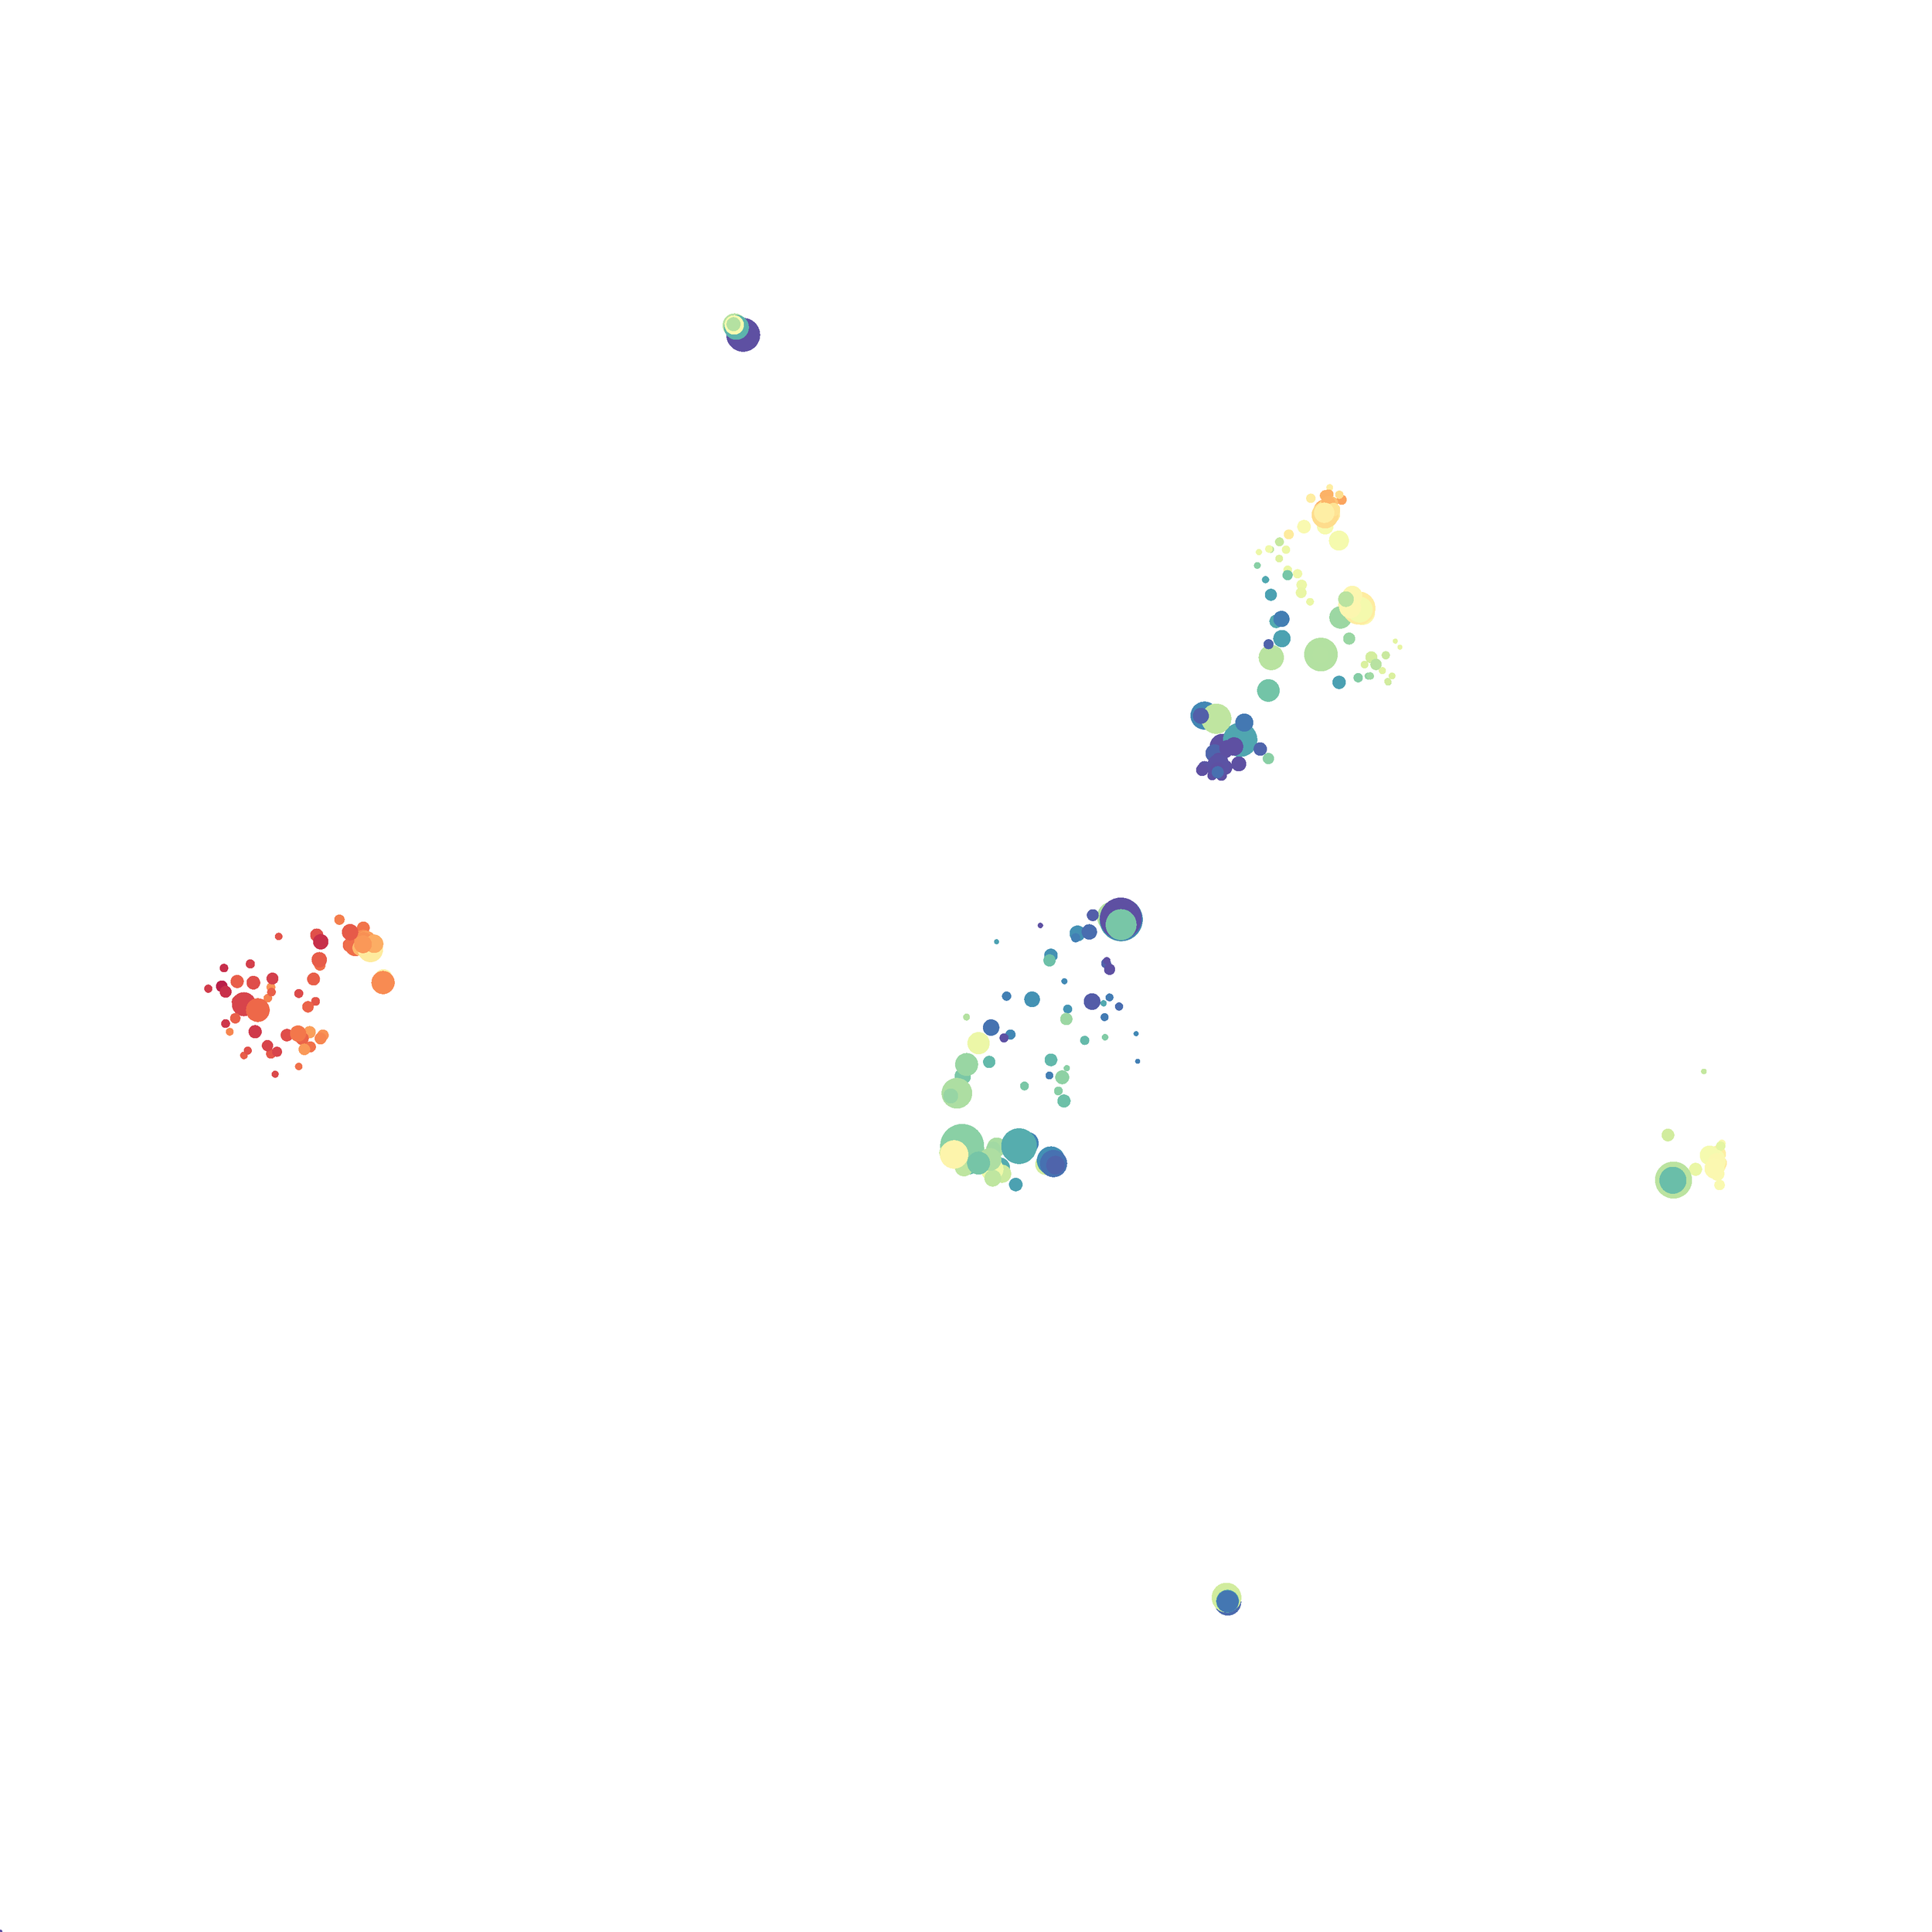
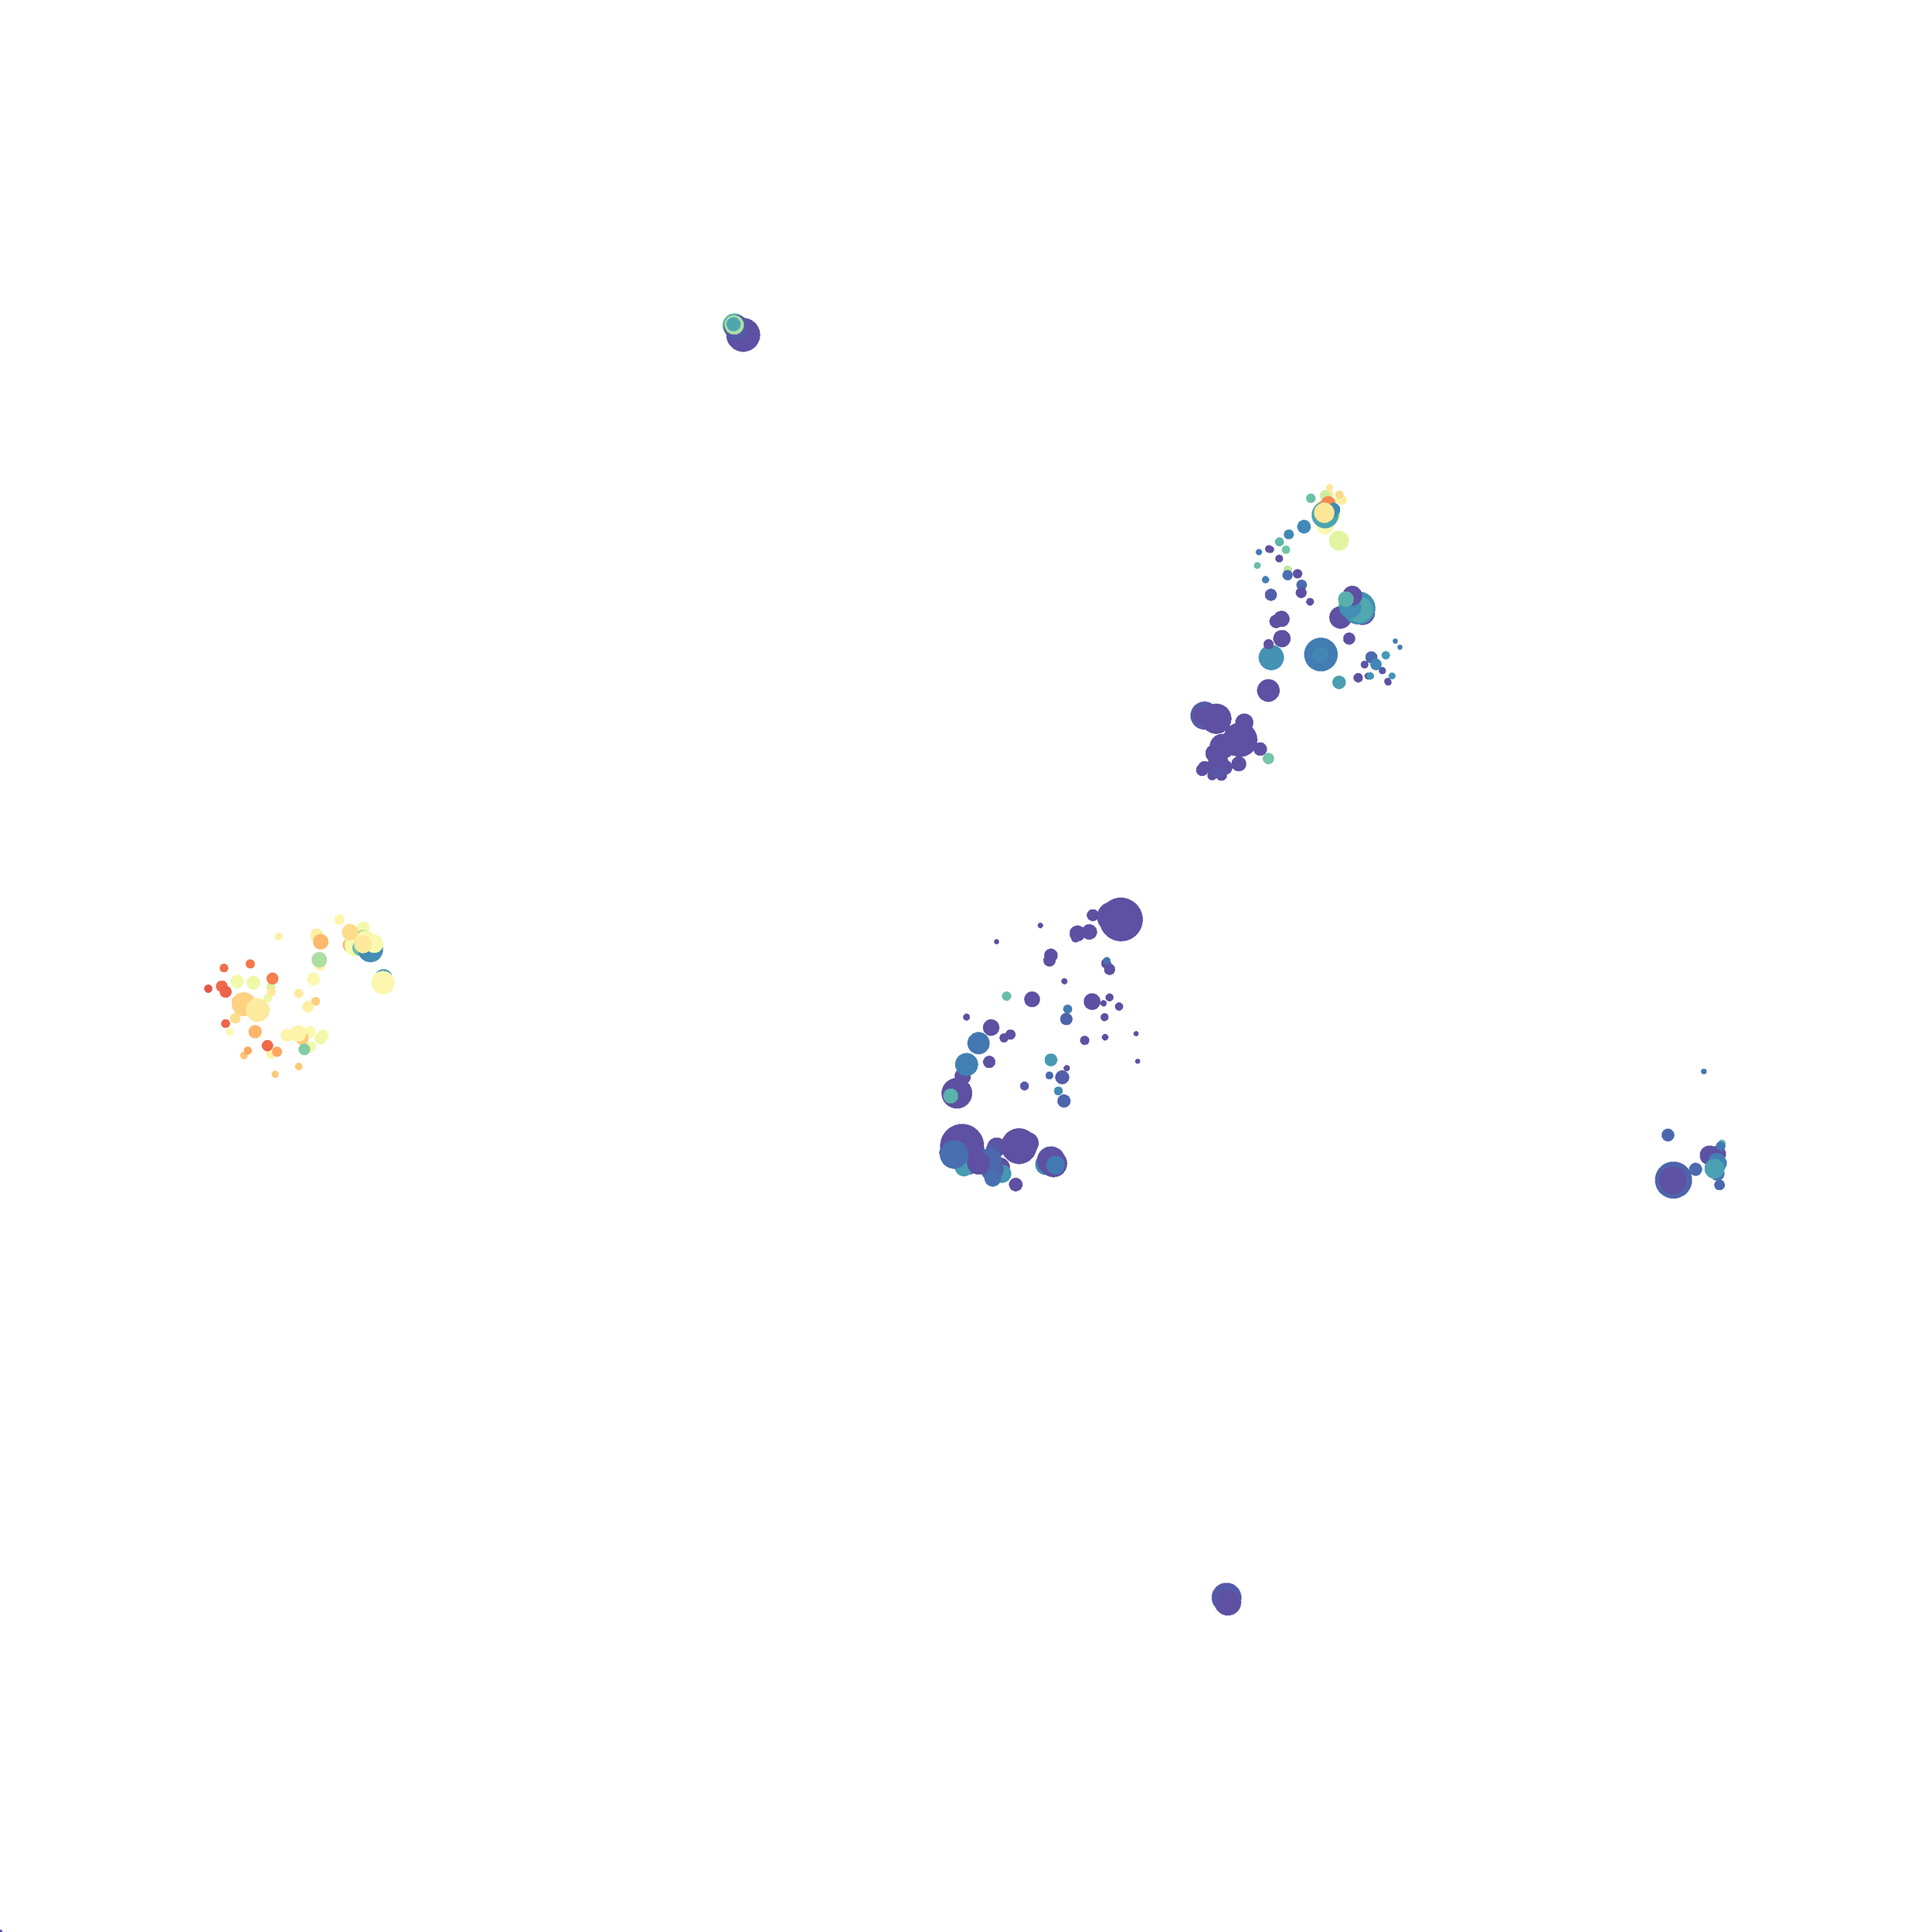
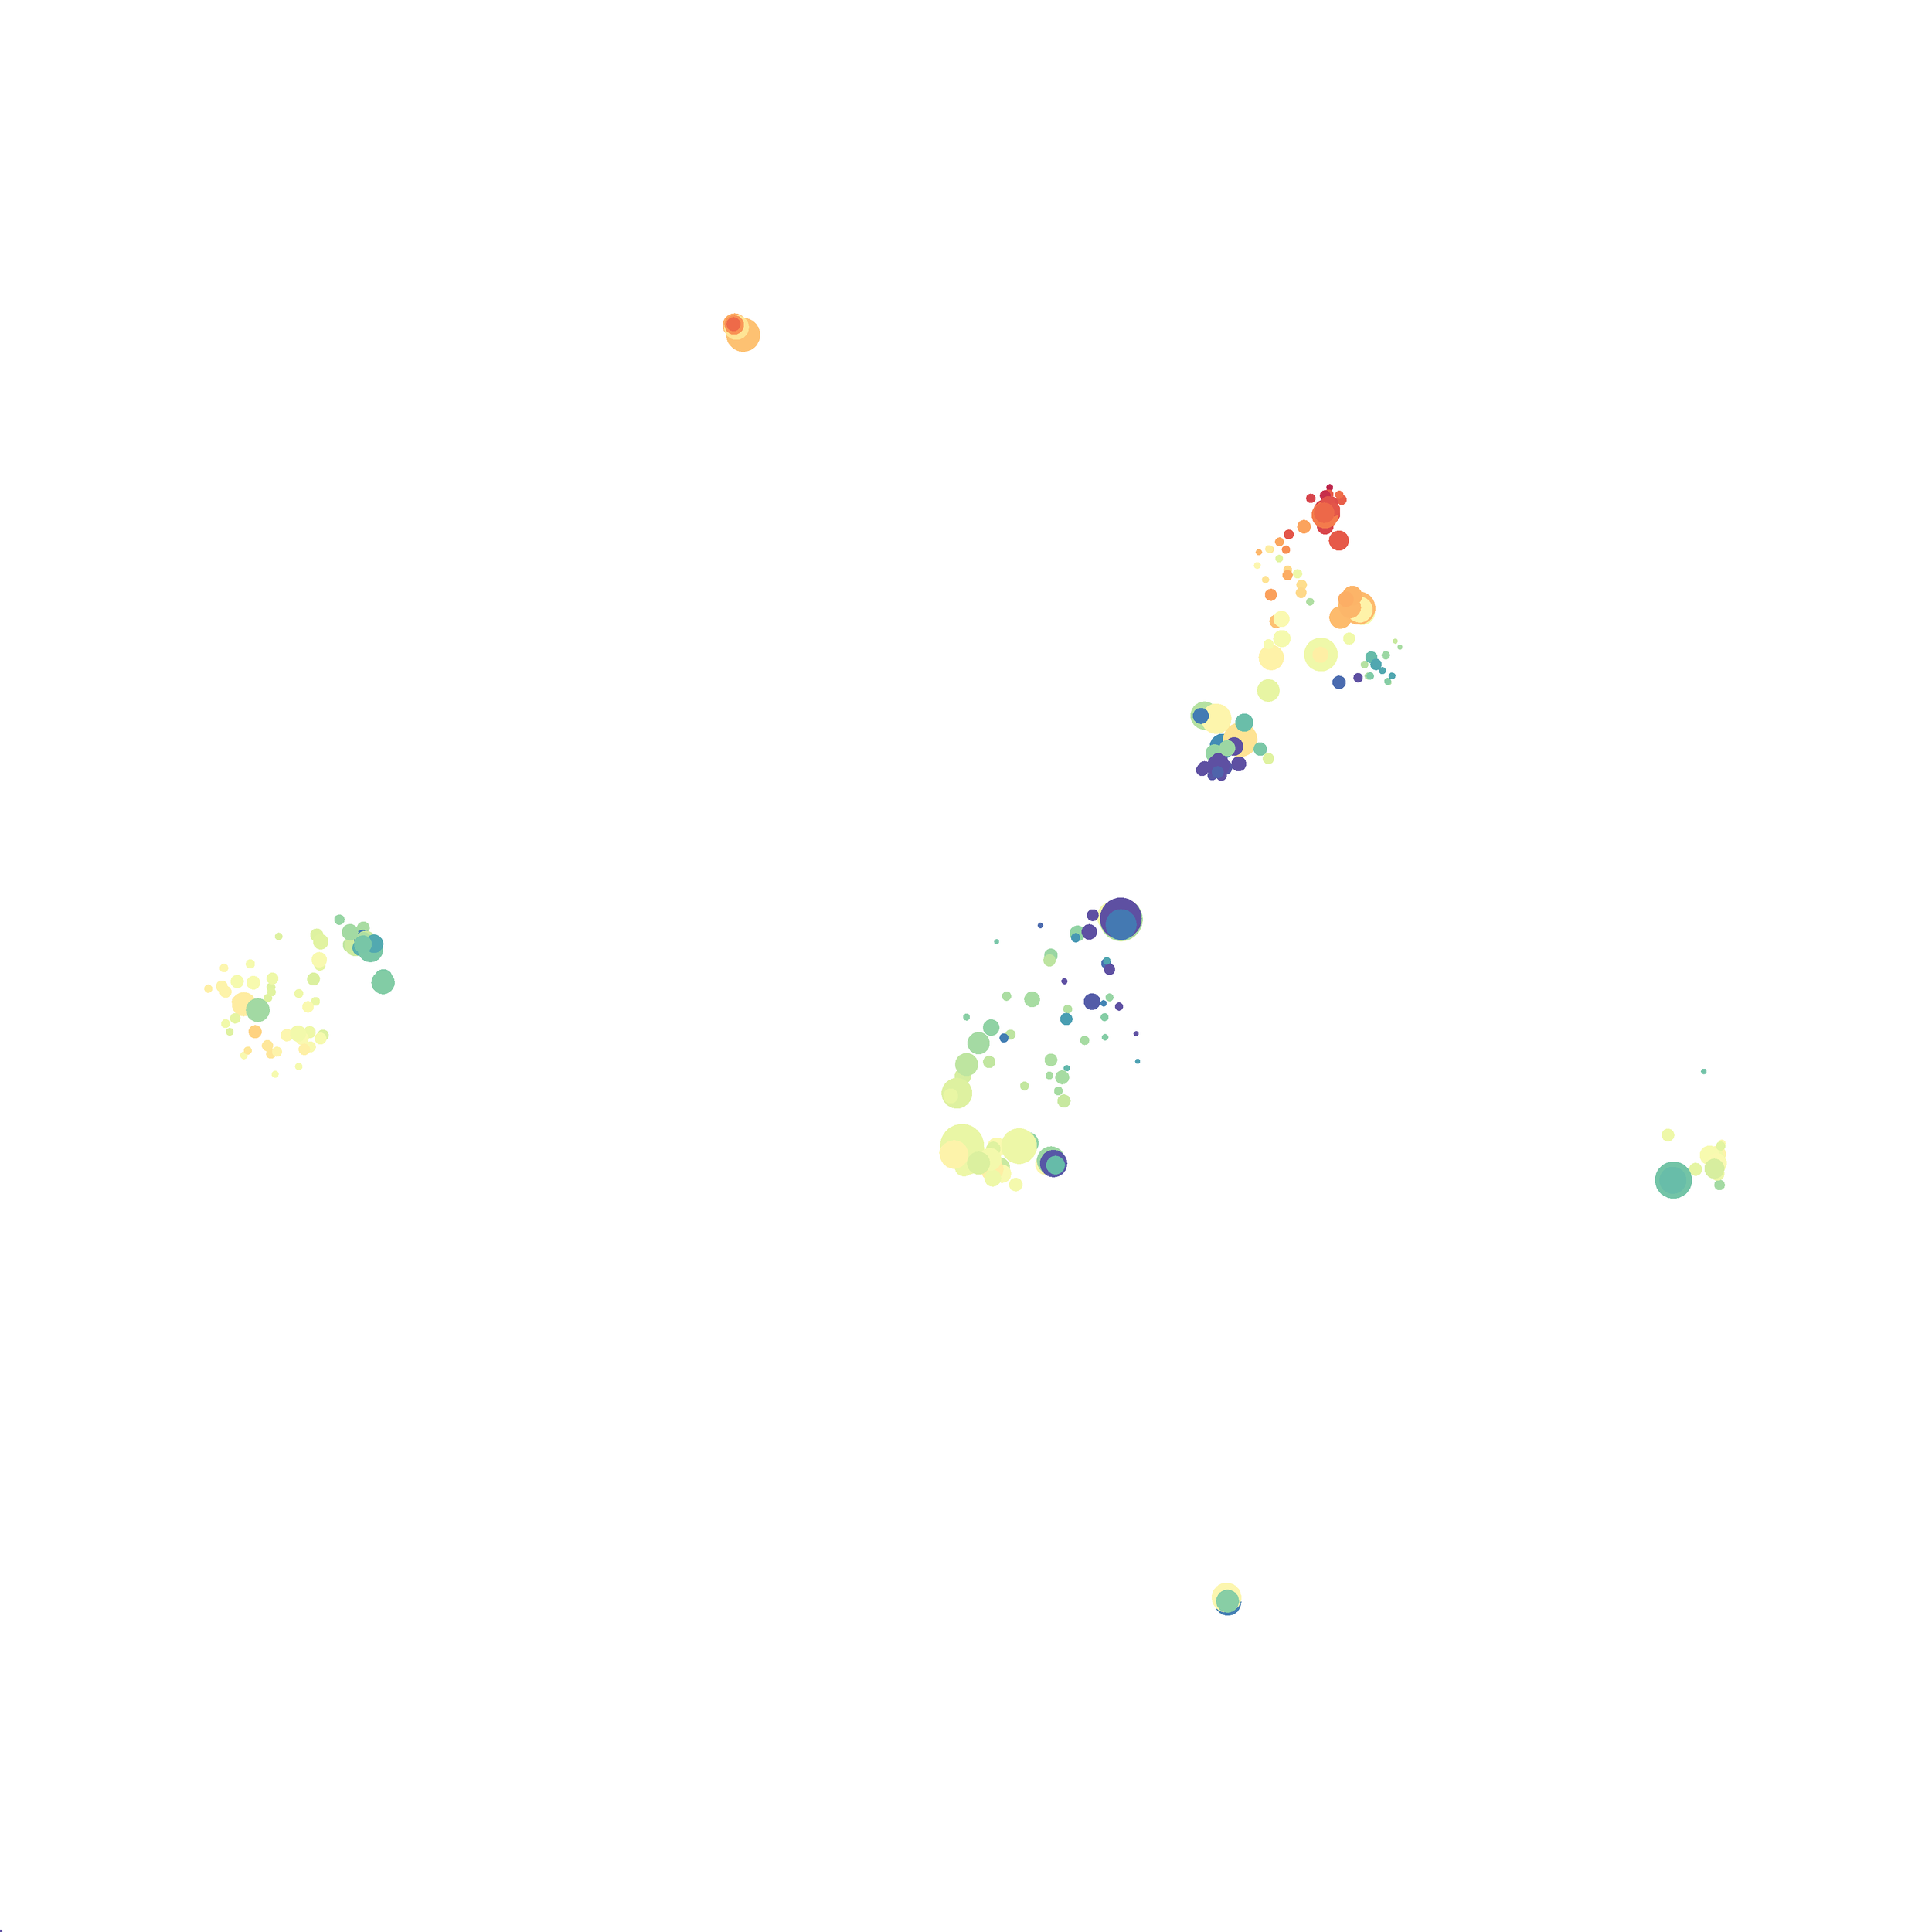
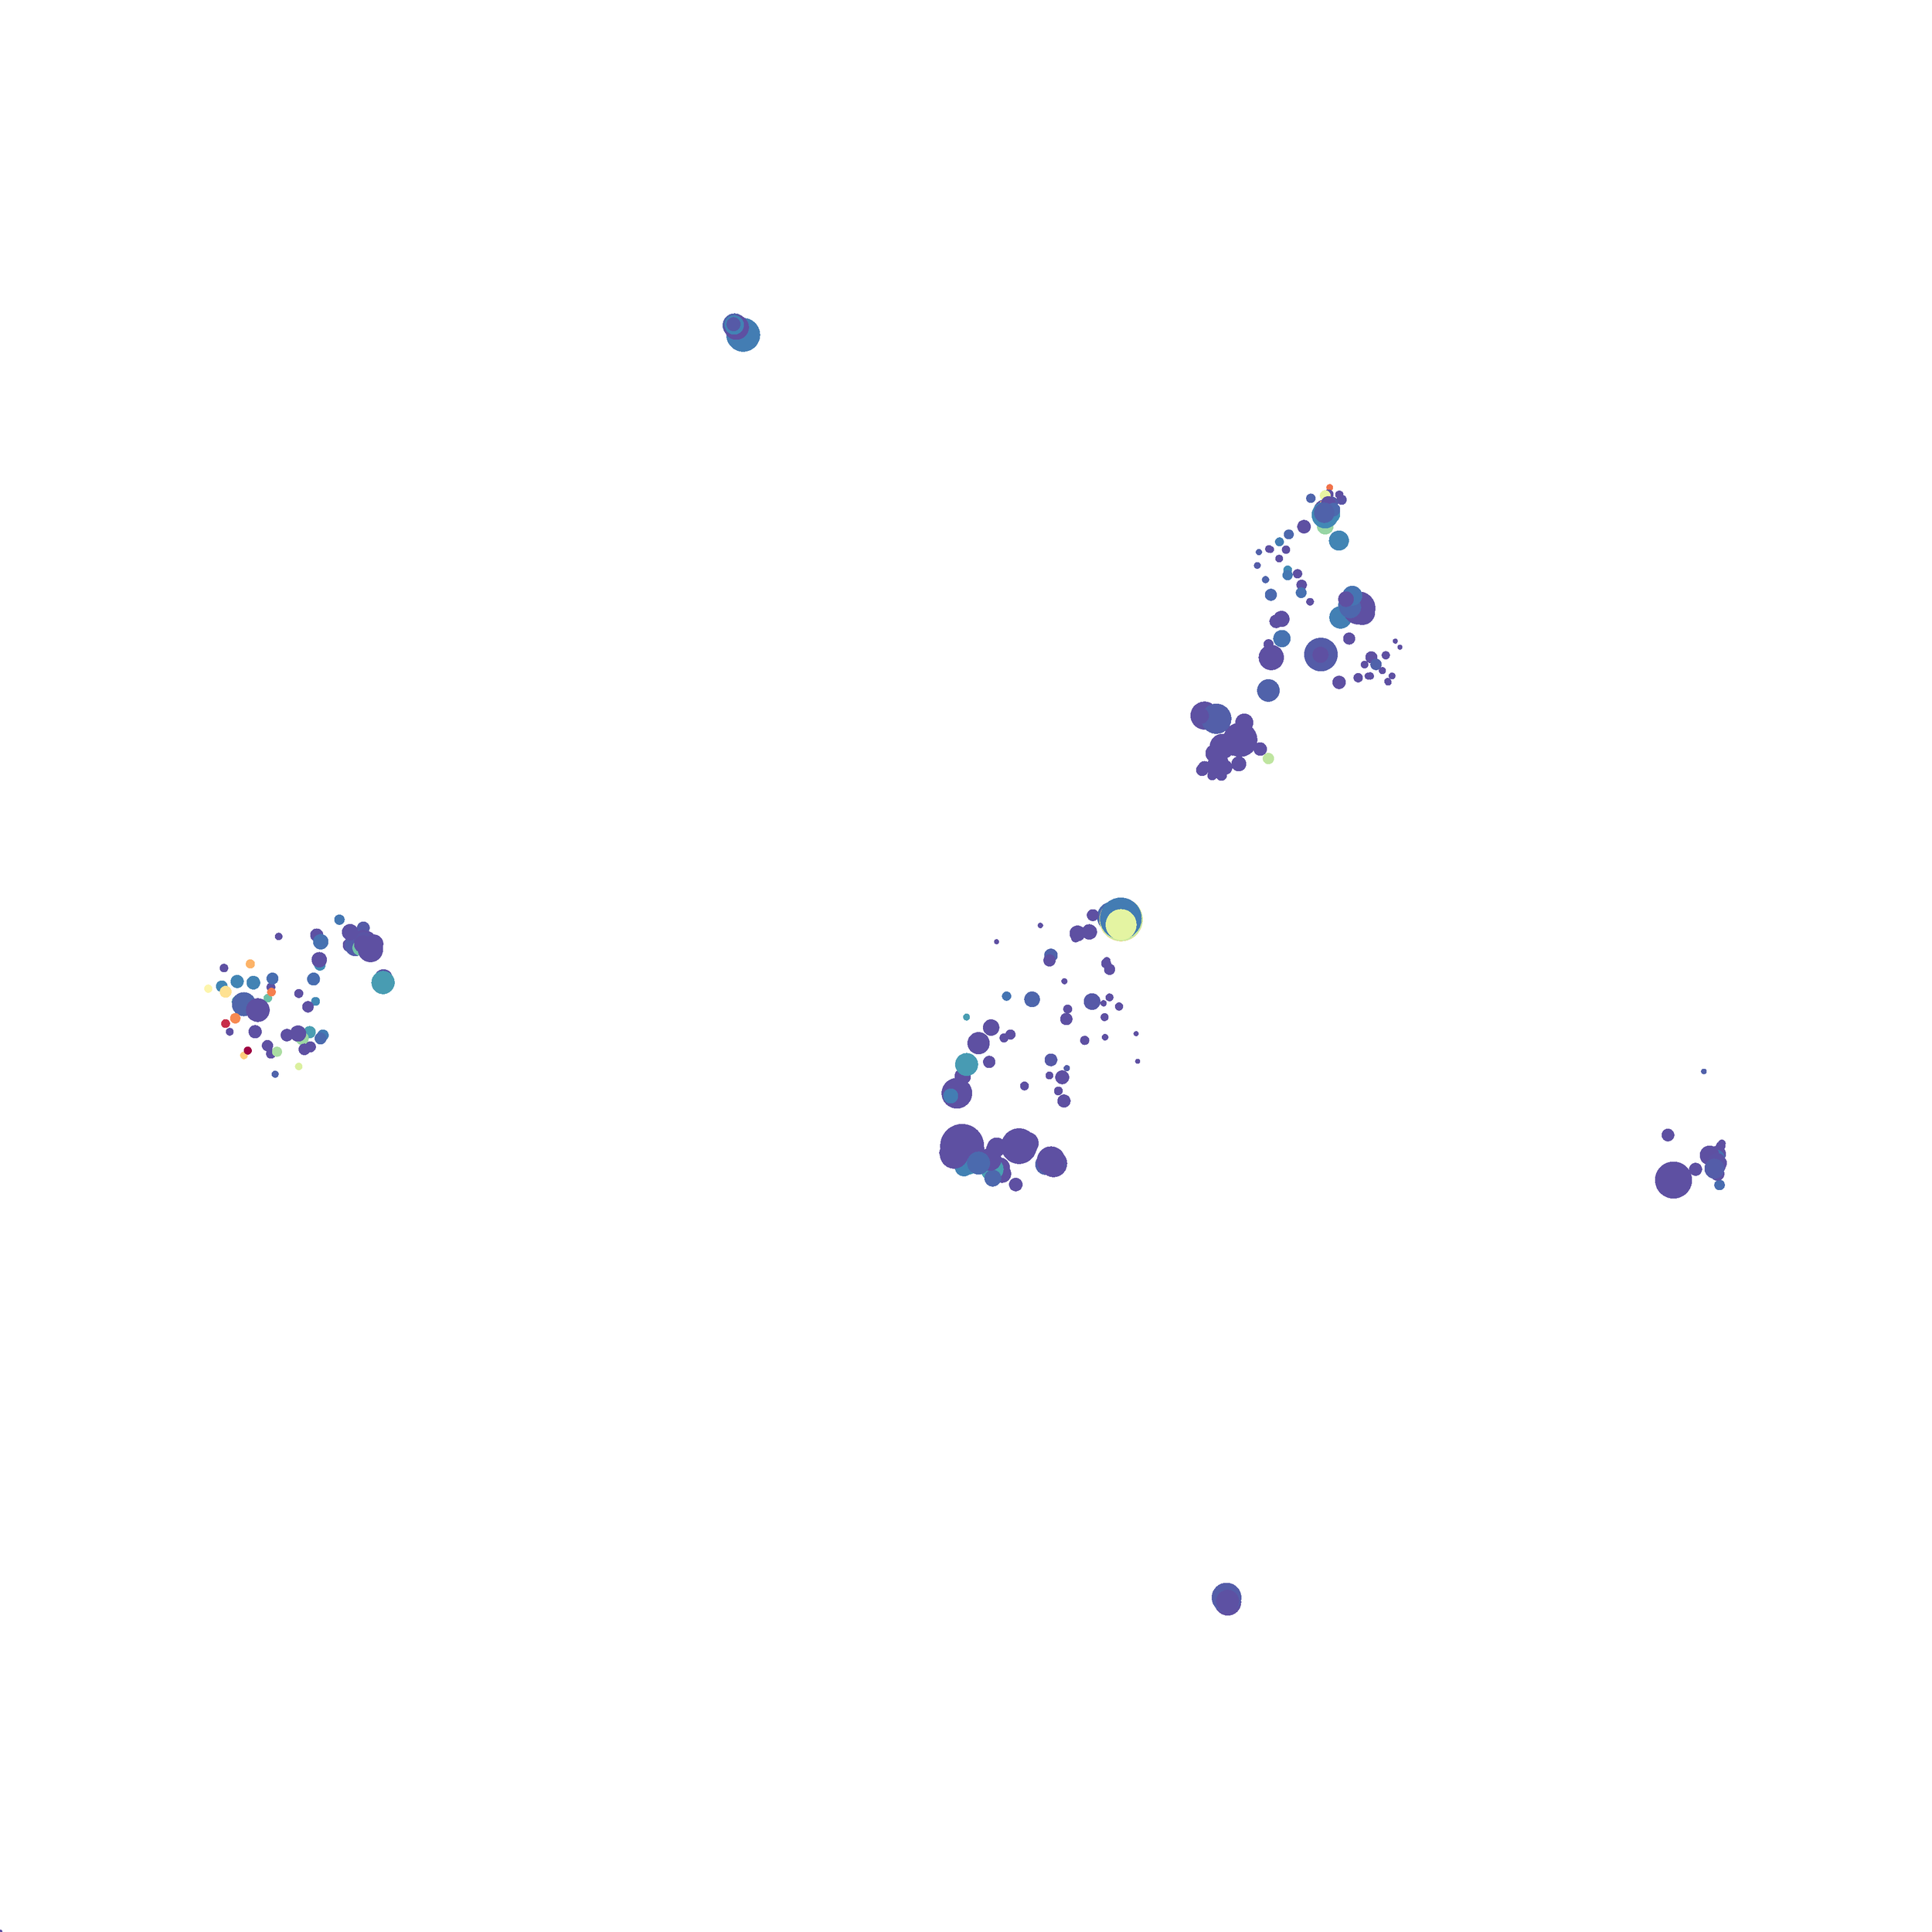
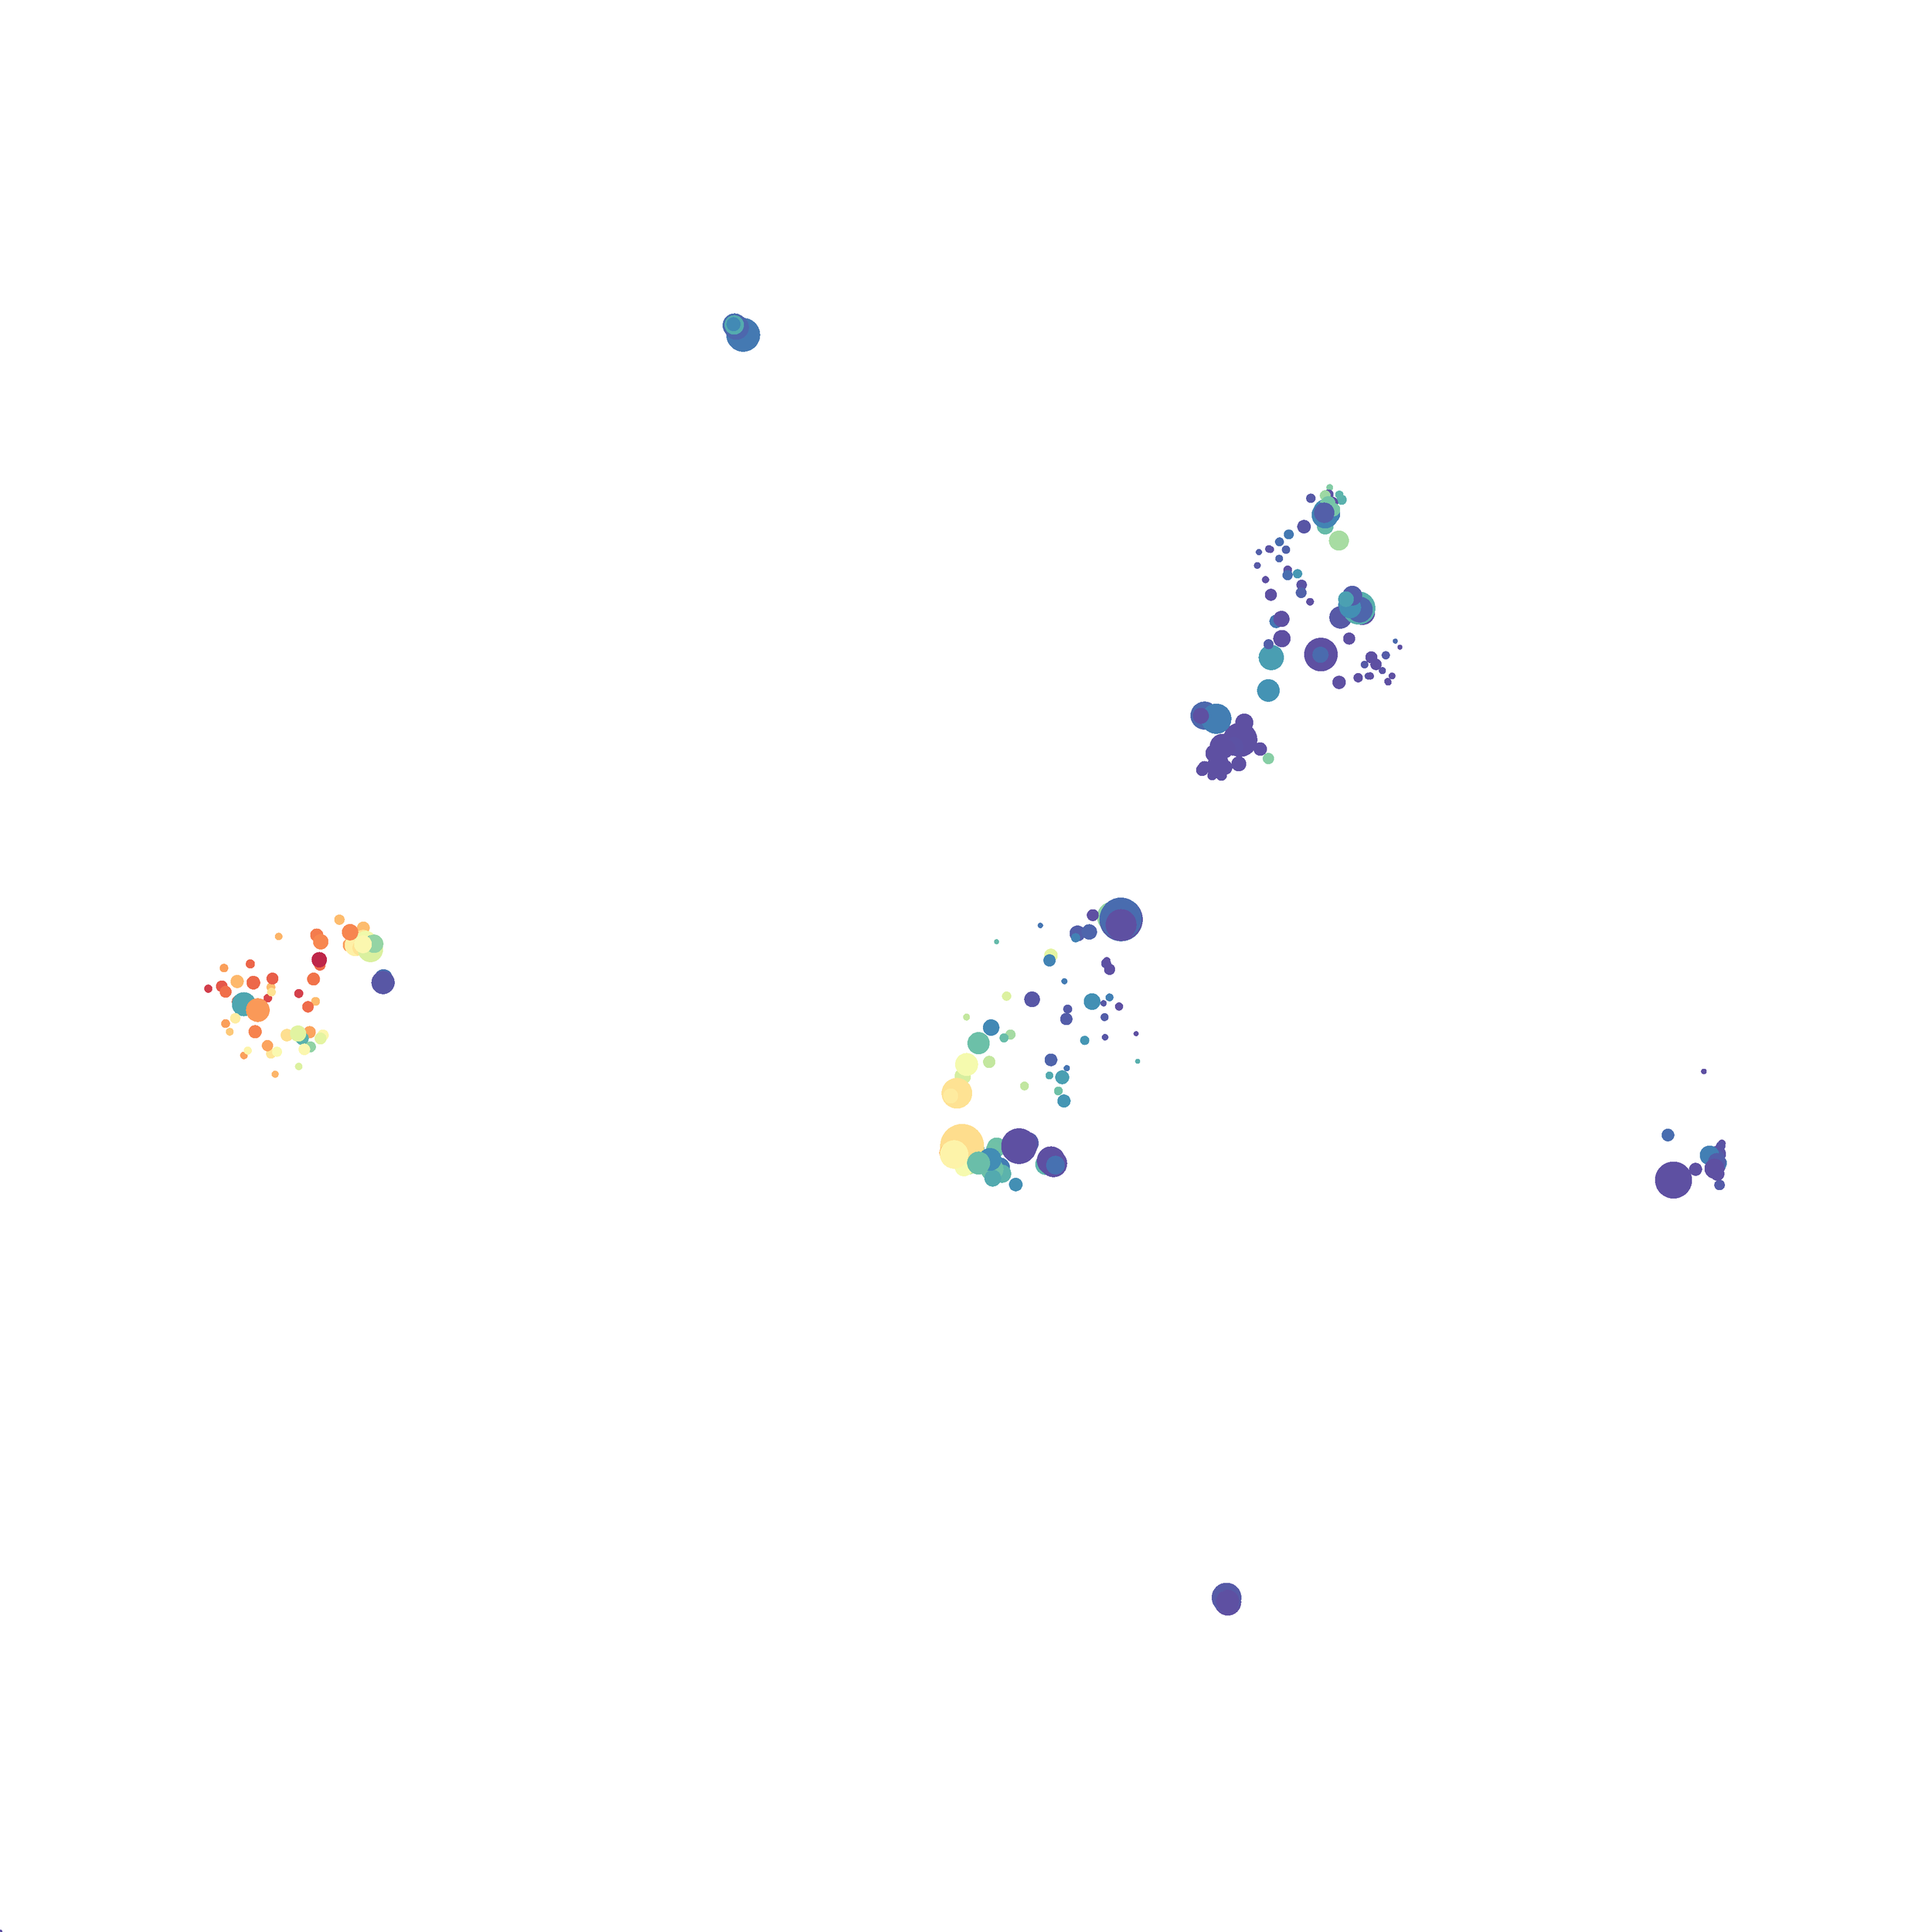
Next, I analyzed the same downsampled events (9,141 events from each sample) by the HSNE algoirthm. It was very fast, it took only 2-3 minutes! Below are the HSNE plots colored by a variety of markers, here they are individually.
Finally, I analyzed the all of the events (1,263,690 events total) by the HSNE algoirthm and it only took 20 minutes! Below are the HSNE plots colored by a variety of markers, here they are individually.
Overall, I think Cytosplore is a very promising tool and is especially great for beginners as it is very intuitive computationally and free to use. Personally, I will use Cytosplore in the future for tSNE anaysis instead of FlowJo or Cytobank. However, I still need to read up on how to interpret HSNE plots... For instance, there are differently sized circles, is this like a SPADE tree and the size of the circle denotes the number of cells in each node? If this is the case, HSNE allows the analysis of millions of events, but it also reduces the resolution of the data by grouping events together (similarly to SPADE, X-shift, and Citrus). For most datasets we analyze there is not a major issue with scalability. However, for researchers with millions of events to analyze, or those interested in rare populations, I think HSNE is a great solution!
-Abby
